As Bitcoin (BTC) continues to trade below the pivotal $90,000 mark with no signs of recovery, the prospect of a bear market is becoming increasingly relevant. Analyst Woominkyu from CryptoQuant has shared insights suggesting that the current market dynamics indicate a transition rather than just a temporary pullback.
Could Bitcoin Be Shifting Into A Bear Phase?
In a report released recently, Woominkyu examined the Bitcoin Cycle Momentum Indicator (BCMI), noting that its return to the 0.5 zone on October 21 was interpreted as a cooling phase, rather than indicative of a market peak.
In the weeks following this observation, Bitcoin’s price has seen a noticeable decline alongside a similar drop in BCMI, suggesting that the market is not only experiencing a cooling period but has also reset in terms of price and on-chain momentum.
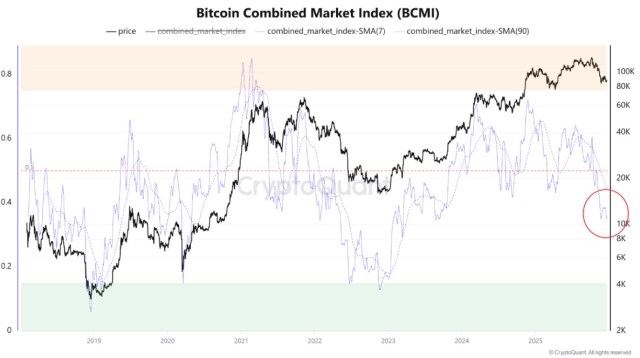
Historically, significant cycle bottoms for Bitcoin in 2019 and 2023 occurred when BCMI levels fell between the 0.25 and 0.35 range. These levels are often associated with full sentiment compression and a structural reset within the market.
Currently, while BCMI remains below equilibrium as seen in the chart above, and it is still above the historical bottom zones. This data suggests that Bitcoin may be shifting into a bear phase rather than recovering from a simple pullback.
According to Woominkyu, a more stable bottom may only materialize if BCMI revisits levels seen during the previous cycles from 2019 to 2023.
Bear Market Conditions
In a separate analysis, CryptoQuant indicated that demand for Bitcoin has sharply declined, reinforcing the idea of a bear market. The report pointed to the significant drop in Bitcoin demand growth that has occurred since early October 2025.
Moreover, the report highlights that institutional and large-holder demand is contracting instead of expanding. US spot Bitcoin exchange-traded funds (ETFs) have converted into net sellers during the fourth quarter of 2025, offloading approximately 24,000 BTC.
Additionally, the number of addresses holding between 100 and 1,000 BTC, which typically represent ETFs and treasury firms, is also increasing at a rate below the trend, reflecting the demand deterioration that preceded the bear market of 2022.
The condition of the derivatives markets further corroborates the weakening appetite for risk. Funding rates in perpetual futures have dropped to their lowest levels since December 2023.
Historically, such declines in funding rates indicate a reduced willingness to maintain long positions, a phenomenon commonly associated with bear market conditions rather than bullish trends.
Technical analysis also reveals the deterioration of Bitcoin’s price structure, with the cryptocurrency falling below its 365-day moving average—a crucial long-term support level that has historically delineated bull and bear markets.
Looking ahead, historical data suggests that Bitcoin’s bear market bottoms typically align with its realized price, currently estimated around $56,000. This implies a potential drawdown of approximately 55% from the recent all-time high.
Intermediate support is anticipated around the $70,000 level, suggesting a relatively shallow bear market compared to previous cycles.

At the time of writing, BTC was trading at $87,635. This represents year-to-date losses of 10%, as well as a 30.5% gap compared to all-time highs of just above $126,000.
Featured image from DALL-E, chart from TradingView.com