Cysic ($CYS) has shown impressive growth, gaining over 360% in seven days amid a sharp increase in trading activity. The token has climbed to around $1.34 after attracting more active participation in spot and derivative markets. However, the latest move warrants caution as leveraged activity and exchange activity have risen sharply.
$CYS has also approached a significant technical barrier around $1.37 as traders assessed whether the uptrend could continue. Notably, the strongest price increase began before Upbit opened new $CYS markets. This timing suggests that speculation around the listing may have contributed to fueling demand ahead of the official start of trading.
The $CYS Momentum Accelerates
$CYS is currently trading around $1.34, giving the token a market capitalization of about $215 million. The 24-hour trading volume reached approximately $72.3 million.
Moreover, $CYS has risen about 44% in the last 24 hours. Its seven-day gain now exceeds 362%.
The four-hour chart shows a consistent bullish structure. The price remains comfortably above the 20, 50, 100, and 200 EMAs.
Additionally, the SuperTrend indicator continues to support the bullish uptrend. However, the sharp acceleration creates room for short-term profit-taking.
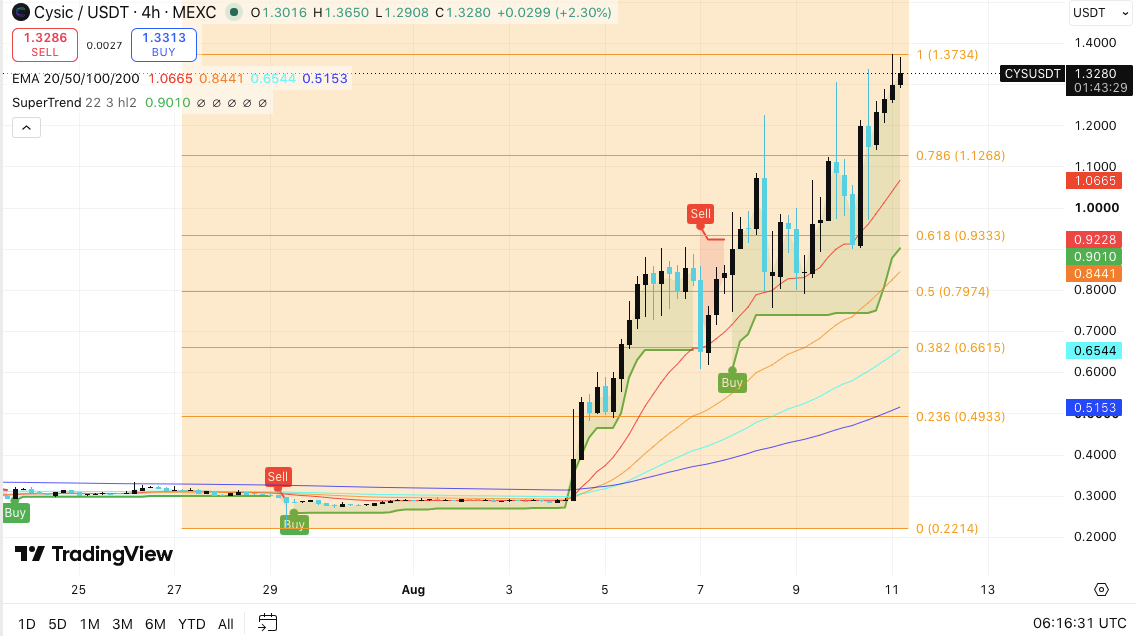
$CYS is currently facing resistance around $1.3734, which is an important Fibonacci level. A decisive move above this barrier could strengthen the next bullish phase.
The $1.40 level becomes the next psychological hurdle for buyers. At the same time, a rejection could lead to a decline in $CYS value towards $1.2680. This level corresponds to the 0.786 Fibonacci support and currently represents the first major downside checkpoint.
Related: Chainlink Price Forecast: Standard Chartered Sets $200 Target for LINK as Oracles Hit $33.43T
Below that, traders may watch $1.0665, where the 20 EMA is currently located. Further support appears around $0.9333 and $0.7974.
Upbit Timing Adds Another Market Catalyst
Upbit announced trading for $CYS on August 10, initially expecting a launch at 14:00 KST. The exchange planned for $CYS/$BTC and $CYS/$USDT markets.
In addition to spot trading, Upbit also planned to support the underlying network for deposits and withdrawals.
However, the exchange later changed the launch schedule. First, it postponed trading from 14:00 KST to 17:00 KST.
Market Support Cysic($CYS)
— Upbit Korea (@Official_Upbit) August 10, 2026
✅ Supported Markets: $BTC, $USDT Market
📅 Trading opens at: 2026-08-10 14:00 KST (estimated time)
🔗Discover more:https://t.co/NjtgGHhkwu#Upbit #$CYS@cysic_xyz pic.twitter.com/e5sorB48MP
Upbit then delayed the opening again, postponing it to 20:00 KST. The second adjustment occurred shortly before the revised opening time.
Importantly, $CYS had already recorded significant gains before the initial listing schedule. Thus, the rally did not follow an immediate exchange listing reaction.
Instead, traders could have anticipated greater liquidity and visibility from the Upbit announcement. Consequently, listing expectations may have contributed to the earlier price acceleration.
Open Interest Signals Rising Leverage
$CYS open interest remained relatively calm in the $15 to $30 million range until the end of July. The market changed sharply in August.
Open interest grew to approximately $79.92 million on August 11. The price also reached about $1.26 during the recorded spike.
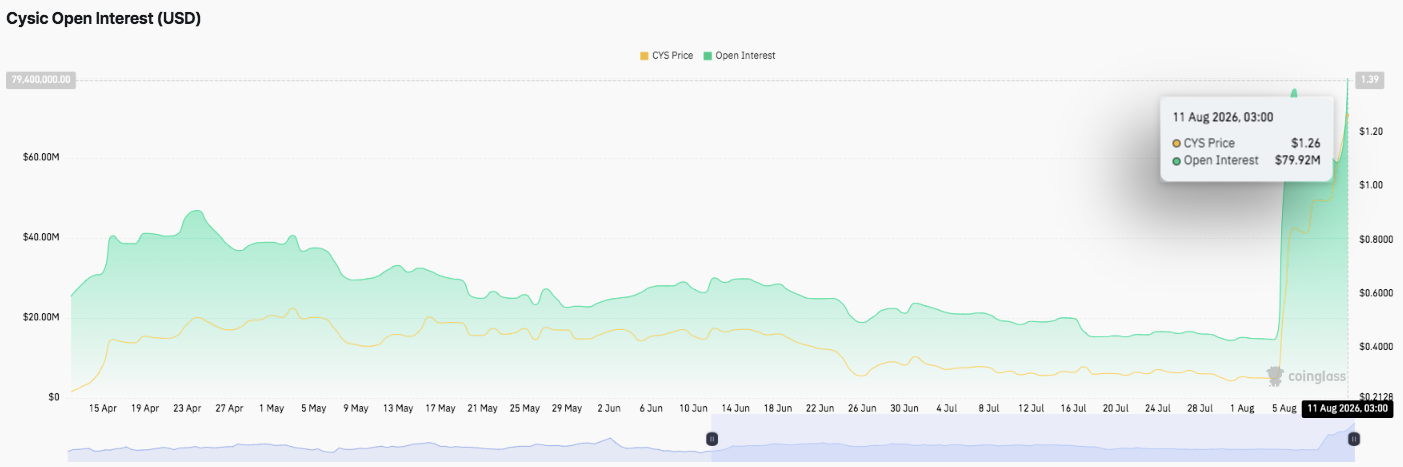
This expansion indicates significantly greater participation from derivatives. However, rising open interest can amplify both profits and losses.
The $80 million area now represents an important OI threshold. Meanwhile, the previous range of $15 to $20 million could become a long-term OI support zone.
A sustained reading above $60 million indicates stronger trader confidence. Nevertheless, excessive leverage can increase liquidation risks in the event of any sharp reversal.
| Indicator | Current Signal | What This Could Mean |
| Price | Strong Bullish Sentiment | Buyers maintain control |
| Open Interest | Around $80 million | Leverage has expanded sharply |
| OI vs. Price | Both Rising | Trend confirmation, but risk is higher |
| Key OI Support | $15-20 million | Major zone for unwinding participation |
Inflows Show Fresh Buying Pressure
$CYS spot flows remained largely balanced for most of the examined period. Netflow often moved around the zero line.
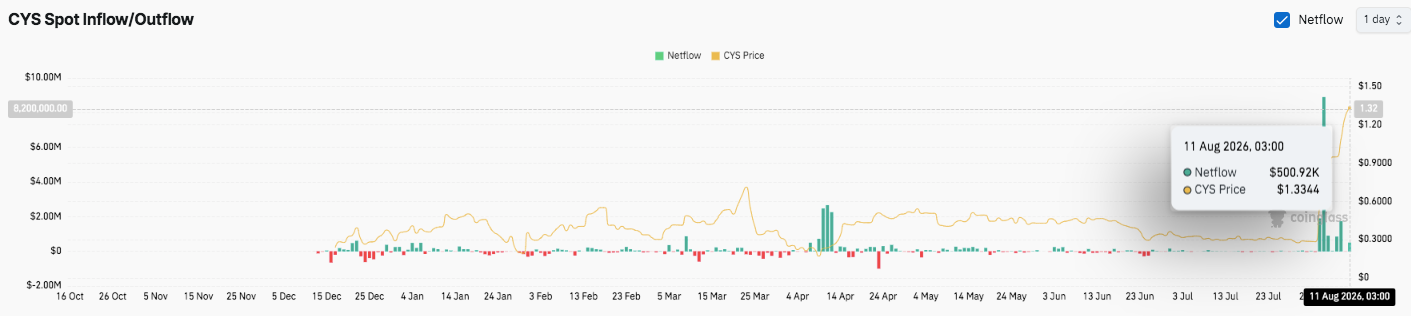
A few negative spikes indicated temporary selling pressure. However, these outflows failed to establish a sustained distribution trend.
Notably, net flow surged to approximately $8.2 million on August 11. The latest reading showed approximately $500,920 in net inflows.
This shift suggests buyers continue to absorb available supply near recent highs. However, traders should monitor whether inflows strengthen alongside further price gains.
| Indicator | Current Signal | What This Could Mean |
| Latest Netflow | +$500.92K | Buying remains positive |
| Major Inflow Spike | +$8.2M | Strong demand emerged |
| Flow Equilibrium | $0 | Key supply/demand dividing line |
Technical Forecast for Cysic Price
Key levels remain clearly defined after $CYS's explosive rally:
Upside Levels: $1.3734 and $1.40 represent the nearest hurdles. A decisive break above $1.3734 could extend gains to new highs.
Downside Levels: $1.2680 provides the first major support, followed by $1.0665, $0.9333, and $0.7974.
Resistance Ceiling: $1.3734 remains the critical level to flip for continued bullish momentum. Sustained movement above this zone could strengthen medium-term prospects.
The technical picture shows that $CYS is trading significantly above its key EMAs following a sharp rally. However, the steep rise has increased the risk of short-term profit-taking.
Will Cysic Rise Further?
Cysic's short-term direction depends on whether buyers can defend $1.2680 and challenge $1.3734. Rising open interest and positive spot inflows support a bullish outcome. However, traders should monitor divergence between price, OI, and inflows.
If $CYS breaks through $1.3734 with strengthening buying activity, the psychological $1.40 level becomes the next target. In turn, a rejection could lead to a pullback towards $1.2680.
end-content