Critical Game Week: BTC Retracement Confirmation vs. HYPE Support Battle | Guest Analysis

marsbit2026-06-22 tarihinde yayınlandı2026-06-22 tarihinde güncellendi

Özet

This weekly analysis outlines a critical juncture for BTC and HYPE markets, focusing on key price level confirmations. **BTC Analysis:** BTC is at a pivotal point after a five-wave rally from the June 5th low of $59,100. The price has broken below a short-term rising channel's lower boundary, with the current move seen as a pullback to test this breakdown. Failure to reclaim this level could lead to a retest of the $59,000-$60,000 support zone. The core scenario hinges on this channel retest outcome. * **Key Levels:** Resistance at $64,500-$65,000 (channel boundary) and $69,500-$70,500. Support at $59,000-$60,000 and $55,000. * **Strategy:** A core bearish stance is maintained (20% short from last week), with short-term plans for tactical trades. Three detailed contingency plans (A/B/C) are provided for short positions on resistance tests or breakdowns, emphasizing strict stop-loss discipline. **HYPE Analysis:** HYPE shows strong momentum but is currently in a corrective phase after hitting a new high of $76.94. The price is retesting the crucial $64-$66 support area. * **Key Levels:** Resistance near $77 and $80-$82. Support at $64-$66 and $52-$54. * **Strategy:** The short-term approach is "buy on dips, avoid chasing rallies." A long position is considered only if clear stabilization signals appear at the $64-$66 or deeper $52-$54 support zones, with tight risk controls. **General Risk Management:** A standardized trailing stop-loss protocol is emphasized: set in...

This week, the market enters a critical phase of contention.

At the macro level, marginal changes in Federal Reserve policy expectations continue to dictate the pricing rhythm of risk assets. In the crypto market, after the previous period of consolidation, the divergence between bulls and bears is intensifying around key price levels.

This weekly review maintains the consistent framework: based on multi-timeframe structural analysis and combined with quantitative model signals, it assesses the market outlook for BTC and HYPE this week and formulates specific short- to medium-term trading plans.

It is crucial to note that all content herein represents personal technical analysis records, serving solely as a reference framework and review basis for my own trading decisions, and does not constitute any form of investment advice. The market is always more complex than predictions. Strict adherence to risk control and stop-loss discipline remains the top priority.

Summary of Core Trading Views for This Week:

  • BTC Hourly Timeframe Structure Analysis (Detailed in Part 1)
  • BTC Weekly Outlook & Medium/Short-Term Trading Strategies (Detailed in Part 2)
  • HYPE Hourly Timeframe Structure Analysis (Detailed in Part 3)
  • HYPE Weekly Outlook & Short-Term Trading Strategy (Detailed in Part 4)

Market Verification of Last Week's Trading Strategies & Core Views:

  • BTC Market Outlook Verification: Last week, strictly following trading discipline, we promptly established an approximately 20% short position when market entry opportunities emerged. The medium-term trading plan outlined in the weekly review article was executed.

I. In-depth Analysis of Bitcoin's Hourly Timeframe Structure

Bitcoin _4-Hour K-line Chart
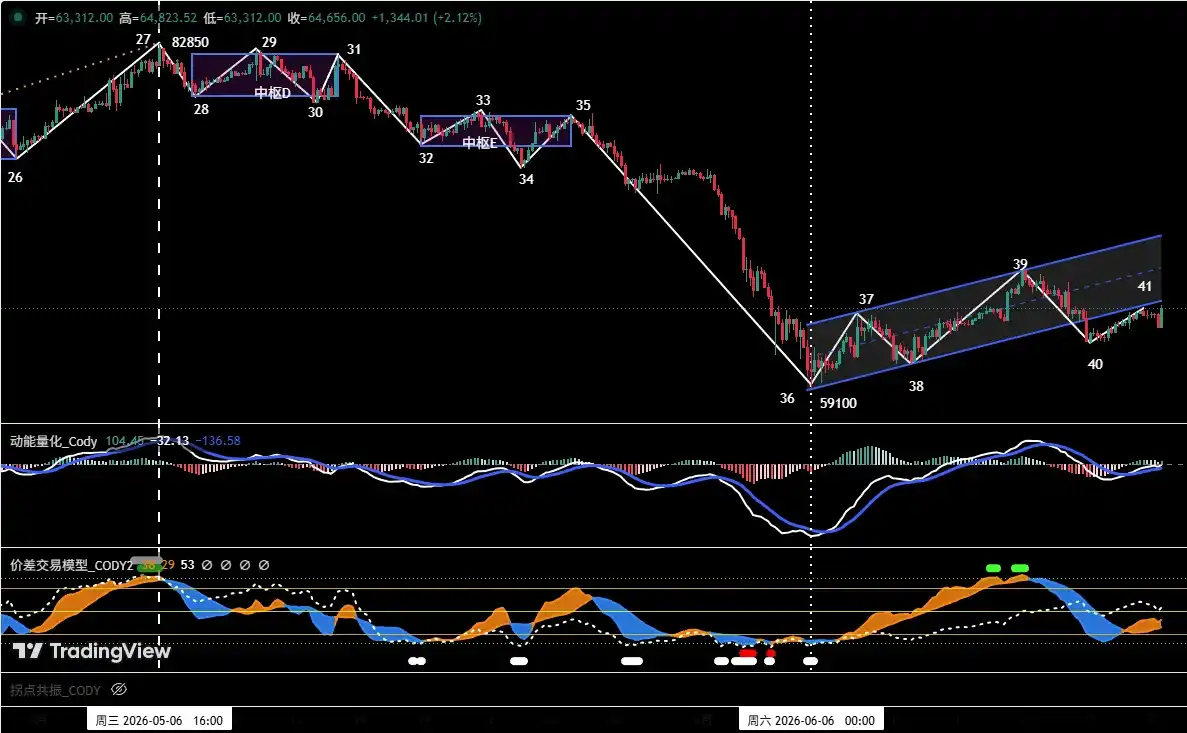
Figure 1

1 As shown in (Figure 1): From a 4-hour structural perspective, the price rebound initiated from the June 5th low of $59,100 can be subdivided into a five-wave structure, corresponding sequentially to segments 36-37, 37-38, 38-39, 39-40, and 40-41.

2 The overall trend presents a short-term rising channel pattern (blue channel in the chart): its upper bound is formed by connecting the two rebound highs at (point 37) and (point 39), while the lower bound is established by connecting the two correction lows at (point 36) and (point 38). The chart shows that the price has already breached the channel's lower bound at (point 40). The current (40-41) rebound segment can be viewed as a retracement confirmation phase for the breakdown below the channel's lower bound. If (point 41) fails to decisively reclaim a position above the channel's lower bound, the probability of the price revisiting the previous low support around $59,100 will significantly increase.

II. Bitcoin Weekly Outlook and Trading Strategies

1. BTC Weekly Market Outlook:

Core View for the Week: Focus on the outcome of the price's retracement confirmation of the short-term channel's lower bound.

  • If it holds firmly above, the price may continue its rebound along the short-term rising channel, potentially challenging the core resistance zone of $69,500~$70,500.
  • If it fails to hold, the market may retest the core support zone of $59,000~$60,000.

2. Core Resistance Levels:

  • First Resistance Zone: $64,500~$65,000 area (near the short-term rising channel's lower bound)
  • Second Resistance Zone: $69,500~$70,500 area (previous high-volume congestion zone)

3. Core Support Levels:

  • First Support Level: $59,000~$60,000 area (previous significant support level)
  • Second Support Level: Around $55,000 (previous significant support level)

4. Trading Strategies for This Week (Excluding Unexpected News Impact)

1 Medium-Term Strategy:

Bitcoin _ Daily K-line Chart (Position Monitoring Model)
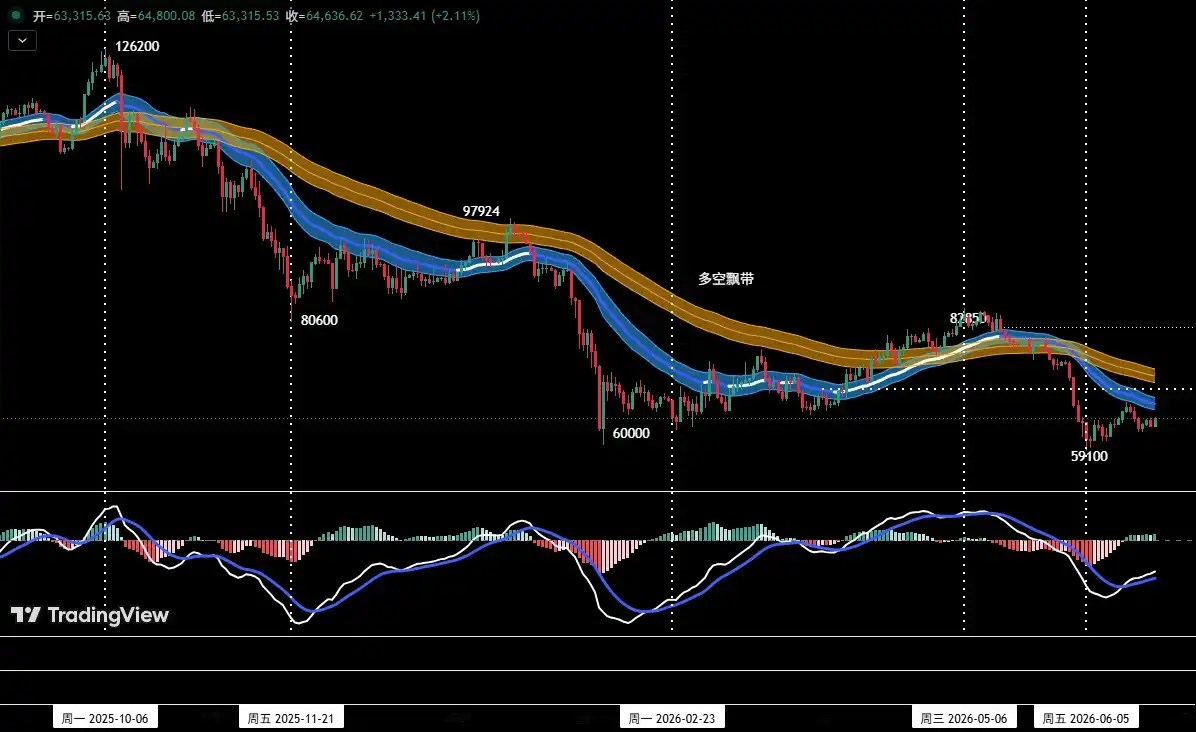
Figure 2

Position Monitoring Model: As shown in (Figure 2), the current price has decisively broken below the "Bull-Bear Channel," confirming a shift in market structure to a bear-dominated regime. Following the pre-set plan last week, we entered a short position around $64,500, with the initial medium-term position controlled at approximately 20% of total capital. Subsequent actions will adhere to stop-loss discipline, awaiting the next opportunity to add to the position.

2 Short-Term Strategy: Utilize 30% of capital, set stop-loss points, and seek "spread" trading opportunities based on support and resistance levels (using 30-minute/60-minute cycles).

3 To dynamically respond to the market's complex evolution in short-term operations, we have pre-formulated three specific contingency plans: A, B, and C.

Plan A: Tentative Positioning in Resistance Zone

  • Entry: If the price rallies to the $64,500~$65,000 zone showing signs of exhaustion, combined with a quantitative model top signal, an initial short position of around 15% can be established.
  • Risk Control: Set an initial stop-loss.
  • Exit: When the correction approaches significant support levels and aligns with model signals, gradually close positions to take profits.

Plan B: Adding to Position in Strong Resistance Zone

  • Addition: If the price breaks above the $65,000 resistance and continues to rally to the $69,500~$70,500 zone showing pressure signs, combined with a quantitative model top signal, increase the short position to within 30%.
  • Risk Control: Set an initial stop-loss.
  • Exit: When the correction approaches significant support levels and aligns with model signals, gradually close positions to take profits.

Plan C: Following the Break Below Support to Add Shorts

  • Addition: If the price decisively breaks below the $65,000 support, continues its decline, and loses the $59,000~$60,000 support zone, consider adding to the short position (within 30%) when price shows weakness during a retracement confirmation.
  • Risk Control: Set an initial stop-loss.
  • Exit: When the decline reaches significant support levels and aligns with model signals, gradually close positions to take profits.

III. HYPE Hourly Timeframe Structure Analysis

HYPE_4-Hour K-line Chart
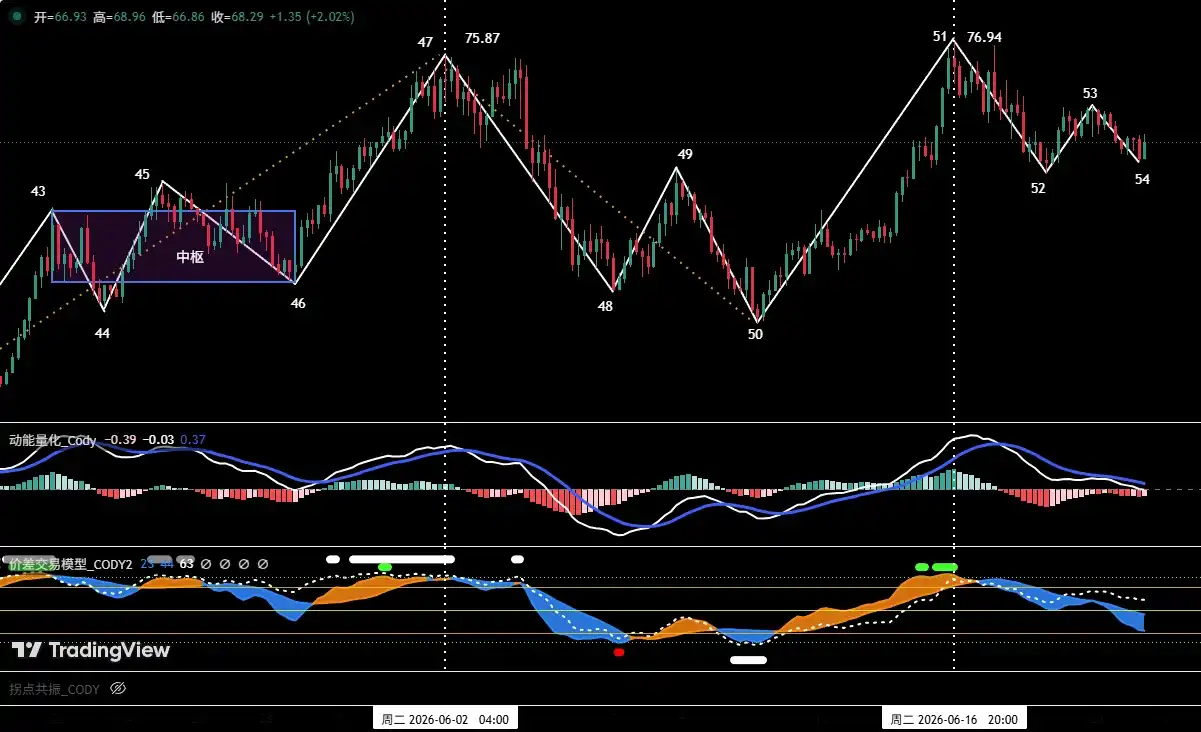
Figure 3

1 As shown in (Figure 3), on the 4-hour timeframe, HYPE initiated a correction from the June 2nd high of $75.87 (point 47), finding support near $52.62 (point 50) on June 10th, a correction lasting about 9 trading days. Subsequently, the market began a strong upward wave (segment 50-51), breaking the previous high within 6 trading days to reach a new high of $76.94 since the January rally, indicating that bullish momentum remains strong.

2 The decline from the new high presents a clear three-wave corrective structure (51-52, 52-53, 53-54). The price has currently retraced back to the critical support zone of $64~$66.

  • Bullish Scenario: If the price finds effective support in this zone, the uptrend from (point 50) is likely to continue, with subsequent prices challenging new highs.
  • Bearish Scenario: If this level is lost, the correction period will extend, and the price may retest the core support band of $52~$54, which marks the starting point of the previous uptrend.

IV. HYPE Weekly Outlook and Short-Term Trading Strategy

1. HYPE Weekly Market Outlook:

1 Core Resistance Levels:

  • First Resistance Level: Around $77
  • Second Resistance Zone: $80~$82 area

2 Core Support Levels:

  • First Support Level: $64~$66 area
  • Second Support Level: $52~$54 area

Core View for HYPE This Week:

  • Observe the outcome of the battle between bulls and bears over the $64~$66 zone.

2. HYPE Short-Term Trading Strategy for This Week (Long on Support)

This week's short-term HYPE trading should adhere to the strategy of "buying the dip, avoiding chasing rallies."

Short-Term Strategy: Testing Longs on Support Zone Stabilization

When the HYPE price retests and finds support, showing signs of stabilization in the $64~$66 key support zone or the deeper $52~$54 zone, and this aligns with bottom signals triggered by the two models, consider a light long position trial. Position size must be controlled below 30%, and strict stop-loss discipline must be maintained.

V. Special Notes:

  1. Upon Entry: Immediately set the initial stop-loss.
  2. Upon Reaching 1% Profit: Move the stop-loss to the entry price (break-even point), ensuring capital safety.
  3. Upon Reaching 2% Profit: Move the stop-loss to the position of 1% profit.
  4. Continuous Tracking: Thereafter, for every additional 1% profit gained, move the stop-loss up by 1%, dynamically protecting and locking in profits.

Financial markets change rapidly. All market analysis and trading strategies require dynamic adjustment. All views, analytical models, and operational strategies mentioned in this article are derived from personal technical analysis, intended solely for personal trading log purposes, and do not constitute any investment advice or operational basis. Markets involve risk, investment requires caution. Please do not make decisions based solely on this content.


Trend Kriptolar

İlgili Sorular

QWhat is the key technical situation for Bitcoin according to the analysis?

AThe key technical situation for Bitcoin is its current position in a short-term rising channel on the 4-hour chart. The price has already broken below the channel's lower rail at point 40. The current move (40-41) is seen as a retest to confirm this break. If point 41 fails to hold above the lower rail, the probability of a retest of the previous low at $59,100 increases significantly.

QWhat are the two main scenarios for HYPE this week based on its price action?

AFor HYPE, there are two main scenarios based on its price action around the key support zone of $64-$66. In the bullish scenario, if the price finds effective support in this zone, the uptrend from point 50 is expected to continue, potentially challenging new highs. In the bearish scenario, if this support is decisively broken, the correction will likely extend, and the price may test the more critical support band of $52-$54.

QWhat is the core medium-term trading strategy for Bitcoin, and what action was already taken?

AThe core medium-term strategy for Bitcoin is bearish, as the price has broken below the 'Bull-Bear Channel' on the daily chart, confirming a market structure shift to bearish dominance. Following the plan, a short position of approximately 20% of total capital was established near $64,500 last week. The strategy involves holding this initial position while waiting for potential opportunities to add to it.

QAccording to the analysis, what is the primary short-term trading approach recommended for HYPE?

AThe primary short-term trading approach for HYPE is to 'buy on dips and avoid chasing rallies.' The specific strategy is to attempt long positions on support levels. When the price retests and shows signs of stabilization in the key support zones of $64-$66 or $52-$54, and this is confirmed by bottom signals from the analysis models, a light long position (under 30% of capital) can be considered, with strict adherence to stop-loss discipline.

QWhat are the three contingency plans (A, B, C) outlined for Bitcoin's short-term trading?

AThe three contingency plans for Bitcoin's short-term trading are: Plan A (Resistance Zone Test): Initiate a ~15% short position if the price shows signs of stalling in the $64,500-$65,000 resistance zone with a model top signal. Plan B (Strong Resistance Zone): Increase the short position to under 30% if the price rallies further and faces pressure in the $69,500-$70,500 zone with a model top signal. Plan C (Breakdown Follow-through): Add to the short position (to under 30%) if the price decisively breaks below $65,000 and then $59,000-$60,000 support, showing weakness on any retest.

İlgili Okumalar

Blood Loss of $55 Million Selling 3,588 BTC, Strategy Becomes a Literal Scumbag

On July 6th, Strategy (formerly MicroStrategy) disclosed in an SEC filing that it sold 3,588 Bitcoin (BTC) between June 29th and July 5th for approximately $216 million, at an average price of ~$60,200. This marked the company's largest net sale since initiating its Bitcoin strategy in 2020 and its first institutionalized reduction of its core holding. The sale resulted in a realized loss of about $54.8 million, as the selling price was below its average cost basis of ~$75,476 per BTC. The proceeds were used to pay preferred stock dividends and replenish USD reserves. This move follows a new "Digital Credit Capital Framework" approved on June 29th, authorizing the sale of up to $1.25 billion in Bitcoin. The sale consumes roughly 17% of this authorized amount in its first week. Strategy's foundational narrative, built by founder Michael Saylor, was a commitment to "never sell" Bitcoin. The recent institutionalized selling framework and these substantial sales represent a significant shift from that original promise. While the amount sold is only 0.4% of Strategy's total holdings of 843,775 BTC, the action challenges the premium at which its stock (MSTR) trades relative to its Bitcoin holdings. Investors had priced in the "never sell" narrative. The company now faces a contradiction: it sells Bitcoin at a loss to pay dividends on the preferred stock it issued to fund Bitcoin purchases. Saylor has framed selling as a tool for future strategic purchases, but each sale erodes the credibility of the original commitment, potentially threatening the premium valuation of MSTR shares.

Foresight News55 dk önce

Blood Loss of $55 Million Selling 3,588 BTC, Strategy Becomes a Literal Scumbag

Foresight News55 dk önce

JP Morgan Tokenized Fund Surges 250% in TVL in One Month, Institutional Funds Are Treating Ethereum as the Default Underlying Layer

JPMorgan's tokenized money market fund, JLTXX, has seen its on-chain total value locked (TVL) surge approximately 250% in a month, reaching nearly $700 million from an initial $200 million since its launch seven weeks ago. The fund, which invests in short-term U.S. Treasuries and repos, operates exclusively on the public Ethereum mainnet, signaling growing institutional acceptance of Ethereum as a foundational layer for compliant financial products. A key driver of this growth is its inclusion as reserve assets for stablecoins like USDG, meeting requirements under U.S. stablecoin legislation. Simultaneously, despite a significant price decline—ETH has fallen over 50% from its 2025 high—institutional accumulation continues. BitMine Immersion Technologies, led by Tom Lee, purchased an additional $73 million worth of ETH last week, bringing its holdings to roughly 4.8% of Ethereum's circulating supply. The article highlights a divergence: while the tokenization of real-world assets and stablecoin reserves is driving long-term institutional adoption of Ethereum's infrastructure, short-term price action remains pressured by market sentiment and ETF outflows. This suggests that institutional on-chain activity, though a positive fundamental development, may not serve as a reliable signal for near-term price bottoms.

marsbit59 dk önce

JP Morgan Tokenized Fund Surges 250% in TVL in One Month, Institutional Funds Are Treating Ethereum as the Default Underlying Layer

marsbit59 dk önce

Dialogue with Yihui Capital, SoundAI Technology, Ling Universe, and Zhongbo Jili: Opportunities and Challenges in the AI Smart Hardware Track

On June 28, 2026, an event titled "New Opportunities in AI Hardware: The Battle for Interactive Entry Points Begins" was held in Beijing. It featured a report from ITJuzi and discussions with experts from SoundAI, Ling Universe, One Reed Capital, and Zhongbo Juli on the opportunities and challenges in China's AI hardware sector. Key report findings highlight the sector's intense activity: 327 out of 431 startups founded post-2023 have secured funding, with 179 investments in H1 2026 alone. The landscape is dominated by embodied intelligent robots, while wearable tech like smart rings and AI glasses shows rapid growth. Geographically, Shenzhen leads, leveraging its superior hardware supply chain, followed by Beijing and Shanghai. The overarching trend is for companies to focus on micro-innovations within specific scenarios rather than reinventing foundational technology. Industry leaders shared several critical insights: 1. **Balancing Innovation & Market Readiness**: Entrepreneurs face the "hammer looking for a nail" dilemma. Success requires balancing technical capability with user acceptance, cost control, and incremental design improvements rather than chasing disruptive innovation. 2. **Competitive Landscape**: The future interactive entry point may not be a single super-device but a mix of universal terminals and specialized, scenario-specific hardware. While large companies have ecosystem advantages, startups can win by deeply targeting vertical markets and specific user groups. 3. **Core Challenges & Business Models**: Key hurdles include deep understanding of AI models and navigating non-transparent hardware supply chains. Viable business models may involve selling hardware at cost and generating revenue through software subscriptions, but this requires tight control over both hardware BOM and model inference costs. 4. **The Road to Commercialization**: The ultimate test is market validation—achieving sales growth and sustainable cash flow. Companies must find the right application scenario, use edge computing effectively, and close the loop from technology to commercial success. 5. **The Future of Interaction**: Proactive, context-aware interaction is the next frontier, though it's currently limited by issues like model hallucinations and environmental perception. The near-term focus should be on identifying target users and creating a coherent experience in specific domains, such as health wearables. In summary, to succeed in the competitive AI hardware arena, companies must strategically choose their niche, build a team with the right geographical advantages (e.g., leveraging Shenzhen's supply chain), and most importantly, execute a flawless commercialization strategy that translates technology into market-accepted products and sustainable business growth.

marsbit1 saat önce

Dialogue with Yihui Capital, SoundAI Technology, Ling Universe, and Zhongbo Jili: Opportunities and Challenges in the AI Smart Hardware Track

marsbit1 saat önce

İşlemler

Spot

Popüler Makaleler

HYPE Nasıl Satın Alınır

HTX.com’a hoş geldiniz! Hyperliquid (HYPE) satın alma işlemlerini basit ve kullanışlı bir hâle getirdik. Adım adım açıkladığımız rehberimizi takip ederek kripto yolculuğunuza başlayın. 1. Adım: HTX Hesabınızı OluşturunHTX'te ücretsiz bir hesap açmak için e-posta adresinizi veya telefon numaranızı kullanın. Sorunsuzca kaydolun ve tüm özelliklerin kilidini açın. Hesabımı Aç2. Adım: Kripto Satın Al Bölümüne Gidin ve Ödeme Yönteminizi SeçinKredi/Banka Kartı: Visa veya Mastercard'ınızı kullanarak anında Hyperliquid (HYPE) satın alın.Bakiye: Sorunsuz bir şekilde işlem yapmak için HTX hesap bakiyenizdeki fonları kullanın.Üçüncü Taraflar: Kullanımı kolaylaştırmak için Google Pay ve Apple Pay gibi popüler ödeme yöntemlerini ekledik.P2P: HTX'teki diğer kullanıcılarla doğrudan işlem yapın.Borsa Dışı (OTC): Yatırımcılar için kişiye özel hizmetler ve rekabetçi döviz kurları sunuyoruz.3. Adım: Hyperliquid (HYPE) Varlıklarınızı SaklayınHyperliquid (HYPE) satın aldıktan sonra HTX hesabınızda saklayın. Alternatif olarak, blok zinciri transferi yoluyla başka bir yere gönderebilir veya diğer kripto para birimlerini takas etmek için kullanabilirsiniz.4. Adım: Hyperliquid (HYPE) Varlıklarınızla İşlem YapınHTX'in spot piyasasında Hyperliquid (HYPE) ile kolayca işlemler yapın.Hesabınıza erişin, işlem çiftinizi seçin, işlemlerinizi gerçekleştirin ve gerçek zamanlı olarak izleyin. Hem yeni başlayanlar hem de deneyimli yatırımcılar için kullanıcı dostu bir deneyim sunuyoruz.

322 Toplam GörüntülenmeYayınlanma 2024.12.11Güncellenme 2026.06.02

HYPE Nasıl Satın Alınır

Tartışmalar

HTX Topluluğuna hoş geldiniz. Burada, en son platform gelişmeleri hakkında bilgi sahibi olabilir ve profesyonel piyasa görüşlerine erişebilirsiniz. Kullanıcıların HYPE (HYPE) fiyatı hakkındaki görüşleri aşağıda sunulmaktadır.

活动图片