Chainlink demand surges as withdrawals reach 2 mln LINK: Will this boost price?

ambcrypto2026-03-25 tarihinde yayınlandı2026-03-25 tarihinde güncellendi

Özet

Chainlink (LINK) is experiencing a surge in investor demand, with over 2.046 million tokens withdrawn from exchange reserves in the past month, signaling potential accumulation and a bullish sentiment. Despite a modest monthly gain of 3.75%, LINK saw a 7.15% price increase in 24 hours, trading at $9.20, accompanied by a 65% surge in trading volume to $952.83 million. Analytics data indicates long-term holder interest, with exchange reserves dropping significantly. Derivatives data shows traders favoring long positions, with bulls dominating. Technically, LINK is moving within an ascending channel pattern. After a recent dip to the lower boundary, a bullish engulfing candle suggests a potential reversal. If LINK holds above $8.576, a 10% rise to $10.08 is possible, with further upside toward $11.20 if key resistance is broken. The RSI at 52.03 indicates growing buying interest and a shift toward bullish territory.

Demand for Chainlink [LINK] among investors is rising significantly, even though its price remains stagnant.

Crypto tracker CoinMarketCap showed that LINK gained a modest 3.75% over the past month, with the asset fluctuating within a range, reaching a high of $10 and a low of $8.17 during this period.

As the broader market exhibited signs of recovery, LINK jumped 7.15% over the past 24 hours, trading at the $9.20 level at press time.

Along with the price increase, market participation has also risen, as reflected in trading volume, which has surged by over 65% to $952.83 million.

This rise in trading volume not only indicates higher market activity but also suggests that investors and traders are showing strong interest in the current trend.

Analytics and derivatives data signal bullish sentiment

Analytics tool CryptoQuant shows that long-term investors are highly interested in LINK.

According to the latest data, over 2.046 million LINK tokens have been withdrawn from exchange reserves over the past month, as reflected in a significant decline from 129.427 million on the 24th of February to 127.381 million on the 24th of March 2026.

Whereas, in the past week, a massive drop of 951,000 LINK has been recorded in exchange reserves, indicating that LINK is in high demand among holders.
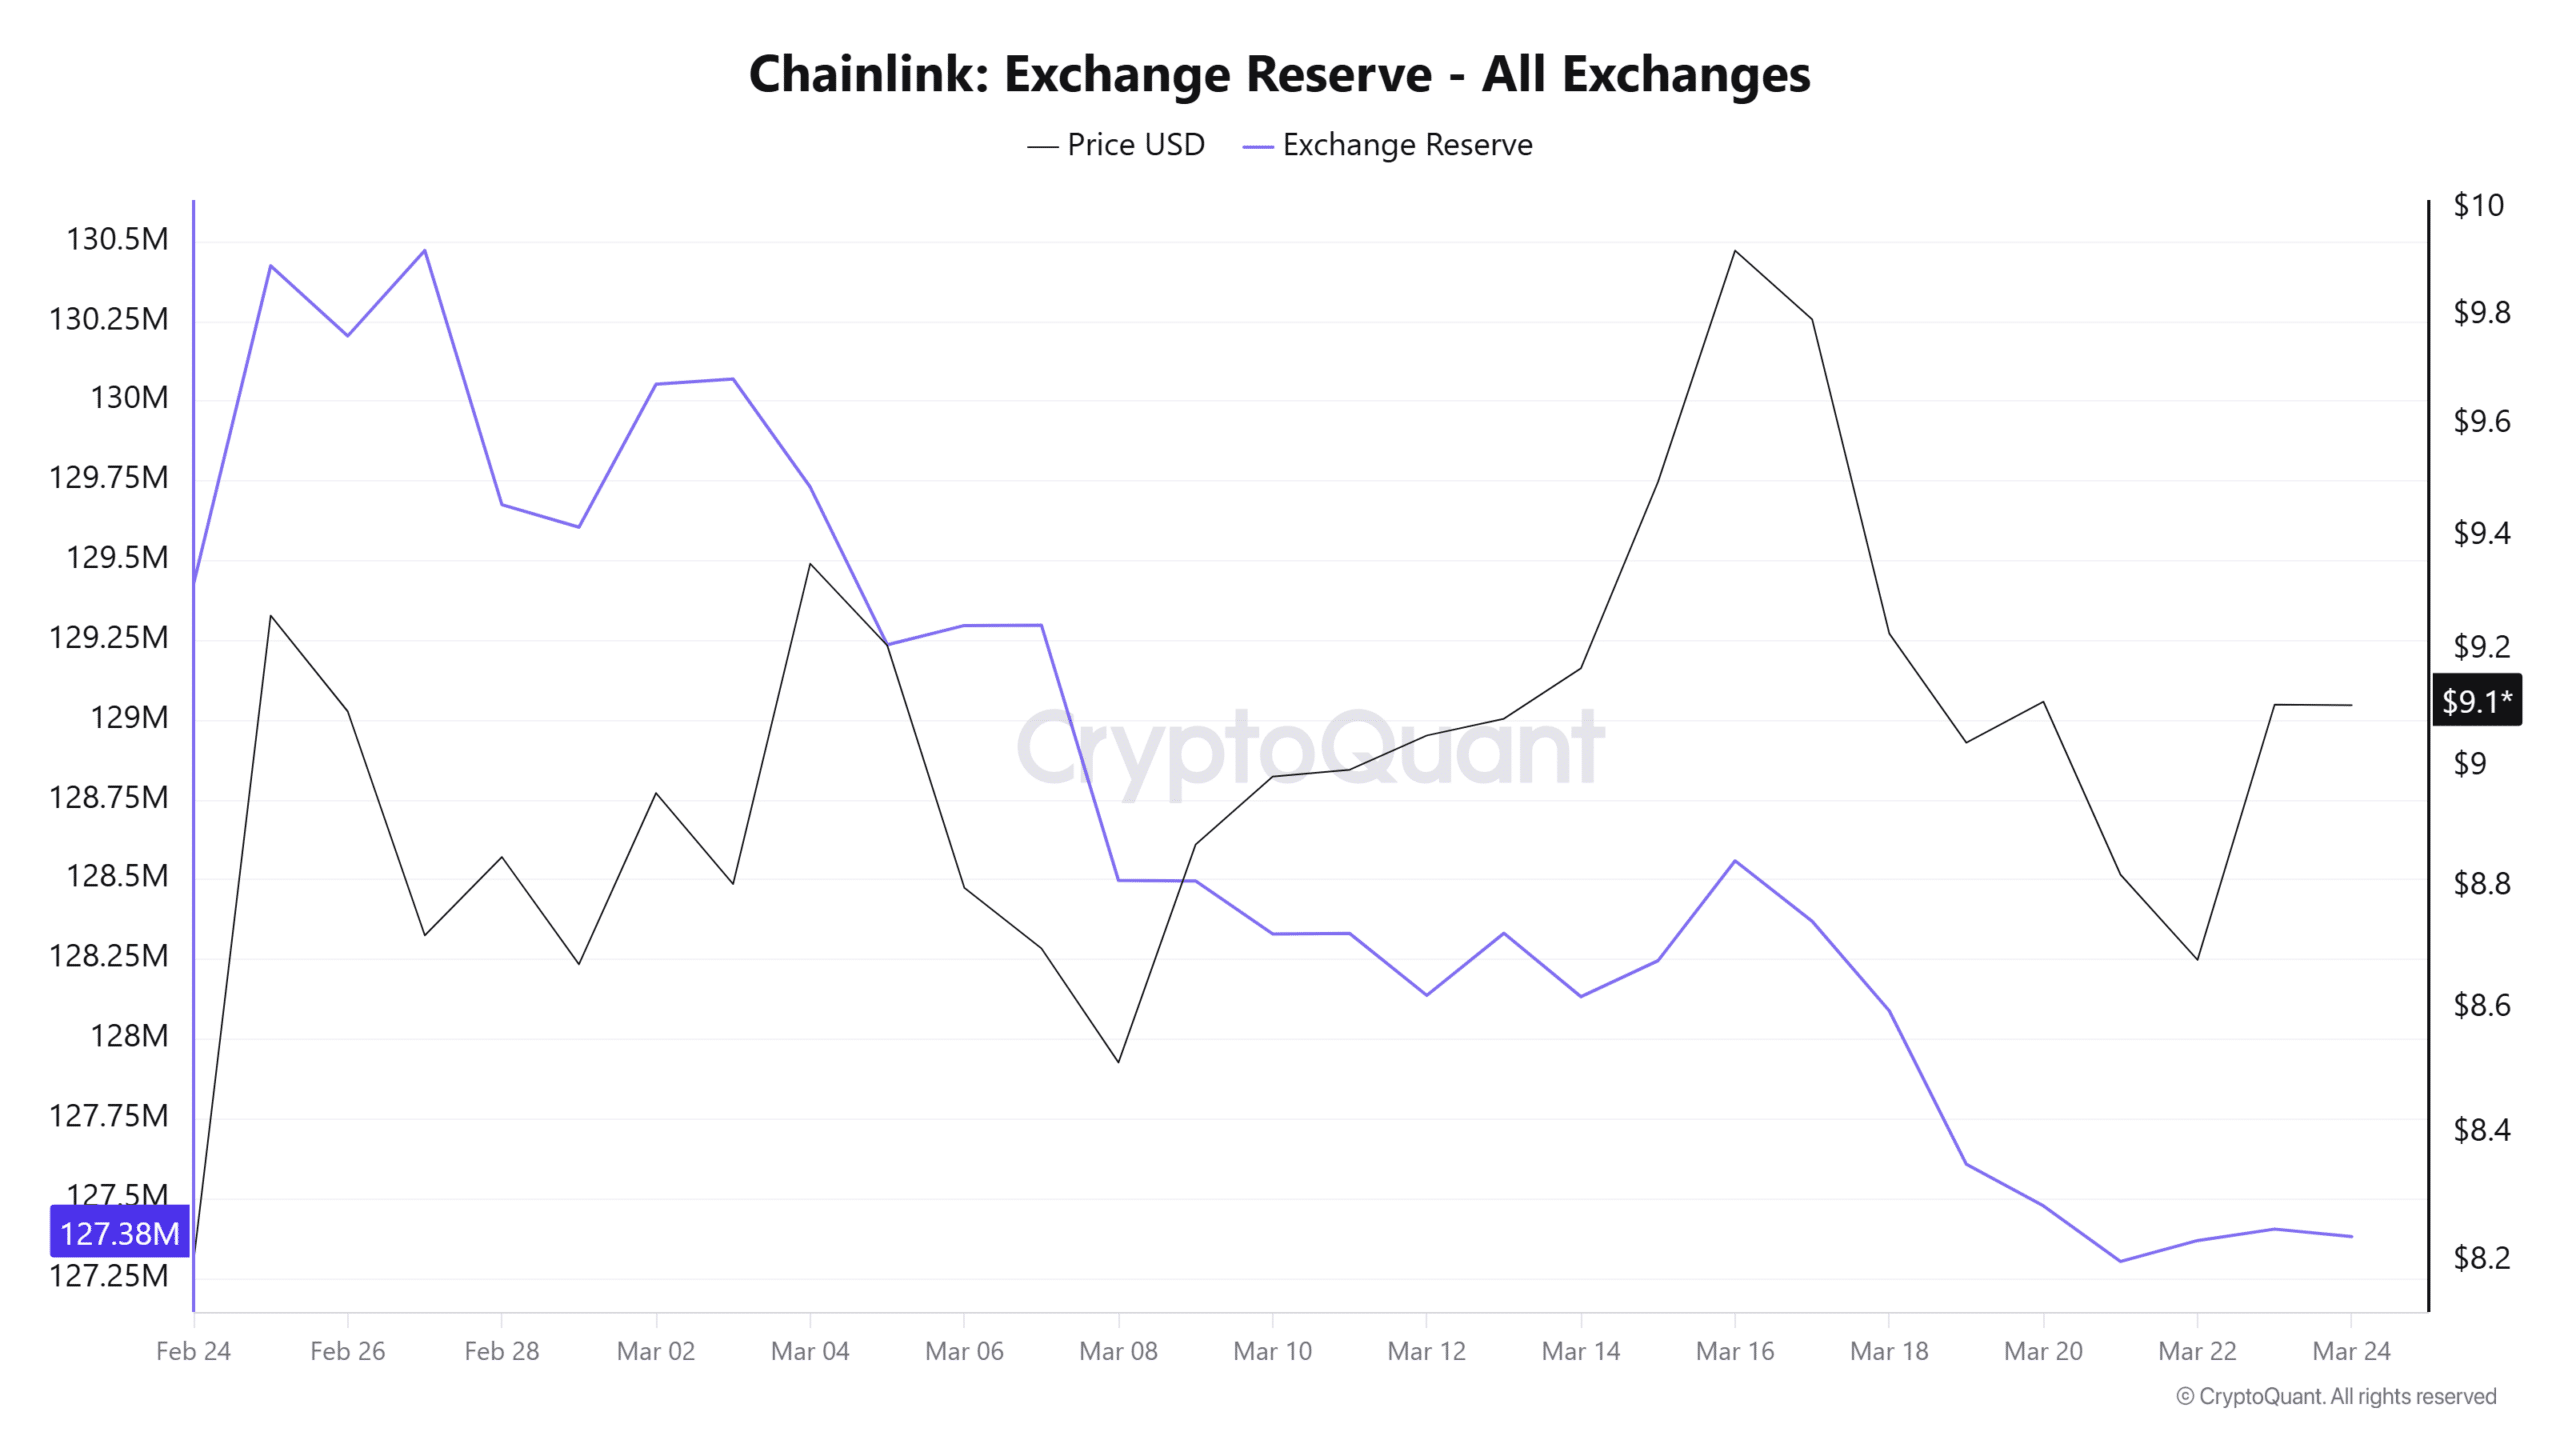
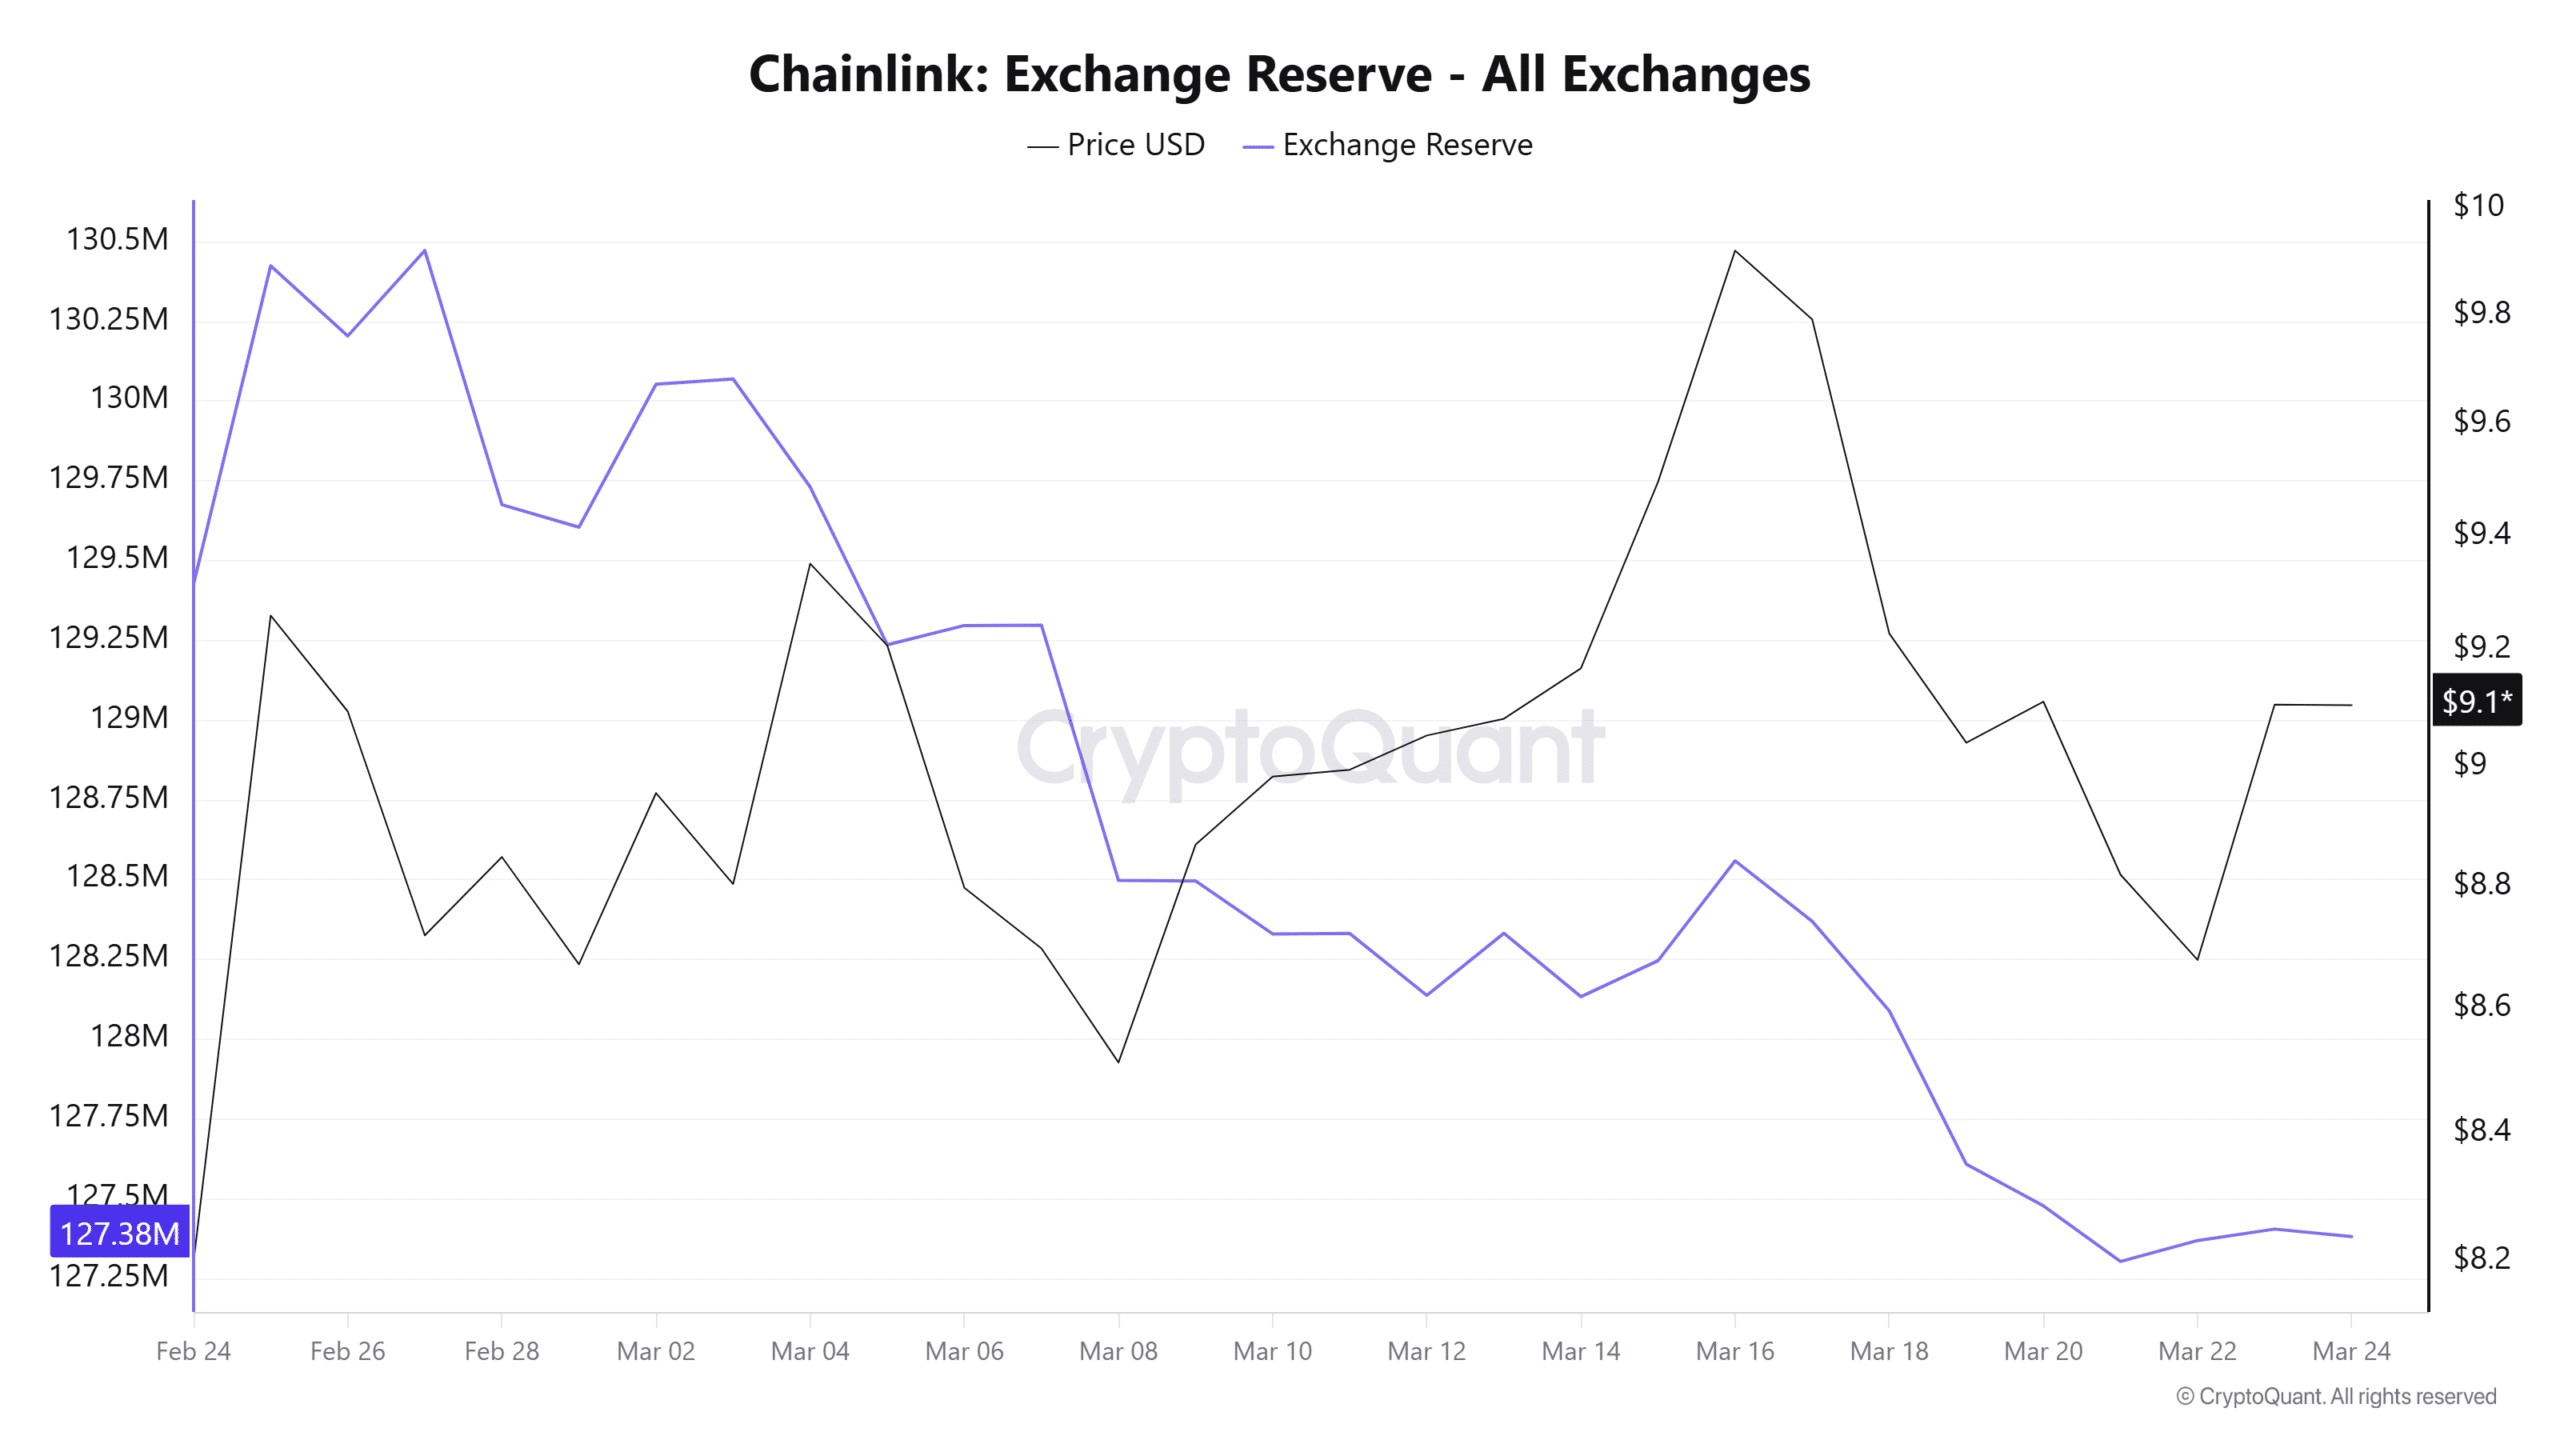
Source: CryptoQuant

Falling exchange reserves of any asset typically suggest potential accumulation, as holders tend to move assets from exchanges to their wallets, which is generally considered a bullish signal.

However, this potential accumulation over the past month and in recent weeks also raises questions about whether the current level is an ideal buying zone or not.

According to the derivatives analytics tool CoinGlass, intraday traders are currently following the trend, as they are eyeing long-leveraged positions. As per the data, $8.88 on the lower side and $9.27 on the upper side are the major liquidation levels from the current price.

Traders at these levels have built $4.08 million worth of long-leveraged positions and $2.10 million in short-leveraged positions, indicating that bulls are dominating the asset, while short sellers appear to be losing interest.
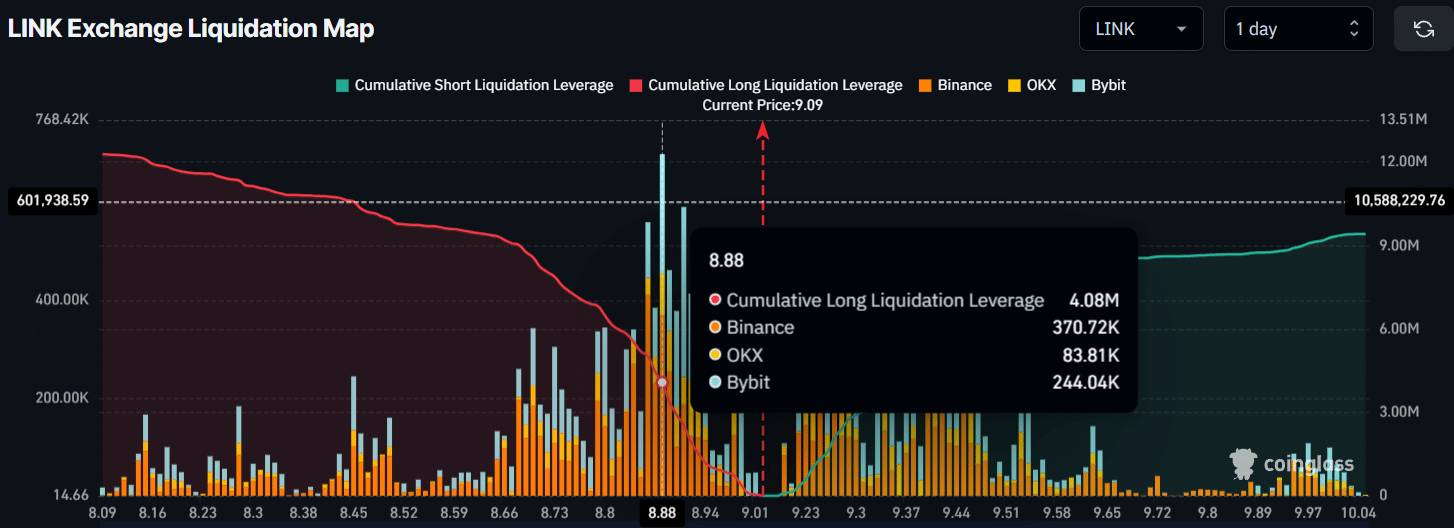
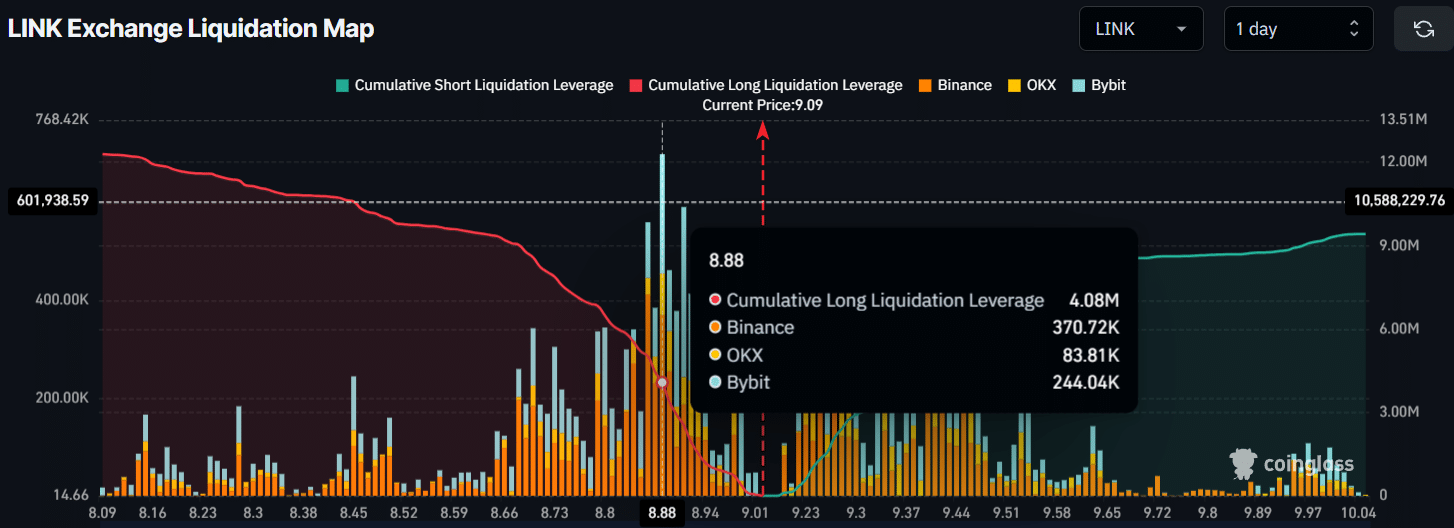
Source: CoinGlass

LINK: Price action eyes 10% jump

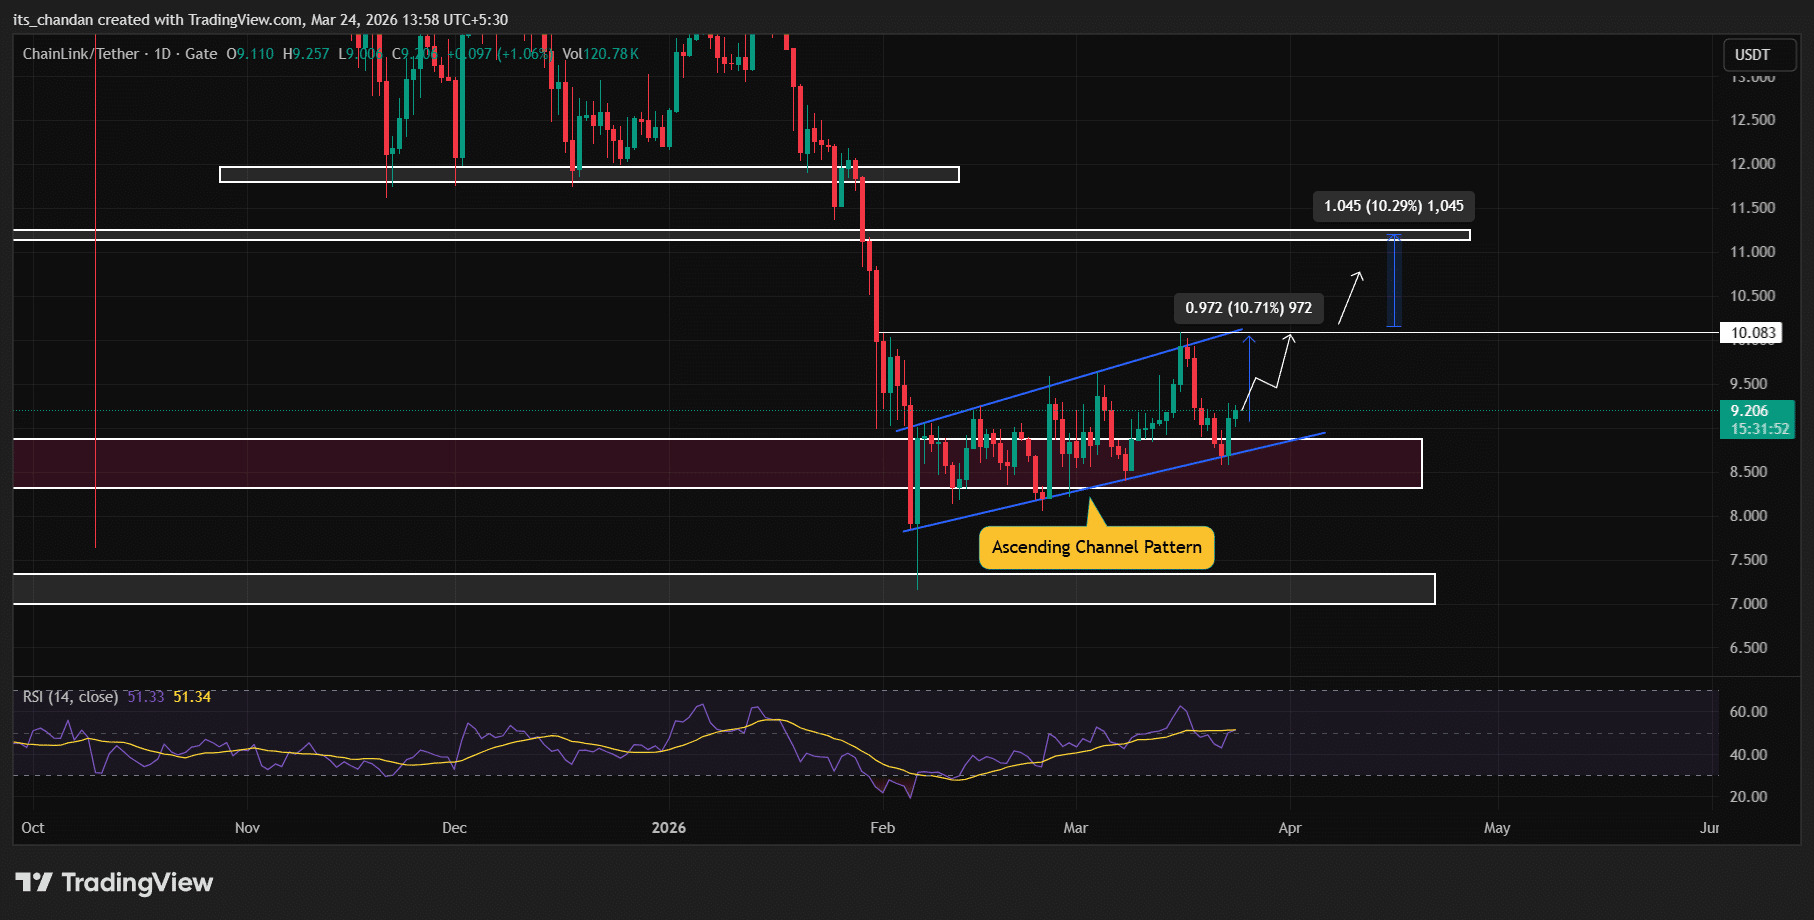
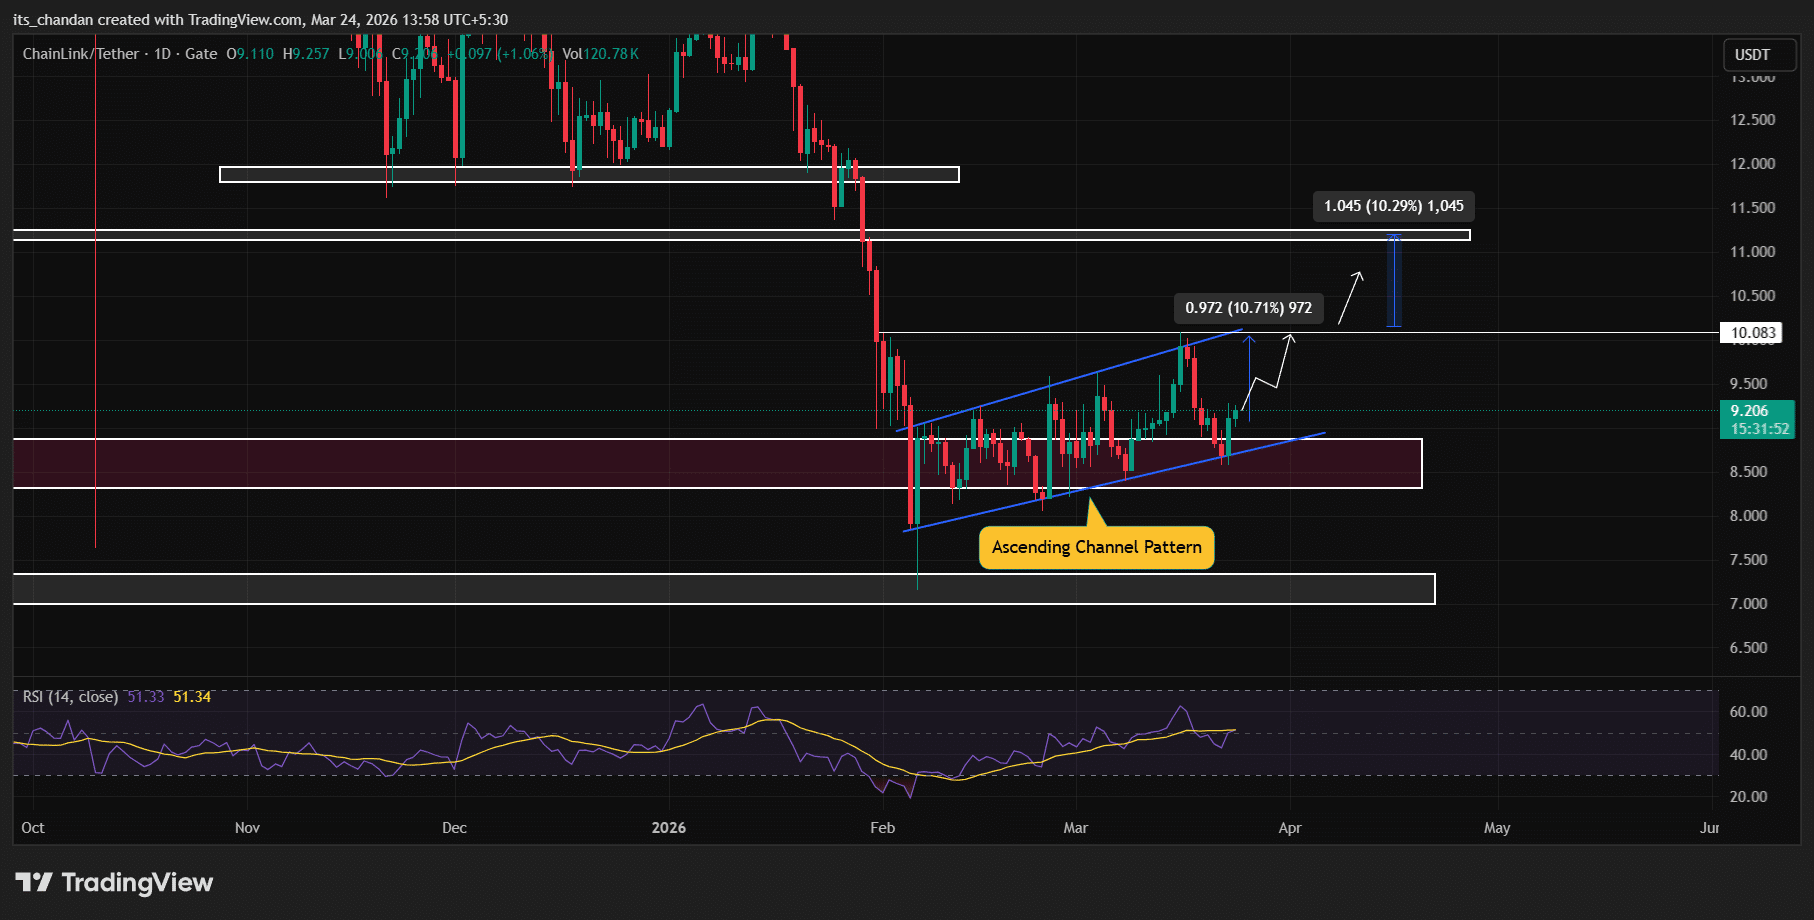
On the daily chart, LINK appeared to be moving within an ascending channel pattern between the upper and lower boundaries.

Following a recent dip of 14.65% between the 16th and the 23rd of March, the price declined to the lower boundary, where it formed a bullish engulfing candle, suggesting that LINK may be on the verge of a reversal in the coming days.
Source: TradingView

Based on the current price action, if LINK remains above the upper boundary and the $8.576 level (the low of the engulfing candle), it could see a price jump of 10% and potentially reach the $10.08 level.

Further upside is also possible; however, $10.08 has been a key resistance level since the 1st of February. If LINK clears this level, another 10% rally could occur, potentially pushing the price toward $11.20.

As of now, Chainlink appears to be recovering as the Relative Strength Index (RSI) on the daily chart reaches 52.03, indicating a shift toward bullish territory and growing buying interest, with the asset gaining strength above the neutral 50 level.


Final Summary

  • Exchange reserves have declined by 2.046 million tokens over the past 30 days, indicating strong demand.
  • The daily chart shows that LINK is moving in an ascending channel pattern. After testing the lower boundary, it may see another 10% price jump in the coming days.


Trend Kriptolar

İlgili Sorular

QWhat is the main reason for the surge in Chainlink (LINK) demand according to the article?

AThe main reason for the surge in Chainlink (LINK) demand is the significant withdrawal of tokens from exchange reserves, with over 2.046 million LINK tokens being removed over the past month, indicating strong accumulation by long-term investors.

QHow much did LINK's trading volume increase by, and what does this suggest?

ALINK's trading volume surged by over 65% to $952.83 million. This increase suggests higher market activity and indicates that investors and traders are showing strong interest in the current trend.

QWhat does the formation of a bullish engulfing candle on the daily chart indicate for LINK's price?

AThe formation of a bullish engulfing candle on the daily chart, after the price declined to the lower boundary of its ascending channel, suggests that LINK may be on the verge of a reversal and a potential price jump in the coming days.

QWhat are the key price levels that traders are watching for potential liquidation, according to CoinGlass data?

AAccording to CoinGlass data, the key liquidation levels from the current price are $8.88 on the lower side and $9.27 on the upper side.

QWhat is the potential price target for LINK if it breaks above the key resistance level of $10.08?

AIf LINK breaks above the key resistance level of $10.08, it could see another 10% rally, potentially pushing the price toward $11.20.

İlgili Okumalar

Stocks Fell Even More Violently Than Crypto, Where Did the Money Go?

From June to late July 2026, global stock markets, particularly technology and semiconductor stocks, experienced severe declines, with South Korea's KOSPI index facing historic circuit breakers and shedding 40% from its June peak. Key catalysts included SK Hynix's earnings miss despite record profits and competitive pressures from China's CXMT IPO. A global forced deleveraging event unfolded, devastating highly leveraged instruments like the 2x leveraged SK Hynix ETF, which lost over 80% of its value. Surprisingly, Bitcoin showed relative stability during this period, rising roughly 15% from its July low. The article clarifies this wasn't due to an inflow of equity flight capital but because Bitcoin had already undergone a significant correction in May and June, with U.S. spot Bitcoin ETFs seeing record outflows. True safe-haven flows went to gold, severing Bitcoin's short-term "digital gold" narrative. The sell-off is characterized not as an AI story collapse but a liquidity-driven清算 of crowded leveraged positions, potentially halfway through according to some analysts. For substantial capital to return to Bitcoin, the article cites necessary conditions: eased global liquidity pressure, a soft-landing Fed rate cut, and regulatory clarity from the stalled U.S. CLARITY Act. The conclusion is that Bitcoin is not a current safe haven but a pre-cleared asset. Its decoupling from tech stocks highlights its potential future role as a non-correlated asset for institutional portfolios, positioning it favorably for when global capital reallocates post-crisis.

marsbit1 saat önce

Stocks Fell Even More Violently Than Crypto, Where Did the Money Go?

marsbit1 saat önce

"The Final Phase Before the New Cycle". What Will Happen to Bitcoin in August

"Bitcoin Faces Crucial Test in August: Experts Predict Consolidation or Further Decline" The price of Bitcoin (BTC) is expected to remain under pressure in August, with experts anticipating either consolidation within a narrow range or a potential drop below $60,000. Despite a double-digit recovery from its July low near $58,000, BTC ended the month trading around $63,500, still roughly 50% below its October 2025 peak of $126,200. Analysts cite several headwinds: a challenging macroeconomic environment with high US interest rates and persistent inflation, which makes fixed-income assets more attractive than speculative ones like crypto. Furthermore, competition for capital is intense, with many investors favoring AI-related stocks. This is reflected in significant outflows from US spot Bitcoin ETFs, with a record $4.5 billion leaving in June and a net outflow of $5.4 billion for the first half of the year. Historically, August is a weak month for crypto, with a median return of -7.49% from 2013 to 2025. Experts also note regulatory uncertainty in the US, particularly the stalled CLARITY Act, as a dampening factor. Despite the bearish near-term outlook, several experts view the current phase as the "last phase before a new Bitcoin cycle" begins, potentially in Q4 2024. This makes it a favorable time for accumulating Bitcoin for the long term. Key price levels to watch are support at $60,000-$61,000, with a break below $58,000 potentially leading to $53,000-$55,000. A move above $67,000 could target $70,000-$75,000, though this is considered a lower probability scenario.

cryptonews.ru1 saat önce

"The Final Phase Before the New Cycle". What Will Happen to Bitcoin in August

cryptonews.ru1 saat önce

İşlemler

Spot

Popüler Makaleler

LINK Nasıl Satın Alınır

HTX.com’a hoş geldiniz! ChainLink (LINK) satın alma işlemlerini basit ve kullanışlı bir hâle getirdik. Adım adım açıkladığımız rehberimizi takip ederek kripto yolculuğunuza başlayın. 1. Adım: HTX Hesabınızı OluşturunHTX'te ücretsiz bir hesap açmak için e-posta adresinizi veya telefon numaranızı kullanın. Sorunsuzca kaydolun ve tüm özelliklerin kilidini açın. Hesabımı Aç2. Adım: Kripto Satın Al Bölümüne Gidin ve Ödeme Yönteminizi SeçinKredi/Banka Kartı: Visa veya Mastercard'ınızı kullanarak anında ChainLink (LINK) satın alın.Bakiye: Sorunsuz bir şekilde işlem yapmak için HTX hesap bakiyenizdeki fonları kullanın.Üçüncü Taraflar: Kullanımı kolaylaştırmak için Google Pay ve Apple Pay gibi popüler ödeme yöntemlerini ekledik.P2P: HTX'teki diğer kullanıcılarla doğrudan işlem yapın.Borsa Dışı (OTC): Yatırımcılar için kişiye özel hizmetler ve rekabetçi döviz kurları sunuyoruz.3. Adım: ChainLink (LINK) Varlıklarınızı SaklayınChainLink (LINK) satın aldıktan sonra HTX hesabınızda saklayın. Alternatif olarak, blok zinciri transferi yoluyla başka bir yere gönderebilir veya diğer kripto para birimlerini takas etmek için kullanabilirsiniz.4. Adım: ChainLink (LINK) Varlıklarınızla İşlem YapınHTX'in spot piyasasında ChainLink (LINK) ile kolayca işlemler yapın.Hesabınıza erişin, işlem çiftinizi seçin, işlemlerinizi gerçekleştirin ve gerçek zamanlı olarak izleyin. Hem yeni başlayanlar hem de deneyimli yatırımcılar için kullanıcı dostu bir deneyim sunuyoruz.

955 Toplam GörüntülenmeYayınlanma 2024.12.13Güncellenme 2026.06.02

LINK Nasıl Satın Alınır

Tartışmalar

HTX Topluluğuna hoş geldiniz. Burada, en son platform gelişmeleri hakkında bilgi sahibi olabilir ve profesyonel piyasa görüşlerine erişebilirsiniz. Kullanıcıların LINK (LINK) fiyatı hakkındaki görüşleri aşağıda sunulmaktadır.

活动图片