BTC Medium-Term Trend Weakens, Short-Term Volatility Fails to Mask Directional Risks | Guest Analysis

marsbit2025-12-22 tarihinde yayınlandı2025-12-22 tarihinde güncellendi

Özet

This analysis by Odaily's guest analyst Conaldo examines Bitcoin's (BTC) current market stance, highlighting a weakening medium-term trend and short-term consolidation with directional risks. The core view is that BTC is in a corrective phase after breaking its long-term bullish trend line (since late 2022) and is now constrained by both this and a descending trend line from the October 2025 high. Until a significant volume-backed breakout occurs above these key levels, any price rises should be considered rebounds within a bearish structure. Last week's prediction of a shift to a consolidation pattern was accurate, with price oscillating in the $87.5K–$89K zone. The analyst successfully executed four short-term trades based on a quant model, yielding a 2.14% return. Technical analysis using weekly and daily charts (incorporating momentum and sentiment quant models) indicates BTC remains in a bearish market on both timeframes, with weak buying momentum and neutral sentiment, suggesting continued consolidation and downside risk. For the upcoming week (Dec 22–28), the market is expected to see wide-range fluctuations. The key area to watch is $89.5K–$91K. A breakdown could lead to deeper correction, while holding could allow for a limited rebound. Specific short-term trading plans (A and B) are outlined for both scenarios, involving 30% short positions with precise entry, stop-loss, and take-profit levels. Key macro events this week include reduced holiday liquidity, potent...

Odaily Guest Market Analyst Conaldo, Master of Financial Statistics from Columbia University, USA, focused on quantitative trading of US stocks during university and gradually expanded to digital assets such as Bitcoin, building a systematic quantitative trading model and risk control system through practical experience; possesses keen data insight into market fluctuations and is committed to continuous development in the professional trading field, pursuing stable returns; will delve into BTC technical, macro, and capital changes weekly, review and demonstrate practical strategies, and preview major upcoming events for reference.
Core Summary:

• From a macro technical perspective (see Figure 3 below): In the Bitcoin daily chart, the upward trend line representing the long-term bull market (since the end of 2022) and the downward trend line defining the recent correction (since the October 2025 high) are about to converge. The market is currently in a period of repair and volatility after breaking the long-term trend. Bitcoin's price is under dual pressure. Unless the price breaks through this dual pressure with strong volume, all upward movements can only be considered rebounds within a bearish pattern. The effective breakthrough of these two key trend lines will serve as the ultimate basis for judging the market's medium-term direction.

• Core View Validation: The core judgment proposed last week that "the market will most likely transition into a volatile adjustment pattern" was highly consistent with the actual market movement. The bulls and bears repeatedly contested the $87,500~$89,000 area, and the mid-week adjustment low of $84,456 had a relative error rate of about 1.18% compared to the predicted support area upper limit of $83,500.

• Strategy Execution Results Validation: Last week's trading strictly followed the established strategy, successfully completing four operations, achieving a cumulative return of 2.14%.

The following will review the market prediction, strategy execution, and specific trading process in detail.

I. Bitcoin Market Review Last Week (12.15~12.21)

1. Last Week's Trend Prediction and Operation Strategy Review:

Last week's forward-looking analysis clearly stated: The market will most likely transition into a volatile adjustment pattern. Among them, the $87,500~$89,000 area was defined as the key observation area. The outcome of the battle between bulls and bears here would directly determine the market's short-term direction choice. Special attention was needed: if this area was effectively broken below, it would directly affect the subsequent intensity and depth of the coin price adjustment. Below is the strategy review and analysis.

1. Market Trend Prediction Review:

• Core Pressure Level: First pressure looking at the $92,500~$94,500 area; second pressure looking at the $96,500~$98,500 area.

• Core Support Level: First support looking at the $87,500~$89,000 area; second support looking at the $80,000~$83,500 area.

2. Operation Strategy Review:

• Medium-term Strategy: Maintain a medium-term position (short) of about 65%.

• Short-term Strategy: To cope with the market trend, we initially drafted two short-term operation plans, A/B. Based on the actual evolution of the market, we ultimately executed Plan B as the core strategy.

• Opening Position: If the coin price falls below the $87,500~$89,000 area and is confirmed, establish a 30% short position.

• Risk Control: Stop loss set above $89,000.

• Closing Position: When the coin price falls to the $80,000~$83,500 area and shows resistance, close all short positions to take profits.

2. Last week, four short-term operations were successfully completed according to the plan (Figure 1), achieving a cumulative return of 2.14%. Specific transaction details and review are as follows:

Bitcoin 30-minute K-line chart: (Momentum Quantitative Model + Spread Trading Model)
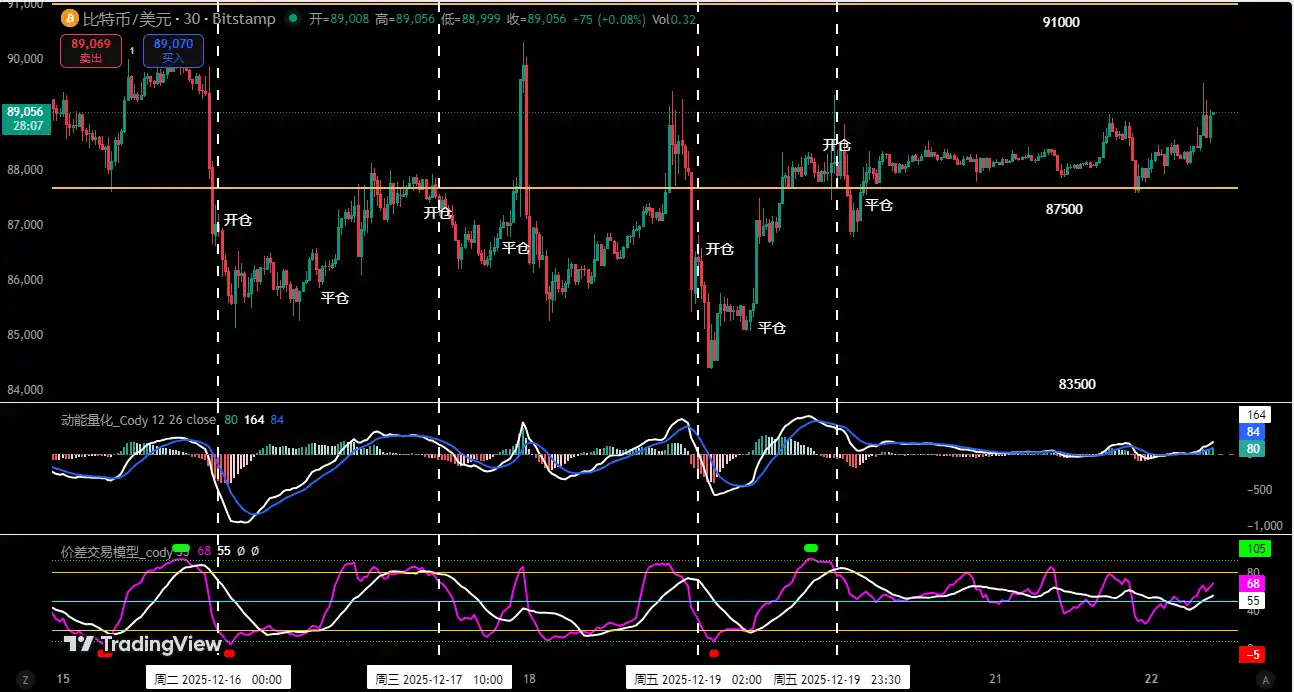
Figure 1

1. Transaction Details Summary:

2. Short-term Trading Review:

• First Transaction (Profit 0.73%): We strictly adhered to the idea of "effectively breaking through key points and going short with the trend." When the trigger condition was met, the spread trading model simultaneously issued a top signal. Based on this, we decisively established a 30% short position and finally took profits when the price fell near the previous low area.

• Second and Third Transactions (Cumulative Profit 1.41%): Based on the operation mode of "going short upon encountering resistance at the core pressure area during a rebound." When the coin price hit the $87,500~$89,000 area and encountered resistance, combined with resonance signals from both models, these two transactions were successfully completed.

• Fourth Transaction (Profit 0): The logic for opening the position was consistent with the previous two transactions. It must be emphasized that in this transaction, we strictly executed the principle of "immediately moving the stop loss to the opening cost price when the floating profit reaches 1%", resulting in the position being closed at breakeven.

II. Quantitative Technical Analysis: Based on Multi-Model and Multi-Dimensional Operations

Combining last week's market performance, the author will conduct an in-depth analysis of the evolution of Bitcoin's internal structure using multi-dimensional analysis models.

Bitcoin Weekly K-line Chart: (Momentum Quantitative Model + Sentiment Quantitative Model)
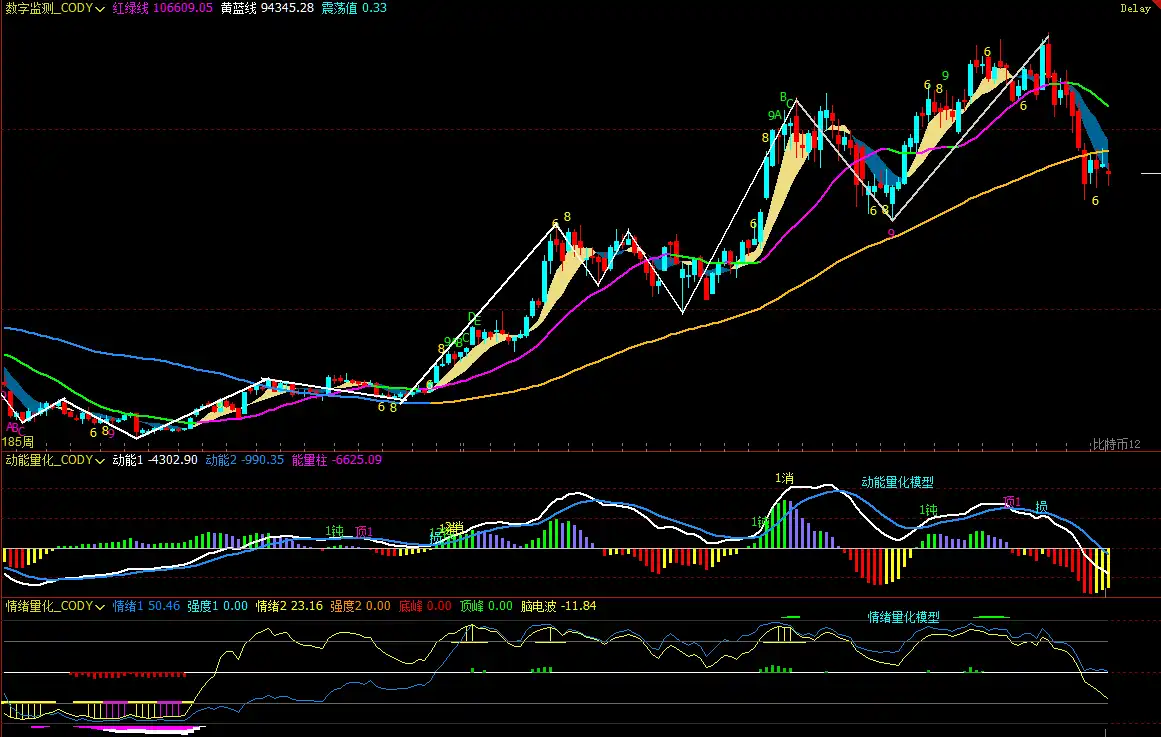
Figure 2

1. As shown in (Figure 2), analysis from the weekly chart:

Momentum Quantitative Model: After last week's adjustment, the two momentum indicator lines continue to operate below the zero axis. Although the rebound in the previous weeks prevented the negative momentum bars from expanding significantly, the current market structure remains weak, and we need to be vigilant about the risk of further release of adjustment pressure.

Momentum Quantitative Model Indicates: Coin price decline index: High

• Sentiment Quantitative Model: Blue sentiment line value 50.46, strength zero; yellow sentiment line value 23.16, strength zero, peak value is 0.

Sentiment Quantitative Model Indicates: Coin price pressure and support index: Neutral

• Digital Monitoring Model: The chart shows that the coin price has been below the bull-bear (yellow-blue line) dividing line for 5 weeks, increasing the probability of an effective break. Short-term bottom digital signals (above 9) have not yet appeared.

The above data indicates: Bitcoin is in a downward trend, entering a bear market on the weekly level, beware of adjustment risks.

Bitcoin Daily K-line Chart:
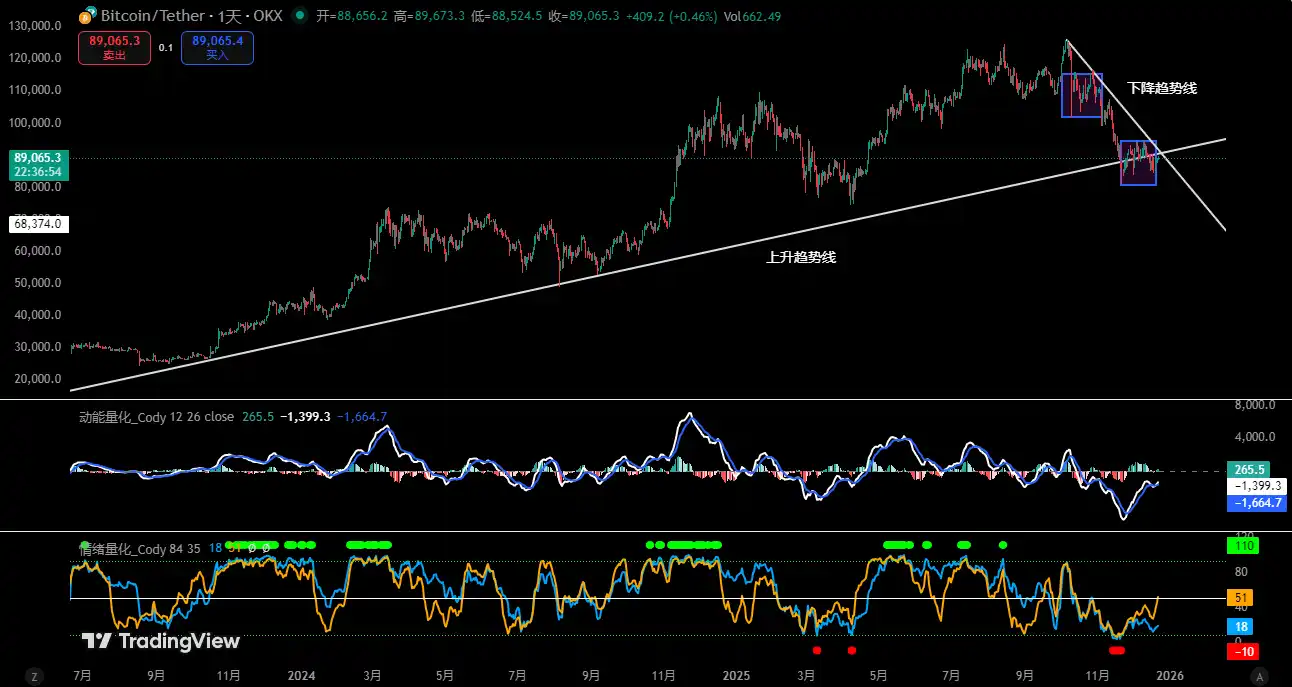
Figure 3

2. As shown in (Figure 3), analysis from the daily chart:

• Momentum Quantitative Model: In last week's行情, the two momentum lines experienced a repeated crossover process of "golden cross—dead cross—golden cross" below the zero axis. Trading volume did not放大, and the positive momentum bars did not grow significantly.

Momentum Quantitative Model Indicates: Fierce battle between bulls and bears for market control, weak buying momentum.

• Sentiment Quantitative Model: After last week's daily close, blue sentiment line value 17, strength zero; yellow sentiment line value 45, strength zero.

Sentiment Quantitative Model Indicates: Pressure and support index: Neutral

The above data suggests: The daily level is in a bear market, short-term market movements will still be反复.

III. This Week's Market Prediction (12.22~12.28)

1. The market is expected to mainly present a wide-range volatile pattern this week. The core observation interval is $89,500~$91,000. The outcome of the battle for this area will determine the short-term direction:

If effectively broken below: It will mean the adjustment intensity strengthens, and the expected adjustment range will expand, and the周期 will also延长.

If effectively held above: The market is expected to continue its volatile rebound, but the rebound space is expected to be relatively limited.

2. Core Pressure Levels:

• First Pressure Area: $89,500~$91,000 area

• Second Pressure Area: $93,000~$94,500 area

• Important Pressure Area: Around $97,000

3. Core Support Levels:

• First Support Level: $86,500~$87,500 area

• Second Support Level: $83,500~$84,500 area

• Important Support Level: Around $80,000.

IV. This Week's Operation Strategy (Excluding Sudden News Impact)(12.22~12.28)

1. Medium-term Strategy: Maintain a medium-term position (short) of about 65%.

2. Short-term Strategy: Use 30% of the position, set stop loss points, and look for "spread" opportunities based on support and pressure levels. (Using 30-minute as the operation cycle).

3. Focus on observing the battle between bulls and bears for the $89,500~$91,000 area and its outcome. To cope with the market行情, we have drafted two short-term operation plans, A/B:

Plan A: If this area is effectively held above:

• Opening Position: If the coin price rebounds to the $93,000~$94,500 area and encounters resistance, establish a 30% short position.

• Risk Control: Short stop loss set above $96,000.

• Closing Position: When the coin price falls to the $89,500~$91,000 area and shows resistance, close all short positions to take profits.

Plan B: If this area is effectively broken below:

• Opening Position: If the coin price falls below this area and is confirmed, establish a 30% short position.

• Risk Control: Stop loss set above $92,000.

• Closing Position: When the coin price falls to the $83,500~$84,500 area and shows resistance, consider partially or fully closing the position to take profits.

V. Special Notes

1. When opening a position: Immediately set the initial stop loss level.

2. When profit reaches 1%: Move the stop loss to the opening cost price (breakeven point) to ensure principal safety.

3. When profit reaches 2%: Move the stop loss to the position of 1% profit.

4. Continuous Tracking: Thereafter, for every additional 1% profit the coin price makes, move the stop loss同步 by 1%, dynamically protecting and locking in existing profits.

(Note: The above 1% profit trigger threshold can be flexibly adjusted by investors according to their own risk preferences and标的 volatility.)

VI. This Week's Macro Outlook and Key Events (12.22~12.28|Christmas Week)

1. Christmas Holiday Compresses Trading Hours, Liquidity Significantly Decreases

US stocks will close early on Wednesday and be closed all day Thursday this week. The holiday factor combined with year-end settlement results in overall lower market liquidity. Prices are more easily driven by sentiment and one-sided funds. Be wary of "false breakouts" and amplified short-term fluctuations under low trading volume.

2. Fed Chair Nomination Expectations Heat Up, Policy Continuity Becomes Market Focus

The market is watching whether Trump will announce the next Fed Chair nominee during the Christmas holiday. Currently, Kevin Hassett is seen as the明显领先 probability nominee, and his policy stance is considered偏向 "predictable gradual adjustment."

(If the nomination is announced, it will help stabilize interest rate expectations and risk appetite in the short term; if an unexpected candidate emerges, it may cause阶段性波动 in interest rates and the US dollar.)

3. US Q3 Data Finale, Verifying the "Soft Landing" Narrative

The revised US Q3 GDP, personal consumption expenditure, and core PCE data released on Tuesday will be used to confirm whether economic resilience and the inflation path are consistent with previous judgments.

(If the revisions are温和, the market will more easily maintain pricing for next year's interest rate cut path; if there are significant upward revisions, it may重新抬升 long-term rates.)

4. Employment Data as a Marginal Observation Indicator at Year-End

The initial jobless claims released on Wednesday, while not having trend significance, remain an auxiliary signal for observing whether the labor market is loosening around the holidays.

(Currently more偏向 "stable rather than deteriorating", the impact on the market is expected to be limited.)

5. BOJ Dynamics Provide Global Liquidity Reference

BOJ Governor Ueda's speech and the November unemployment rate data will continue to affect the market's judgment on the pace of Japan's monetary policy normalization.

(If yen volatility放大, it may cause emotional disturbance to global risk assets, especially US stocks and the crypto market.)

Financial markets are changing rapidly, all market analysis and trading strategies need to be adjusted dynamically. All views, analysis models, and operation strategies involved in this article are derived from personal technical analysis and are for personal trading log purposes only. They do not constitute any investment advice or operational basis. The market has risks, investment needs to be cautious, DYOR.


Trend Kriptolar

İlgili Sorular

QWhat is the core technical perspective on Bitcoin's medium-term trend according to the analyst's daily chart analysis?

AThe analyst states that from a macro technical perspective, Bitcoin is in a period of repair and consolidation after breaking its long-term uptrend. The price is under dual pressure from the long-term bull market trendline (since late 2022) and the recent downtrend line (since the October 2025 high). All upward moves are considered rebounds within a bearish structure until the price breaks through this dual resistance with strong volume, using the effective break of these key trendlines as the final basis for judging the market's medium-term directional choice.

QWhat was the outcome of the trading strategy execution for the previous week (Dec 15-21)?

AThe trading strategy was strictly followed, resulting in four successful short-term operations with a cumulative realized return of 2.14%.

QBased on the weekly chart analysis (Figure 2), what do the momentum and sentiment quantitative models indicate about Bitcoin's market structure?

AThe momentum quantitative model shows both momentum indicator lines continue to run below the zero axis, indicating the market structure is still weak with a high risk of further adjustment pressure release. The sentiment quantitative model shows neutral pressure and support indices, with the blue sentiment line at 50.46 and the yellow at 23.16, both with zero intensity. This data suggests Bitcoin is in a downward trend on the weekly level, having entered a bear market, warranting caution against adjustment risks.

QWhat are the two short-term operation plans (A and B) proposed for the current week (Dec 22-28) and what triggers each?

APlan A is triggered if the price effectively holds above the 89,500-91,000 USD region: open a 30% short position if the price rebounds to the 93,000-94,500 USD region and meets resistance, with a stop-loss above 96,000 USD, and close the position for profit when the price falls to the 89,500-91,000 USD region and finds support. Plan B is triggered if the 89,500-91,000 USD region is effectively broken: open a 30% short position upon confirmation of the break, with a stop-loss above 92,000 USD, and close all or part of the position for profit when the price falls to the 83,500-84,500 USD region and shows resistance.

QWhat are the key macro events and their potential impacts highlighted for the Christmas week (Dec 22-28)?

AKey events include: 1) Reduced trading hours and significantly lower liquidity due to the Christmas holiday, increasing the potential for 'false breakouts' and amplified short-term volatility. 2) Increased expectations for the Fed Chair nomination, where the appointment of Kevin Hassett could stabilize rate expectations, while an unexpected pick might cause volatility. 3) The release of final US Q3 GDP, PCE, and core PCE data to confirm the 'soft landing' narrative; significant upward revisions could push long-term rates higher. 4) Jobless claims data as a marginal indicator, expected to have limited impact. 5) BOJ dynamics providing global liquidity cues, where amplified Yen volatility could cause sentiment disturbances in risk assets like crypto.

İlgili Okumalar

human.tech Launches Clean SDK for Privacy-First Web3 Apps

human.tech has launched the Clean SDK, a toolkit enabling developers to build privacy-first Web3 applications with transparent accountability. Released alongside Aztec's version 5, the SDK provides components for integrating zero-knowledge identity verification, sanctions screening, and private transactions, without developers handling sensitive user data or building compliance infrastructure from scratch. It uses zero-knowledge proofs and programmable verification to allow apps to confirm user legitimacy and sanctions compliance while keeping identities confidential. The first application built on the SDK, Shield, a privacy bridge to Aztec, also launched. It allows users to transfer assets privately while proving a unique human is behind each transfer and that funds have passed sanctions checks, as verified by a May 2026 audit. The SDK offers three core verification techniques: Proof of Innocence (sanctions screening against 23 sources), Proof of Personhood (simpler verification via Human Passport), and Proof of Clean Hands (higher-assurance zero-knowledge government ID checks). This allows apps to authenticate users and transactions without exposing personal data. Designed for Aztec builders, the SDK lets developers add programmable privacy to decentralized apps, eliminating the need to create their own verification and ZK infrastructure. Shield demonstrates its practical use for private bridges, but the SDK aims to enable a wider ecosystem of private, accountable financial apps and services. The launch addresses growing demand for infrastructure that balances privacy and accountability. The SDK avoids traditional identity databases, storing encrypted data off-chain, screening at both entry and exit points, and including a gated disclosure mechanism for legal requests. human.tech's products, including the Clean SDK, focus on using zero-knowledge technology to enable verifiable personhood and privacy in digital systems.

TheNewsCrypto32 dk önce

human.tech Launches Clean SDK for Privacy-First Web3 Apps

TheNewsCrypto32 dk önce

Unlocking $100 Million in Liquidity? Pump.fun's New Policy Tests the 5-Minute Pump Technique

Pump.fun, a popular meme coin launchpad, has introduced a new standard mechanism called BOOST. It aims to address a significant capital efficiency issue: when a newly launched token graduates from its initial bonding curve to a liquidity pool (LP), roughly 20% of its liquidity becomes permanently locked as "dead liquidity," estimated to waste over $100 million annually. Instead of locking these funds permanently, BOOST repurposes them. Upon a token's migration, approximately 20% of the settlement funds (e.g., 17.6 SOL or ~$2516 USDC) are used to buy back the token on the open market over a 5-minute period via a Time-Weighted Average Price (TWAP) mechanism. All purchased tokens are immediately burned. This creates a brief, systematic buy pressure immediately after migration, potentially generating a short-term price surge ("pump") while permanently reducing the token's circulating supply. The goal is to enhance the immediate post-launch trading experience, potentially increasing trader retention and sustainable protocol revenue, which funds ongoing token buybacks. However, concerns exist that this artificial 5-minute boost could lower the barrier for launching low-quality tokens and lead to steeper price crashes once the buy pressure stops, if followed by large sell-offs. The feature automatically applies to tokens migrating after July 21, 2024, but not to previously migrated tokens or those launched via the Mayhem AI Agent lab.

marsbit39 dk önce

Unlocking $100 Million in Liquidity? Pump.fun's New Policy Tests the 5-Minute Pump Technique

marsbit39 dk önce

Podcast Notes | Conversation with GSR Asset Management Head: To Determine if This Crypto Rally is Real, Just Watch the Lending Rates on Aave

Podcast Summary: Dialogue with GSR's Head of Asset Management: To Determine if This Crypto Rally is Real, Just Check Lending Rates on Aave Andy Baehr, Managing Director of Asset Management at GSR, discusses the current crypto market, characterizing it as stuck in a state of "ambivalence" with short-lived, unsustainable rallies. He outlines a simple framework: the market moves between "ambivalence" and "conviction" (sustained upward momentum). Currently, every rally resembles a single-stage rocket booster that quickly fizzles out. Baehr identifies three key signals to watch: 1) DeFi lending rates, 2) the potential passage of the CLARITY Act, and 3) the market forming a consensus on the "Fed hawkish peak." He emphasizes that the most immediate indicator for the sustainability of the recent CPI-triggered rally is the USDC borrowing rate on Aave, currently around 3.75%—close to U.S. Treasury yields. The absence of a credit spread indicates low leverage demand and a lack of market energy. He explains that a healthy, sustained rally requires layered buying pressure. Last year's rally progressed from an ETH short squeeze to crypto-native trader influx and finally to ETF inflows. Currently, this structure is missing. Other potential structural buyers like Digital Asset Treasury (DAT) companies are absent, and ETF flows have proven transient. Baehr notes that while small-cap crypto tokens outperformed large caps in Q2—a potential sign of capitation in major assets—capital is also flowing to more exciting opportunities like AI stocks and tech IPOs, leaving crypto sidelined. Regarding DeFi, he highlights that platforms like Aave provide a clear, real-time signal of leverage demand through their supply/demand-driven interest rates. A significant, sustained rate increase would signal genuine market conviction. He also observes the quiet emergence of fixed-income-like products and vaults in DeFi. On regulation, the probability of the CLARITY Act passing before the August 7th deadline has dropped linearly from 75% to below 40% on Polymarket. Baehr suggests its passage would be treated as a bullish surprise, a potent driver for price movement. However, political hurdles, including ethical clause debates and disclosures about the First Family's crypto profits, remain significant obstacles. Ultimately, the market awaits clarity on the Fed's terminal rate under Chair Warsh. Until the "Fed Solstice"—the point where the market collectively understands the peak of hawkish policy—sustained conviction will be difficult to achieve.

marsbit1 saat önce

Podcast Notes | Conversation with GSR Asset Management Head: To Determine if This Crypto Rally is Real, Just Watch the Lending Rates on Aave

marsbit1 saat önce

İşlemler

Spot

Popüler Makaleler

MASK Nasıl Satın Alınır

HTX.com’a hoş geldiniz! Mask Network (MASK) satın alma işlemlerini basit ve kullanışlı bir hâle getirdik. Adım adım açıkladığımız rehberimizi takip ederek kripto yolculuğunuza başlayın. 1. Adım: HTX Hesabınızı OluşturunHTX'te ücretsiz bir hesap açmak için e-posta adresinizi veya telefon numaranızı kullanın. Sorunsuzca kaydolun ve tüm özelliklerin kilidini açın. Hesabımı Aç2. Adım: Kripto Satın Al Bölümüne Gidin ve Ödeme Yönteminizi SeçinKredi/Banka Kartı: Visa veya Mastercard'ınızı kullanarak anında Mask Network (MASK) satın alın.Bakiye: Sorunsuz bir şekilde işlem yapmak için HTX hesap bakiyenizdeki fonları kullanın.Üçüncü Taraflar: Kullanımı kolaylaştırmak için Google Pay ve Apple Pay gibi popüler ödeme yöntemlerini ekledik.P2P: HTX'teki diğer kullanıcılarla doğrudan işlem yapın.Borsa Dışı (OTC): Yatırımcılar için kişiye özel hizmetler ve rekabetçi döviz kurları sunuyoruz.3. Adım: Mask Network (MASK) Varlıklarınızı SaklayınMask Network (MASK) satın aldıktan sonra HTX hesabınızda saklayın. Alternatif olarak, blok zinciri transferi yoluyla başka bir yere gönderebilir veya diğer kripto para birimlerini takas etmek için kullanabilirsiniz.4. Adım: Mask Network (MASK) Varlıklarınızla İşlem YapınHTX'in spot piyasasında Mask Network (MASK) ile kolayca işlemler yapın.Hesabınıza erişin, işlem çiftinizi seçin, işlemlerinizi gerçekleştirin ve gerçek zamanlı olarak izleyin. Hem yeni başlayanlar hem de deneyimli yatırımcılar için kullanıcı dostu bir deneyim sunuyoruz.

240 Toplam GörüntülenmeYayınlanma 2024.12.12Güncellenme 2026.06.02

MASK Nasıl Satın Alınır

Tartışmalar

HTX Topluluğuna hoş geldiniz. Burada, en son platform gelişmeleri hakkında bilgi sahibi olabilir ve profesyonel piyasa görüşlerine erişebilirsiniz. Kullanıcıların MASK (MASK) fiyatı hakkındaki görüşleri aşağıda sunulmaktadır.

活动图片