BTC Faces Triple Resistance at $80,000 Milestone, HYPE Hits New Highs Signaling Potential | Invited Analysis

Odaily星球日报2026-05-26 tarihinde yayınlandı2026-05-26 tarihinde güncellendi

Özet

This weekly analysis maintains a structured framework, focusing on Bitcoin (BTC) and HYPE, dissecting their multi-timeframe price action to identify key support and resistance zones and formulate actionable trading plans. The previous week's short position on BTC yielded a 2.78% gain, reinforcing the "signal-driven, disciplined" approach. For Bitcoin, the core scenario revolves around the battle between the 78,500–79,500 USD resistance zone and the 73,500–75,000 USD support area. The daily chart shows BTC within a rising channel; a failure to hold support at the channel's midline could lead to a test of the lower boundary. The 4-hour chart details an 8-segment corrective structure from the 82,850 USD high. Two short-term strategies are proposed: (A) Selling on a failed rally into the 78.5k-79.5k zone, with a stop above 80,600, or (B) Selling a confirmed breakdown below the 73.5k-75k support, with a stop above 76,500. Medium-term positioning remains neutral. For HYPE, the 4-hour chart indicates a five-wave advance from the May 14th low, now showing potential exhaustion and a top warning signal near 65 USD. The core view is to watch for a potential short-term peak formation. The recommended strategy is to avoid chasing the rally and instead look for a long setup upon a pullback to the 47.5–50 USD support zone, provided clear stabilization and model confirmation signals appear. The report concludes with a detailed review of the prior BTC short trade, executed based on model s...

Continuing with our structured analytical framework this week, we dissect the current movements of Bitcoin and HYPE from multiple time dimensions, assess the struggle between buyers and sellers around key resistance and support zones, and formulate specific, actionable operational plans accordingly.

Last week's short position successfully yielded a 2.78% profit, once again validating the trading logic of 'signal-driven, strict discipline'. However, a single profitable trade does not necessarily indicate that the market direction is definitively correct – the market always retains the possibility of exceeding expectations.

The core variable for this week remains the battle between the $78,500–$79,500 resistance zone and the $73,500–$75,000 support zone. The outcome will be answered by the market itself.

Summary of Core Trading Views for This Week:

• Analysis of BTC's multi-cycle price structure. (Detailed in Part I)

• BTC price forecast and mid-term, short-term operational strategies for this week. (Detailed in Part II)

• Analysis of HYPE's hourly chart structure. (Detailed in Part III)

• HYPE price forecast and short-term operational strategy for this week. (Detailed in Part IV)

Market Verification of Last Week's Trading Strategies and Core Views:

• BTC Short-term Trading Results: Bitcoin completed one short-term short position (1x leverage) last week, achieving a profit of approximately 2.78%. (Detailed in Table I)

• Market Verification of BTC Price Forecast: In last week's article, we noted: If the price effectively breaks below the support zone of $78,500–$79,500, it will test the support strength near $75,000. The current market movement verifies our previous forecast.

I. Analysis of Bitcoin's Multi-Cycle Price Structure

1. BTC Daily Chart Structure Analysis

Bitcoin _ Daily Chart:
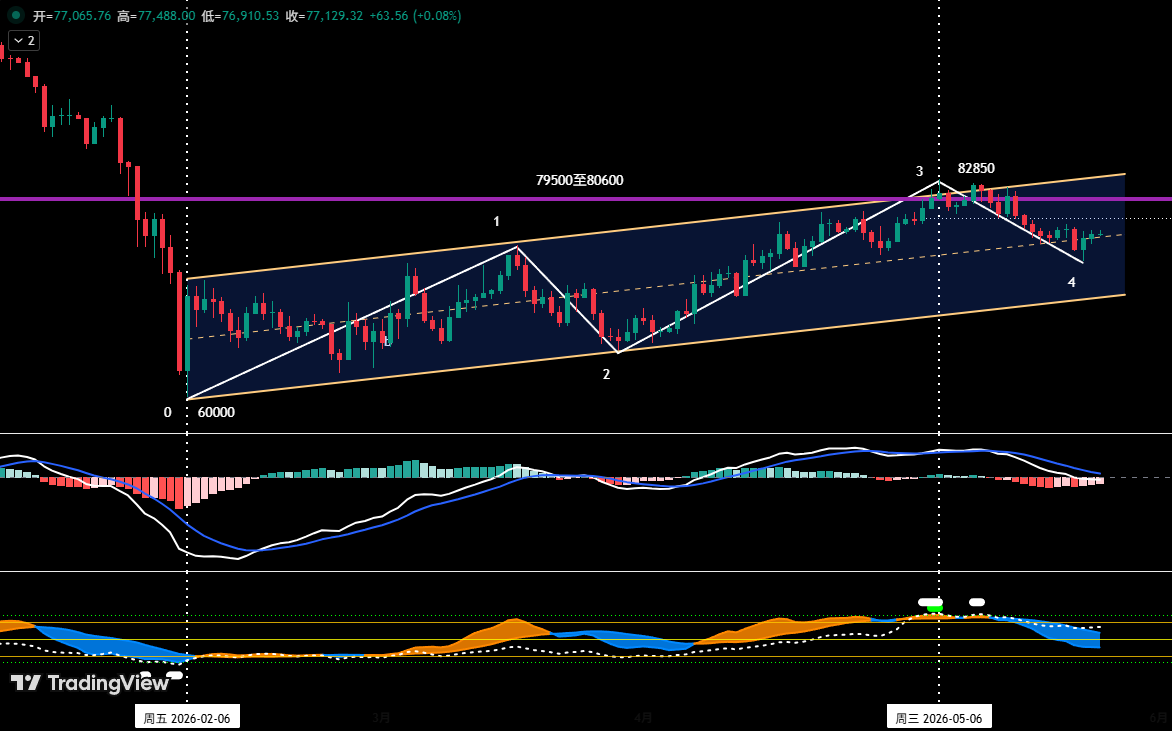
Figure 1

• As shown in (Figure 1), since establishing a stage low near $60,000 on February 6, 2026, Bitcoin's daily chart has constructed and maintained a clearly structured ascending channel: its lower boundary is formed by connecting the lows of February 6 and March 29, while the upper boundary is drawn parallel to the lower boundary through the high of March 17.

• In our April 27th weekly review, we pointed out: "The current price is facing dual pressure from the channel's upper boundary and the $79,500 to $80,600 resistance zone, making a breakthrough likely difficult". Subsequent market action confirmed this assessment. After nearly 20 days of tug-of-war between bulls and bears, although a new rebound high of $82,850 was reached on May 6, it failed to effectively break through this zone's resistance, and the price subsequently began to fluctuate downward.

From the current structure, the price has retraced from near the channel's upper boundary to the mid-channel area. If the price fails to find effective support near the mid-channel and resume its uptrend, the probability of subsequently seeking support at the channel's lower boundary is increasing.

2. In-Depth Analysis of BTC's Hourly Chart Structure

Bitcoin _ 4-Hour Chart
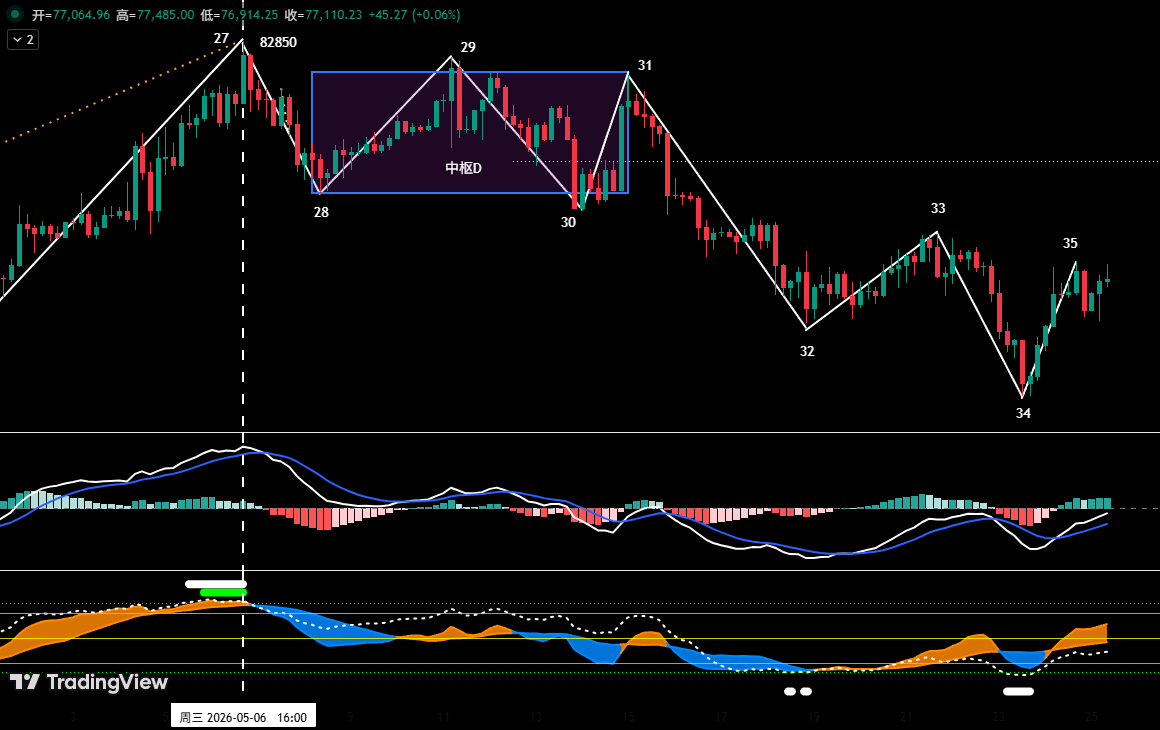
Figure 2

As shown in (Figure 2), from the May 6 high of $82,850 to the ongoing adjustment;

• On the 4-hour chart, it can be subdivided into an 8-segment adjustment structure: from "Segment 27-28" to "Segment 34-35"; Central D: Due to the overlapping of segments 28-29, 29-30, and 30-31, they constitute Central D.

• From the 4-hour chart structure, segment 34-35 is about to rebound to the $78,500–$79,500 zone. If the price faces resistance and falls back after rebounding to this zone, failing to form an effective breakthrough, the market is likely to continue the current fluctuating adjustment pattern and test the core support band of $73,500–$75,000 again.

II. Bitcoin Price Forecast and Operational Strategy for This Week

1. BTC Price Forecast for This Week:

Core View This Week: Focus on the outcome of the battle between bulls and bears for the $78,500–$79,500 resistance zone and the $73,500–$75,000 support zone.

2. Core Resistance Levels:

• First Resistance Zone: $78,500–$79,500 (near the boundaries of two central zones)

• Second Resistance Zone: $83,500–$84,500 (previous dense trading area)

3. Core Support Levels:

• First Support Zone: $73,500–$75,000 (previous key support area)

• Second Support Zone: $69,500–$70,500 (previous key support area)

4. Operational Strategy for This Week (Excluding Impact of Sudden News)

1. Mid-term Strategy:

Bitcoin _ Daily Chart: (Position Monitoring Model)
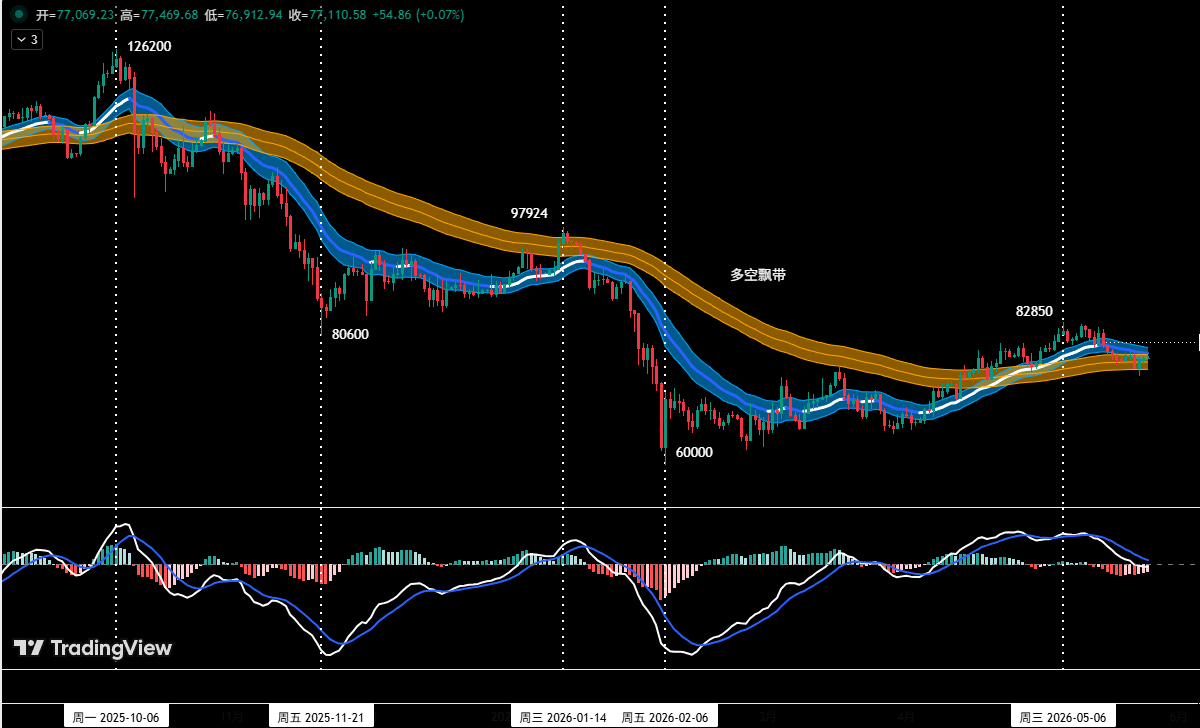
Figure 3

Position Monitoring Model: As shown in (Figure 3), based on trading rules, the market's mid-term direction is not yet clear. This week's mid-term strategy is to maintain a no-position, wait-and-see approach.

2. Short-term Strategy: Utilize 30% of capital, set stop-loss points, and look for "spread" opportunities based on support and resistance levels. (Using 30-minute/60-minute as the operational cycle).

3. In short-term operations, to dynamically respond to complex market developments, we have prepared two specific operational plans in advance: Plan A/B.

Plan A: Rebound Meets Resistance, Sell High.

• Entry: When the price rebounds to the $78,500–$79,500 zone and encounters resistance, combined with a top signal from the quantitative model, a short position below 30% can be established.

• Risk Control: Initial stop-loss set above $80,600.

• Exit: When the price adjusts near important support levels combined with model signals, gradually close the position to take profits.

Plan B: Effectively Breaks Support, Follow the Trend Short.

• Entry: When the price effectively breaks below the $73,500–$75,000 support zone combined with a model top signal, a short position below 30% can be established.

• Risk Control: Initial stop-loss set above $76,500.

• Exit: When the price falls to important support levels combined with model signals, gradually close the position to take profits.

III. HYPE Price Structure Analysis

HYPE_4-Hour Chart
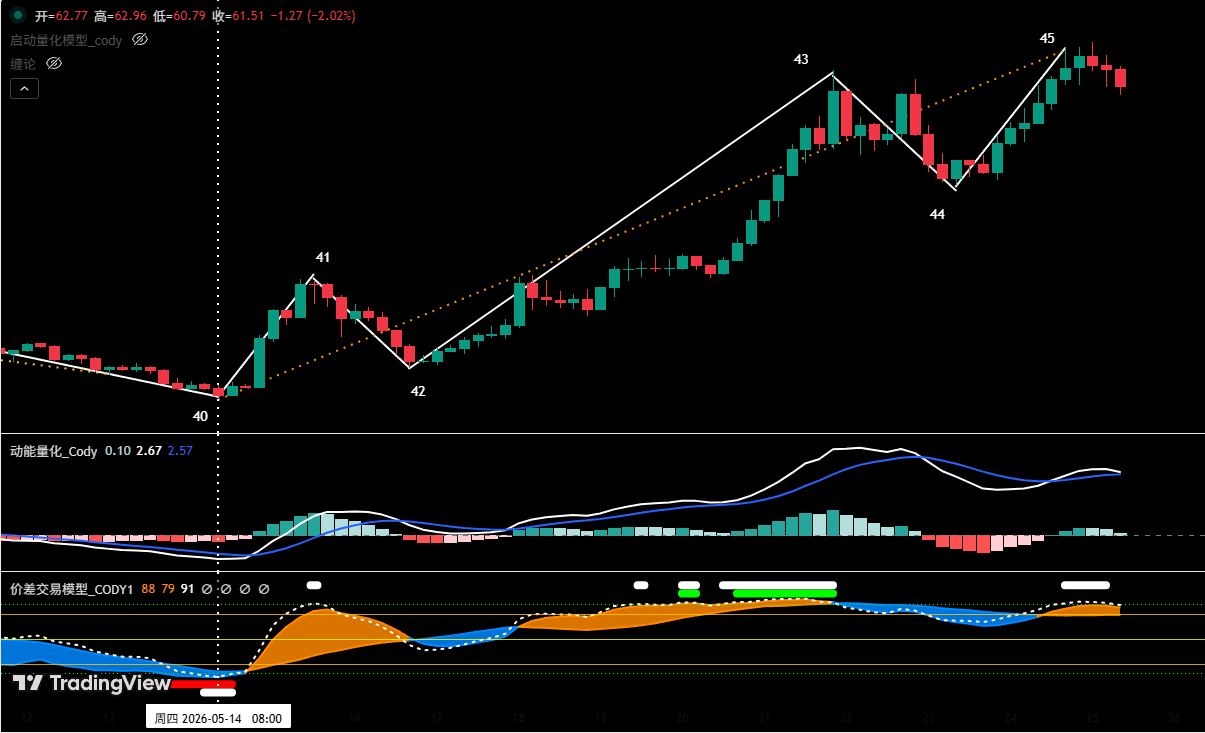
Figure 4

1. As shown in (Figure 4), the uptrend in HYPE starting from the May 14 low of $38.14 can be divided into a five-segment structure on the 4-hour chart: segments 40-41, 41-42, 42-43, 43-44, 44-45.

2. Our proprietary "Spread Trading Model" indicates that near endpoint 45, a top warning signal (white dot) has been triggered.

3. From the "Momentum Quantification Model" perspective, the rising segment (44-45) near $65 has shown signs of weakening upward momentum.

4. If the price forms a momentum bearish divergence state at "endpoint 45" and resonates with the top warning signal from the "Spread Trading Model", the probability of the price forming a short-term high here increases significantly.

IV. HYPE Price Forecast and Short-Term Operational Strategy for This Week

1. HYPE Price Forecast for This Week:

Core View on HYPE This Week:

• Observe whether "endpoint 45" can form a short-term high since the rise began on May 14.

• If a short-term high is formed, subsequently, look for short-term long opportunities when the price retraces to key support areas (e.g., $47.5 to $50) and shows clear signs of stabilization.

2. HYPE Short-Term Operational Strategy for This Week: (Buy on Support)

Currently, the strategy of "avoid blind chasing of highs, buy on dips" should be followed. If the price retraces to the $47.5 to $50 zone, finds support, and shows stabilization signals, combined with bottom signals triggered by both models, consider a light long position. Position size must be controlled below 30%, and strict stop-loss discipline must be maintained.

V. Operational Review

1. Short-Term Operation Review:(See Table I)

We strictly followed the operational plan. Based on trading signals from our proprietary "Spread Trading Model" and "Momentum Quantification Model", we completed one short-term (short) operation last week, achieving a trading profit of 2.78%.

1. Bitcoin Short-Term Trading Details Summary: (Leverage*1x)
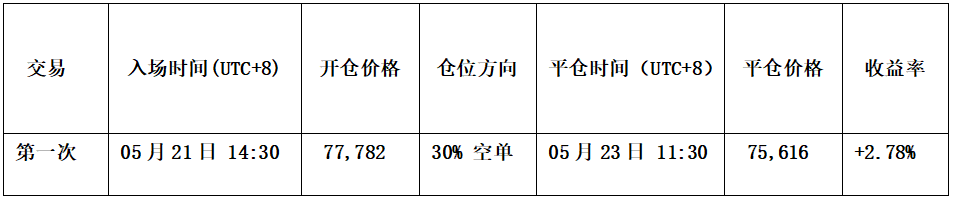
Table I

2. Short-Term Trading Review: (See Figure VI)

• Entry Strategy:

a. When the price rebounded near $78,500, encountered resistance, showed pressure signals, and the candlestick formed a "top reversal" bearish signal;

b. The "Spread Trading Model" triggered a top warning signal (white dot), and the "Momentum Quantification Model" formed a momentum bearish divergence signal.

Therefore, we established a 30% short position at $77,782.

• Exit Strategy:

a. When the price fell near $75,000 and found support, and the candlestick formed a "bottom reversal" signal;

b. The "Spread Trading Model" triggered a strong bottom warning signal (red dot + white dot), resonating with a bottom signal from the "Momentum Quantification Model".

Therefore, we closed all positions near $75,616.

• Summary: This trade successfully yielded a profit of approximately 2.78%.

BTC_30 Minute Chart: (Momentum Quantification Model + Spread Trading Model)
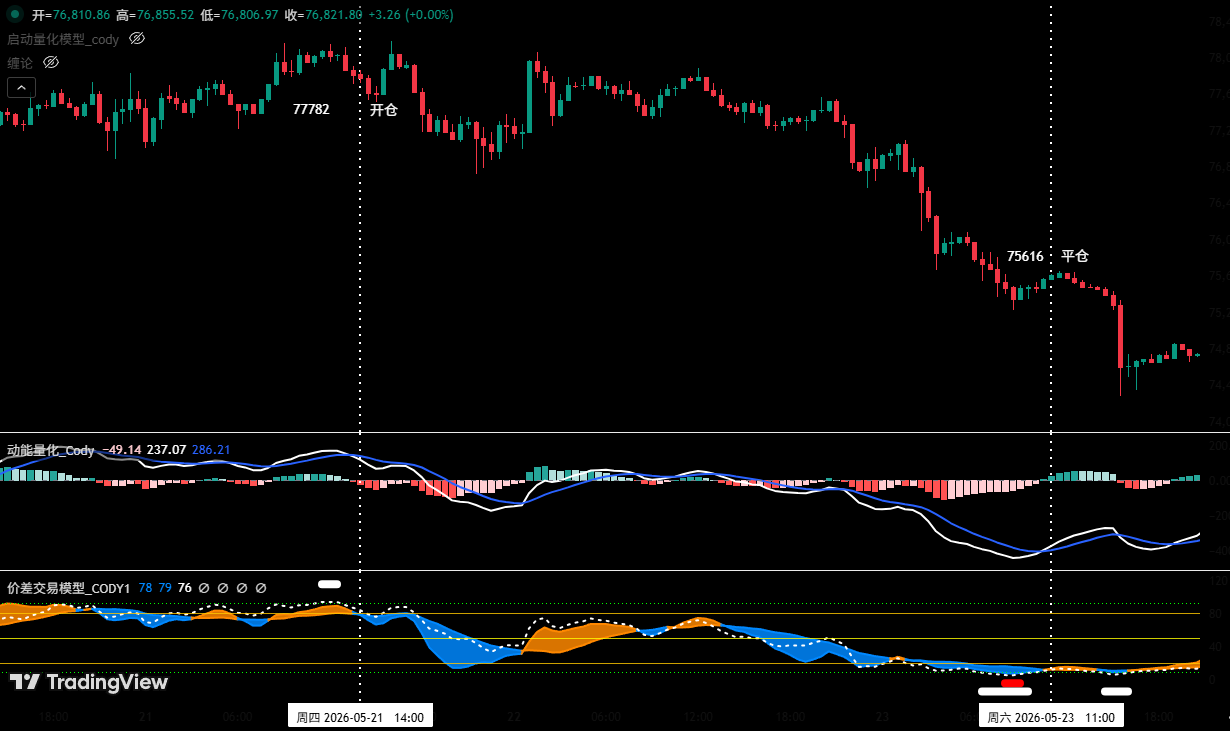
Figure V (Short-Term Trading Illustration)

VI. Special Note:

1. When opening a position: Immediately set the initial stop-loss point.

2. When profit reaches 1%: Move the stop-loss to the entry cost price (break-even point) to ensure capital safety.

3. When profit reaches 2%: Move the stop-loss to the 1% profit level.

4. Continuous Tracking: Thereafter, for every additional 1% profit, move the stop-loss up by 1%, dynamically protecting and locking in profits.

Financial markets are ever-changing; all market analysis and trading strategies require dynamic adjustment. All views, analytical models, and operational strategies mentioned in this article are derived from personal technical analysis, intended solely for personal trading log purposes, and do not constitute any investment advice or operational basis. The market carries risks; investment requires caution. Please do not make decisions based on this.


Trend Kriptolar

İlgili Sorular

QAccording to the article's analysis, what are the two main resistance and support zones for Bitcoin this week?

AThe core resistance zone is 78,500-79,500 USD, and the core support zone is 73,500-75,000 USD.

QWhat was the primary technical reason for the author's successful short trade on Bitcoin the previous week?

AThe trade was executed based on a confluence of signals: the price encountered resistance near 78,500 USD forming a top reversal candlestick pattern, and both the author's 'Price Difference Trading Model' and 'Dynamic Energy Quantification Model' triggered top warning signals, including momentum divergence.

QBased on the analysis, what is the key condition for HYPE to present a potential short-term buying opportunity?

AA short-term buying opportunity for HYPE may arise if the price pulls back to the 47.5 to 50 USD support zone, shows clear signs of stabilization, and is confirmed by bottom signals from the author's trading models.

QWhat is the author's current medium-term (midline) strategy for Bitcoin, as indicated by their 'Position Monitoring Model'?

AAccording to the 'Position Monitoring Model', the medium-term market direction is not yet clear. Therefore, the author is maintaining a strategy of staying out of the market (holding no medium-term positions) and observing.

QIn the article's proposed short-term trading plans for Bitcoin, what are the two main scenarios (Plan A and Plan B)?

APlan A: Sell short on rallies if the price rebounds to the 78,500-79,500 USD resistance zone and encounters selling pressure. Plan B: Sell short on breakouts if the price effectively breaks below the 73,500-75,000 USD support zone.

İlgili Okumalar

Bernstein Analysis: Can the $142 Billion Long-Term Order Hold Up the Memory Cycle?

Bernstein revisits long-term agreements (LTAs) in the memory industry, highlighting new contracts with purchase commitments, minimum prices, and financial guarantees signed by Micron and SanDisk. These aim to provide an earnings floor for the coming years. Micron has 16 strategic customer agreements, with 14 representing approximately $100 billion in minimum revenue and about $22 billion in cash deposits/commitments. SanDisk has contracts for around $42 billion in minimum revenue and over $11 billion in guarantees. Combined, these ~$33 billion in guarantees make it more costly for major clients to walk away. However, Bernstein models that the potential revenue needing protection over 3-5 years is around $5.2 trillion. The existing guarantees thus cover only about 0.6% of that scale. While LTAs provide a cushion, they cannot fully shield profits in a severe downturn, as clients may still find it cheaper to breach contracts if spot prices fall deeply below floor prices. LTAs are most suitable for large, credit-worthy customers like U.S. cloud service providers with stable, high-volume AI infrastructure needs. Consumer segments (phones, PCs) and some Chinese clients are less likely to adopt them, leaving an estimated 30-50% of the DRAM/NAND market exposed to spot price volatility. AI demand (e.g., HBM for training, storage for inference) supports higher valuations and makes LTAs more attractive for locking in high-demand customers. Yet, Bernstein stresses that LTAs soften, but do not eliminate, the memory cycle. Their true test will come in the next downturn, revealing whether clients honor contracts and whether guarantees provide sufficient pain to maintain supplier discipline.

marsbit23 dk önce

Bernstein Analysis: Can the $142 Billion Long-Term Order Hold Up the Memory Cycle?

marsbit23 dk önce

Dialogue with Jia Hang | Looking Back at Two Decades of Chinese Payment Going Global

**Summary: A Conversation with Jia Hang on Two Decades of China's Payment Globalization** Jia Hang, a veteran with over twenty years in payments, reflects on China's attempts to build a global payment network through three key phases: UnionPay (card networks), Alipay+ (digital wallets), and now, stablecoins. His journey began at UnionPay International, aiming to establish China's card network abroad. While successful in following Chinese tourists ("where Chinese go, UnionPay goes"), it struggled to achieve true global scale. The core lesson: card networks like Visa/Mastercard's unassailable advantage isn't just technical standards, but their deeply entrenched **governance and profit-sharing models** that create powerful network effects. Competing as the "same species" is nearly impossible. At Ant Group, he led Alipay+, a strategy to bypass card networks by interconnecting local e-wallets worldwide. While innovative, it faced a similar ceiling. Mobile QR payments and card swipes were essentially **the same species competing for the same pie**, lacking a disruptive value proposition for users or a sustainable new incentive model to replace the card networks' established flywheel. Today, at Singapore's DCS, Jia focuses on stablecoin-based payments. He argues stablecoins represent a fundamental shift. They are not competing with Visa for consumer payments but challenging the **traditional banking and account system for value movement**. Products like "U Cards" (stablecoin-linked payment cards) are transitional, leveraging existing card networks for acceptance while building new rails. The real potential lies in stablecoins enabling seamless, low-cost global value transfer, potentially reorganizing the financial infrastructure around **accounts rather than cards**. Jia believes stablecoin adoption for local retail payments, cross-border transactions, and as high-yield savings vehicles is becoming irreversible. This could gradually reduce reliance on traditional fiat channels, especially in regions with weak currencies or capital controls. The quest for the "next global payment network" continues, now centered on whether stablecoins can successfully bridge Web2 and Web3, establish new governance, and create compelling user value beyond mere cost reduction.

marsbit47 dk önce

Dialogue with Jia Hang | Looking Back at Two Decades of Chinese Payment Going Global

marsbit47 dk önce

Circle's Stock Price Plunges 76%, Hong Kong Dollar Stablecoin Set to Launch Within Two Weeks

Circle's stock price has plunged approximately 76% from its 2023 peak, reflecting a major market revaluation. Despite this, Circle President Heath Tarbert emphasized the company's focus on long-term execution and its dominant position with USDC's $73 billion circulation across 34 blockchains. The competitive landscape is intensifying. A new consortium-backed stablecoin, Open USD, is attempting to challenge incumbents by sharing reserve yields with partners. More significantly, Visa's new stablecoin platform, initially supporting Open USD while also being compatible with USDC, could erode Circle's network effects. In response, Circle is expanding into real-world payments through partnerships like the one with Japan's JCB. Separately, Tether (USDT) faces a two-year compliance window under new U.S. regulations, requiring it to adjust its reserve composition away from assets like Bitcoin and loans towards cash and U.S. Treasuries. Meanwhile, in Hong Kong, Standard Chartered-backed fintech firm Dian Dian is poised to launch a licensed HKD-pegged stablecoin (HKDAP), moving the industry into a phase where the real test is integrating licensed stablecoins into actual payment flows and corporate treasury systems. The sharp decline in Circle's stock underscores a broader shift: the stablecoin market is moving from a winner-takes-all dynamic to a multi-player competitive arena where execution, compliance, and real-world utility are becoming paramount.

marsbit47 dk önce

Circle's Stock Price Plunges 76%, Hong Kong Dollar Stablecoin Set to Launch Within Two Weeks

marsbit47 dk önce

İşlemler

Spot

Popüler Makaleler

HYPE Nasıl Satın Alınır

HTX.com’a hoş geldiniz! Hyperliquid (HYPE) satın alma işlemlerini basit ve kullanışlı bir hâle getirdik. Adım adım açıkladığımız rehberimizi takip ederek kripto yolculuğunuza başlayın. 1. Adım: HTX Hesabınızı OluşturunHTX'te ücretsiz bir hesap açmak için e-posta adresinizi veya telefon numaranızı kullanın. Sorunsuzca kaydolun ve tüm özelliklerin kilidini açın. Hesabımı Aç2. Adım: Kripto Satın Al Bölümüne Gidin ve Ödeme Yönteminizi SeçinKredi/Banka Kartı: Visa veya Mastercard'ınızı kullanarak anında Hyperliquid (HYPE) satın alın.Bakiye: Sorunsuz bir şekilde işlem yapmak için HTX hesap bakiyenizdeki fonları kullanın.Üçüncü Taraflar: Kullanımı kolaylaştırmak için Google Pay ve Apple Pay gibi popüler ödeme yöntemlerini ekledik.P2P: HTX'teki diğer kullanıcılarla doğrudan işlem yapın.Borsa Dışı (OTC): Yatırımcılar için kişiye özel hizmetler ve rekabetçi döviz kurları sunuyoruz.3. Adım: Hyperliquid (HYPE) Varlıklarınızı SaklayınHyperliquid (HYPE) satın aldıktan sonra HTX hesabınızda saklayın. Alternatif olarak, blok zinciri transferi yoluyla başka bir yere gönderebilir veya diğer kripto para birimlerini takas etmek için kullanabilirsiniz.4. Adım: Hyperliquid (HYPE) Varlıklarınızla İşlem YapınHTX'in spot piyasasında Hyperliquid (HYPE) ile kolayca işlemler yapın.Hesabınıza erişin, işlem çiftinizi seçin, işlemlerinizi gerçekleştirin ve gerçek zamanlı olarak izleyin. Hem yeni başlayanlar hem de deneyimli yatırımcılar için kullanıcı dostu bir deneyim sunuyoruz.

340 Toplam GörüntülenmeYayınlanma 2024.12.11Güncellenme 2026.06.02

HYPE Nasıl Satın Alınır

Tartışmalar

HTX Topluluğuna hoş geldiniz. Burada, en son platform gelişmeleri hakkında bilgi sahibi olabilir ve profesyonel piyasa görüşlerine erişebilirsiniz. Kullanıcıların HYPE (HYPE) fiyatı hakkındaki görüşleri aşağıda sunulmaktadır.

活动图片