Bitcoin Reclaims $94,000: A New Bull Market Beginning or a Bull Trap?

marsbit2025-12-10 tarihinde yayınlandı2025-12-10 tarihinde güncellendi

Özet

Bitcoin has surged back to the $94,000 level, sparking debate over whether this marks the beginning of a new bull run or a short-term bullish trap. Despite the strong price performance, trading volume has not fully supported the upward move. Key resistance levels and the upcoming FOMC meeting have influenced market sentiment. After a brief period of consolidation, Bitcoin broke through $93,500, reestablishing a short-term bullish trend. Technical analysis indicates the formation of bullish patterns such as the "cup and handle" and "inverse head and shoulders," suggesting a potential rise to $104,000 if $96,000 is breached. However, failure to hold above $96,000 could trigger a pullback toward $88,000–$89,000 or even lower. Market liquidity presents mixed signals. The buy-sell ratio remains low, and retail participation—especially from South Korea—has cooled, though U.S. institutional demand appears stronger. On-chain data shows increased activity from large holders, indicating accumulation by "smart money." Macro factors include potential Fed rate cuts and supportive U.S. policy developments, such as proposed Bitcoin strategic reserves and stablecoin legislation. Bitcoin ETF approvals are also anticipated by mid-May, with traditional firms like Vanguard gradually opening access to crypto ETFs. Risks include overbought conditions, high leverage (with $120M in long liquidations possible below $87,000), and regulatory uncertainties outside the U.S. Investors should monitor t...

Last night, Bitcoin once again became the center of attention as its price strongly rebounded to the $94,000 mark. This breakthrough move has sparked widespread discussion in the market: does this mark the start of a new bull market, or is it just a brief technical rebound?

Despite the strong price performance, trading volume data did not fully support the upward trend.

Battle at Key Resistance and Market Sentiment Ahead of FOMC Meeting

After experiencing brief structural weakness on December 3rd, Bitcoin once struggled to secure a daily close above $93,000.

As the important macroeconomic event—the Federal Open Market Committee (FOMC) meeting—approached, most market participants chose to wait and see, leading to several days of sideways consolidation.

This stalemate was broken on December 5th when Bitcoin's price successfully broke through $93,500, forming the higher high needed to restore the short-term bullish trend.

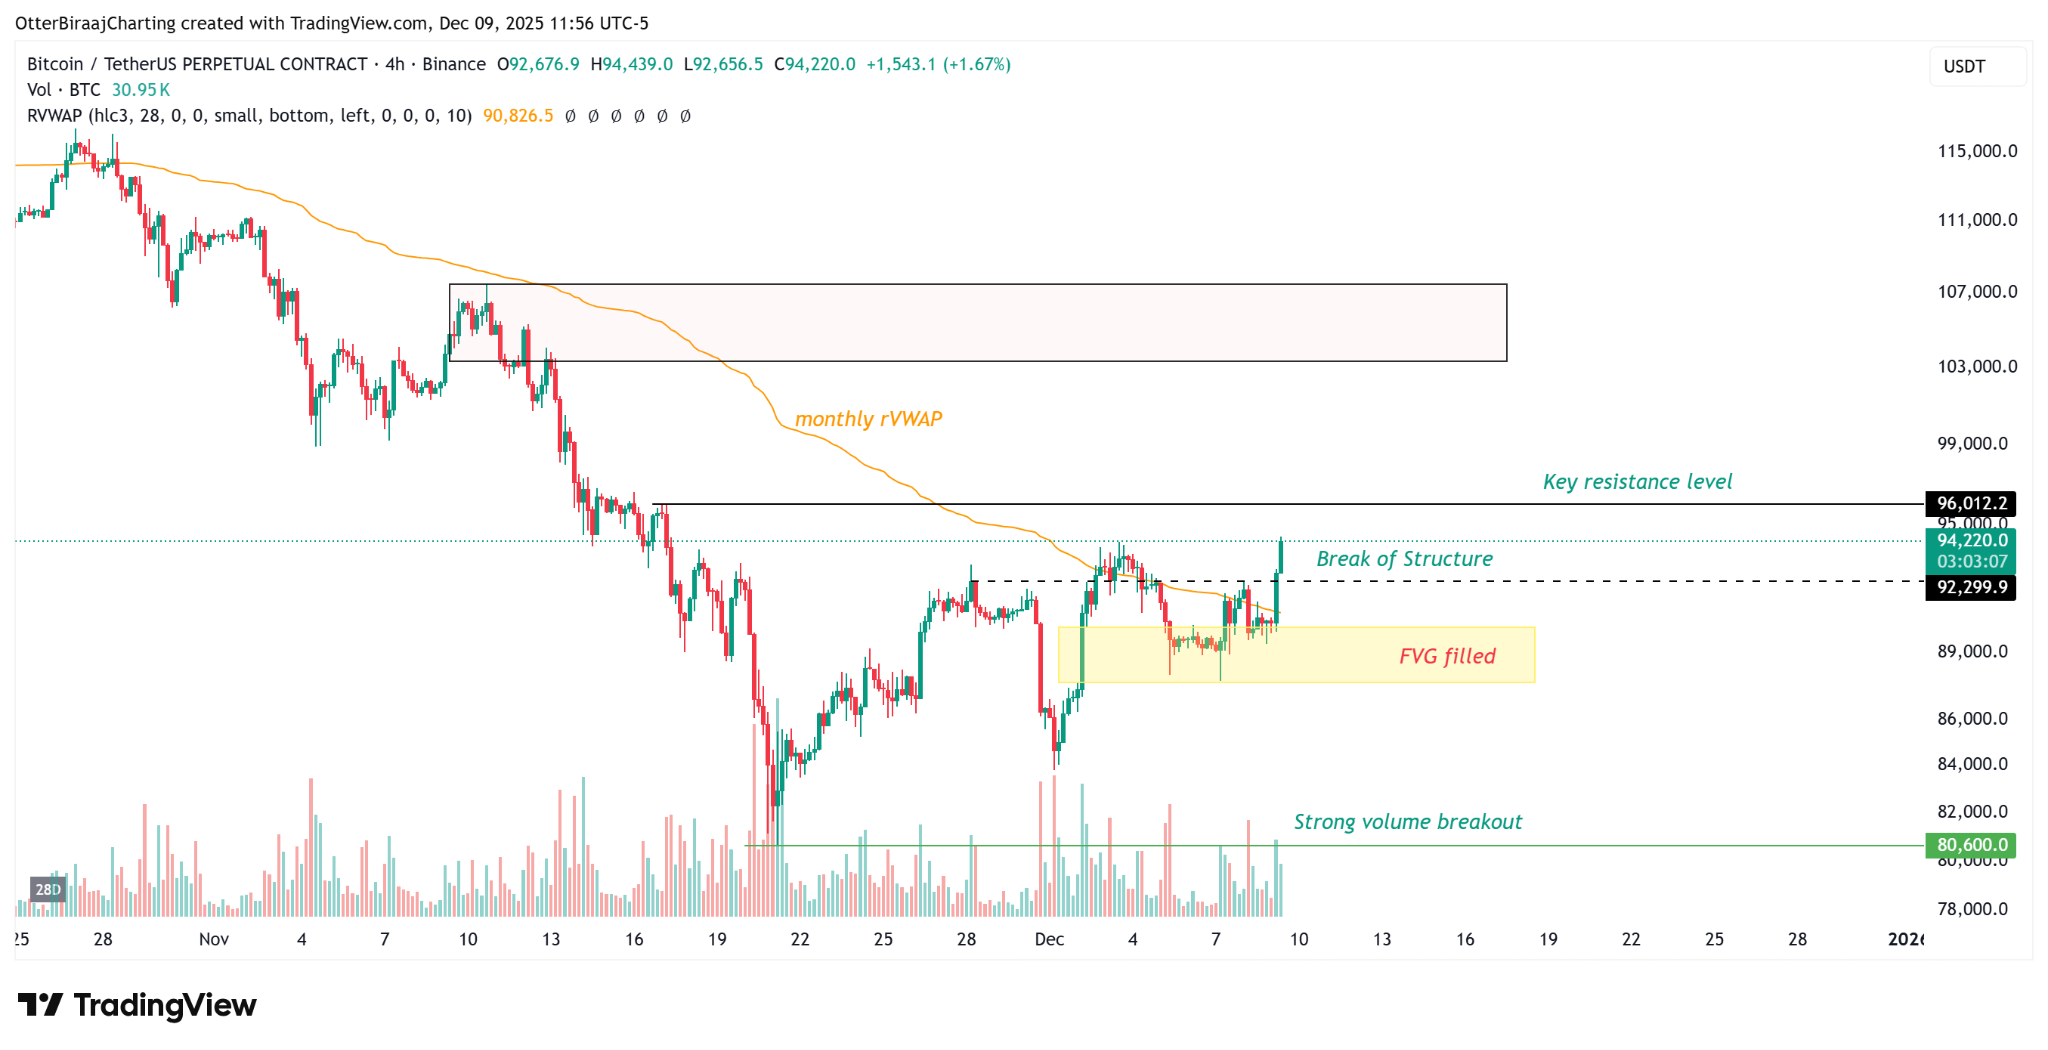
From a technical analysis perspective, on the four-hour chart, Bitcoin not only completely filled the fair value gap between $87,500 and $90,000 but also showed firm buying intent. The effectiveness of this breakthrough is particularly significant against the backdrop of potential volatility from upcoming macro events.


Technical Patterns and Key Level Analysis

Multiple bullish technical patterns have recently formed. A confirmed 'cup and handle pattern' is observed on the four-hour chart, suggesting that if Bitcoin can break above $96,000, the next target could be $104,000. Simultaneously, an 'inverse head and shoulders pattern' has also largely taken shape. These two bullish patterns together strengthen confidence among the bulls.

Market analysts generally view $94,000 as a key psychological level, coinciding with a descending trendline resistance. The criteria for judging trend sustainability are clear: if Bitcoin's daily closing price can stabilize above $96,000, it will be seen as a strong bullish reversal signal; conversely, failure at this resistance could lead to a rapid pullback to the $88,000-$89,000 range.

More broadly, the $95,000 area is seen as the 'main battlefield' between bulls and bears. A successful breakout above this area could open the door for the price to test the $99,000 to $107,000 range; whereas a failure to break through could result in a deeper correction, potentially retesting the $85,000 support, or even plunging further to $76,000 in extreme cases.


Contradictory Signals from Liquidity Conditions and Market Participation

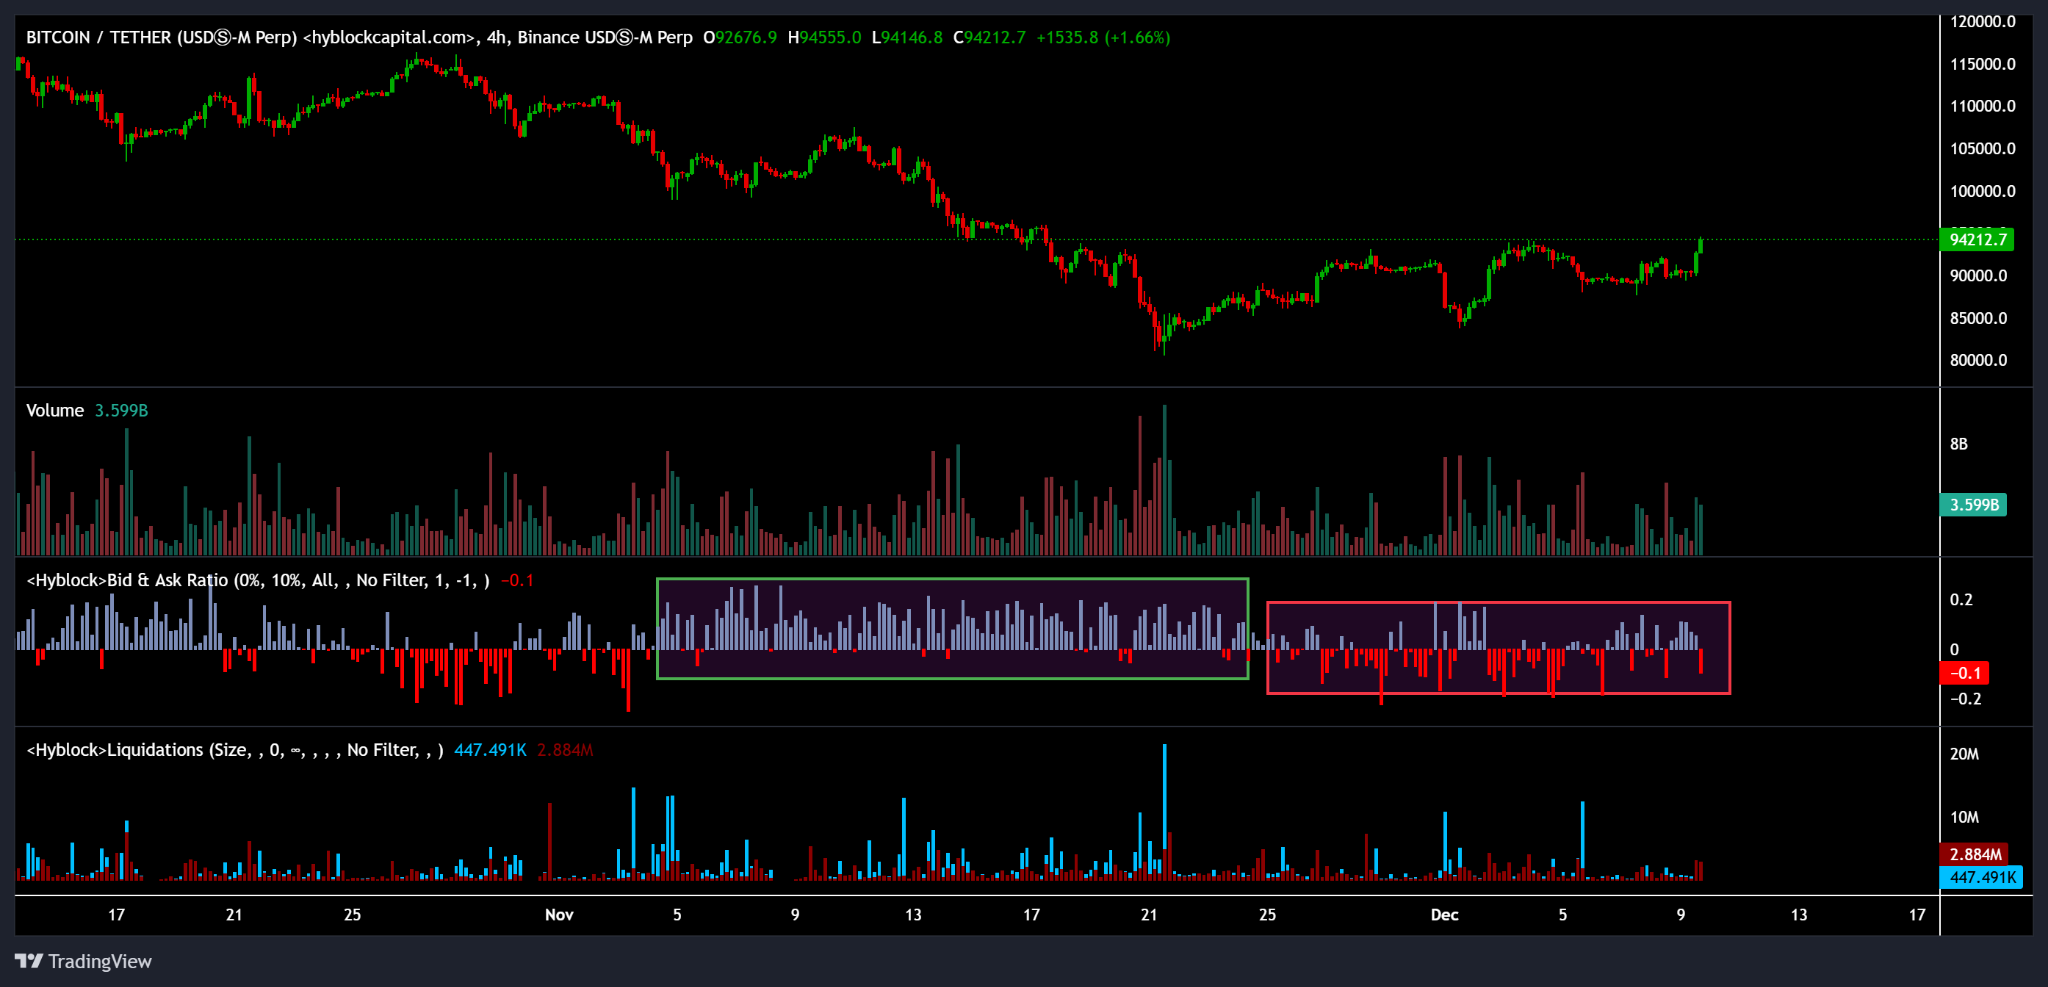
Analysis of Bitcoin's Preference-Sell Ratio and Liquidation Data. Source: Hyblock

Although the price action is encouraging, market liquidity indicators do not fully validate the upward trend. Bitcoin's buy-sell ratio remains at a relatively low and unstable level.

Unlike the aggressive buying seen during November's plunge from $100,000 to $80,000, the current rebound lacks the same intensity of buying support. This suggests that the recent rise is primarily driven by price movement rather than solid new demand. Exchange premium data also paints a complex picture.

The Kimchi Premium (a key indicator of retail sentiment in South Korea) has significantly cooled. Previously, the Korean market often traded at a premium during rallies, but this enthusiasm has now waned, approaching parity or slightly negative, indicating that retail speculators have not yet entered the market en masse.

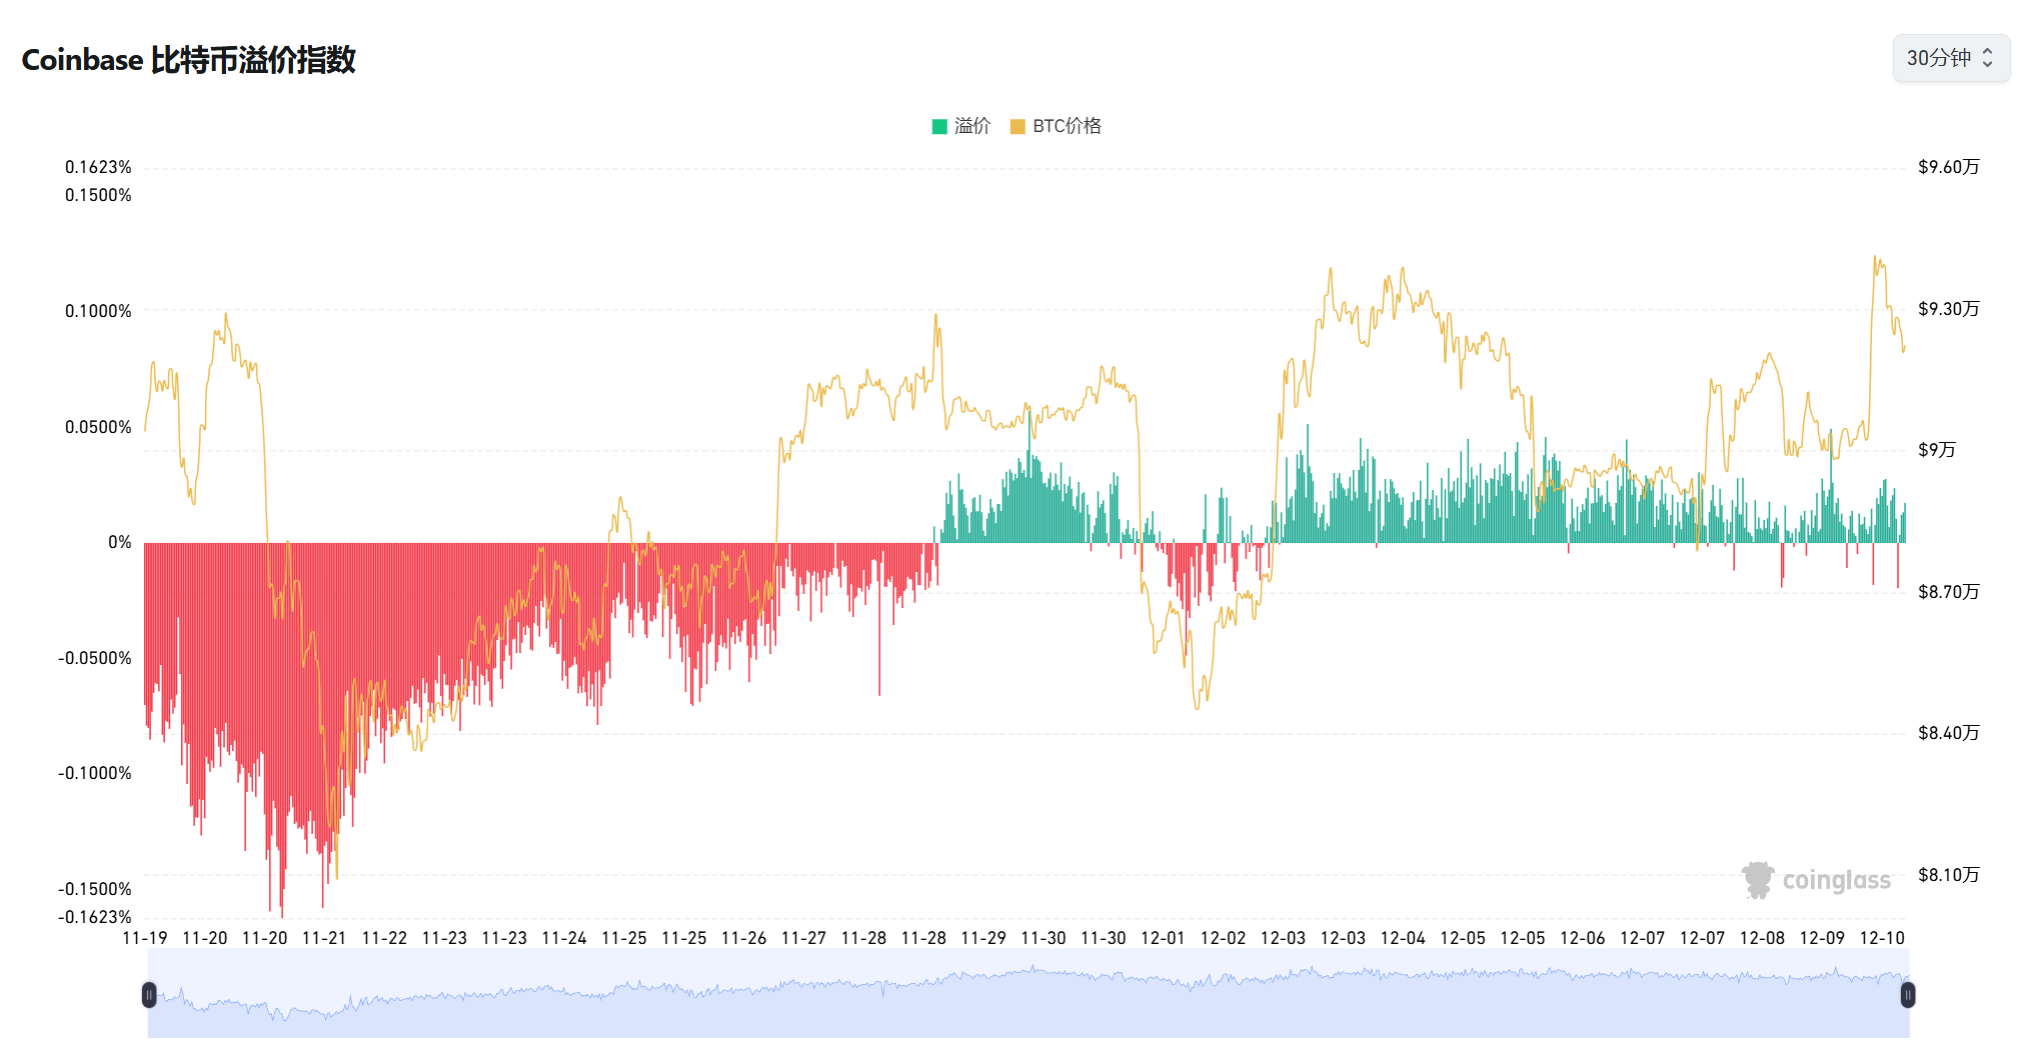
Meanwhile, the Coinbase Premium Index (representing U.S. institutional demand) has turned positive again.

Historical data shows that moderate positive readings often appear during early trend reversals and spot accumulation phases. This regional divergence makes the market outlook more complex.

On-chain data provides further insight. The number of 'whale' addresses holding at least 100 BTC has hit a new high for 2025, and large transfers have reached a three-month peak. This typically indicates that 'smart money' is building positions, rather than the market being dominated by short-term speculators. The average cost basis for short-term holders is now near $90,000, forming a psychological support level.


Macro Backdrop and Policy Catalysts

The Federal Reserve's monetary policy moves remain a key macro factor influencing Bitcoin's trajectory. Ahead of the FOMC meeting, the market widely anticipates a potential 25 basis point rate cut. Historical data shows that five out of the six FOMC meetings this year coincided with Bitcoin price pullbacks.

Furthermore, policy expectations have also become a major market driver. The Trump administration's proposed concept of a 'Bitcoin Strategic Reserve' and the advancement of U.S. stablecoin legislation have injected optimism into the market.

More crucially, the approval process for Bitcoin spot ETFs is entering its final stages, with Bloomberg analysts expecting a result by mid-May. Applications from institutions like BlackRock and Fidelity are queued awaiting approval.

Participation from traditional financial institutions is also deepening. Global asset management giant Vanguard has opened cryptocurrency ETF access to specific clients, including Bitcoin and Ethereum-related products. This widening of traditional financial channels removes another barrier for large-scale institutional capital inflows into the crypto market.


Market Risks and Potential Challenges

Despite the seemingly optimistic outlook, several risk factors cannot be ignored. From a technical indicator perspective, Bitcoin's Relative Strength Index (RSI) has entered overbought territory (>70), and the 200-day moving average around $96,216 poses strong resistance.

Leverage risk is particularly prominent. Data from Bybit and OKX shows that long positions account for 58%. If the price falls below $87,000, it could trigger a cascade of liquidations exceeding $120 million.

This high-leverage environment makes the market more prone to violent fluctuations. Regulatory uncertainty persists.

Although U.S. policy winds are warming, the EU's MiCA framework is just beginning to be implemented, and regulatory attitudes remain strict in some Asian countries. This global lack of regulatory synchronization could continue to affect market stability.


Conclusion

Bitcoin's climb back above $94,000 has undoubtedly injected new optimism into the market, but whether the bull market has truly restarted requires more evidence. The current market is at a resonance point of bullish technical signals and macro tailwinds, yet constrained by key resistance levels and liquidity concerns.

Investors should closely watch the situation around the $96,000 breakout and the Federal Reserve's policy moves, as these factors are more important than any single candlestick pattern. In an environment where volatility may intensify, position management and risk control are more crucial than chasing short-term gains.

The Bitcoin market has entered a new era of complex dynamics driven by ETF flows, leverage cycles, stablecoin liquidity, holder structure, and macro liquidity. Understanding the interrelationships of these signals will be key to navigating future markets.


İlgili Sorular

QWhat are the two main bullish technical patterns mentioned in the article that have formed on Bitcoin's price chart?

AThe two main bullish technical patterns are a confirmed 'cup and handle pattern' and a nearly completed 'inverse head and shoulders pattern'.

QAccording to the article, what is the critical resistance level that Bitcoin needs to close above on a daily basis to signal a strong bullish reversal?

AA daily close above $96,000 is considered a strong bullish reversal signal.

QWhat contradictory signal does the market liquidity data show despite the encouraging price action?

AThe market liquidity data shows that the buy-to-sell ratio remains relatively low and unstable, indicating the recent rally is driven more by price movement than by solid new demand, unlike the aggressive buying seen during the November crash.

QWhich macroeconomic event is highlighted as a key catalyst and potential source of volatility for Bitcoin's price?

AThe Federal Open Market Committee (FOMC) meeting is highlighted as a key macroeconomic event and potential source of volatility, with markets widely anticipating a potential 25 basis point rate cut.

QWhat does the article identify as a significant risk due to the current high leverage in the market?

AA significant risk identified is the potential for a cascade of liquidations exceeding $120 million if the price were to drop below $87,000, due to the high proportion of long positions (58%) on exchanges like Bybit and OKX.

İlgili Okumalar

İşlemler

Spot
Futures

Popüler Makaleler

OPG Nasıl Satın Alınır

HTX.com’a hoş geldiniz! OpenGradient (OPG) satın alma işlemlerini basit ve kullanışlı bir hâle getirdik. Adım adım açıkladığımız rehberimizi takip ederek kripto yolculuğunuza başlayın. 1. Adım: HTX Hesabınızı OluşturunHTX'te ücretsiz bir hesap açmak için e-posta adresinizi veya telefon numaranızı kullanın. Sorunsuzca kaydolun ve tüm özelliklerin kilidini açın. Hesabımı Aç2. Adım: Kripto Satın Al Bölümüne Gidin ve Ödeme Yönteminizi SeçinKredi/Banka Kartı: Visa veya Mastercard'ınızı kullanarak anında OpenGradient (OPG) satın alın.Bakiye: Sorunsuz bir şekilde işlem yapmak için HTX hesap bakiyenizdeki fonları kullanın.Üçüncü Taraflar: Kullanımı kolaylaştırmak için Google Pay ve Apple Pay gibi popüler ödeme yöntemlerini ekledik.P2P: HTX'teki diğer kullanıcılarla doğrudan işlem yapın.Borsa Dışı (OTC): Yatırımcılar için kişiye özel hizmetler ve rekabetçi döviz kurları sunuyoruz.3. Adım: OpenGradient (OPG) Varlıklarınızı SaklayınOpenGradient (OPG) satın aldıktan sonra HTX hesabınızda saklayın. Alternatif olarak, blok zinciri transferi yoluyla başka bir yere gönderebilir veya diğer kripto para birimlerini takas etmek için kullanabilirsiniz.4. Adım: OpenGradient (OPG) Varlıklarınızla İşlem YapınHTX'in spot piyasasında OpenGradient (OPG) ile kolayca işlemler yapın.Hesabınıza erişin, işlem çiftinizi seçin, işlemlerinizi gerçekleştirin ve gerçek zamanlı olarak izleyin. Hem yeni başlayanlar hem de deneyimli yatırımcılar için kullanıcı dostu bir deneyim sunuyoruz.

96 Toplam GörüntülenmeYayınlanma 2026.04.20Güncellenme 2026.04.20

OPG Nasıl Satın Alınır

CHIP Nasıl Satın Alınır

HTX.com’a hoş geldiniz! USD.AI (CHIP) satın alma işlemlerini basit ve kullanışlı bir hâle getirdik. Adım adım açıkladığımız rehberimizi takip ederek kripto yolculuğunuza başlayın. 1. Adım: HTX Hesabınızı OluşturunHTX'te ücretsiz bir hesap açmak için e-posta adresinizi veya telefon numaranızı kullanın. Sorunsuzca kaydolun ve tüm özelliklerin kilidini açın. Hesabımı Aç2. Adım: Kripto Satın Al Bölümüne Gidin ve Ödeme Yönteminizi SeçinKredi/Banka Kartı: Visa veya Mastercard'ınızı kullanarak anında USD.AI (CHIP) satın alın.Bakiye: Sorunsuz bir şekilde işlem yapmak için HTX hesap bakiyenizdeki fonları kullanın.Üçüncü Taraflar: Kullanımı kolaylaştırmak için Google Pay ve Apple Pay gibi popüler ödeme yöntemlerini ekledik.P2P: HTX'teki diğer kullanıcılarla doğrudan işlem yapın.Borsa Dışı (OTC): Yatırımcılar için kişiye özel hizmetler ve rekabetçi döviz kurları sunuyoruz.3. Adım: USD.AI (CHIP) Varlıklarınızı SaklayınUSD.AI (CHIP) satın aldıktan sonra HTX hesabınızda saklayın. Alternatif olarak, blok zinciri transferi yoluyla başka bir yere gönderebilir veya diğer kripto para birimlerini takas etmek için kullanabilirsiniz.4. Adım: USD.AI (CHIP) Varlıklarınızla İşlem YapınHTX'in spot piyasasında USD.AI (CHIP) ile kolayca işlemler yapın.Hesabınıza erişin, işlem çiftinizi seçin, işlemlerinizi gerçekleştirin ve gerçek zamanlı olarak izleyin. Hem yeni başlayanlar hem de deneyimli yatırımcılar için kullanıcı dostu bir deneyim sunuyoruz.

36 Toplam GörüntülenmeYayınlanma 2026.04.21Güncellenme 2026.04.21

CHIP Nasıl Satın Alınır

CC Nasıl Satın Alınır

HTX.com’a hoş geldiniz! CC(Canton) (CC) satın alma işlemlerini basit ve kullanışlı bir hâle getirdik. Adım adım açıkladığımız rehberimizi takip ederek kripto yolculuğunuza başlayın. 1. Adım: HTX Hesabınızı OluşturunHTX'te ücretsiz bir hesap açmak için e-posta adresinizi veya telefon numaranızı kullanın. Sorunsuzca kaydolun ve tüm özelliklerin kilidini açın. Hesabımı Aç2. Adım: Kripto Satın Al Bölümüne Gidin ve Ödeme Yönteminizi SeçinKredi/Banka Kartı: Visa veya Mastercard'ınızı kullanarak anında CC(Canton) (CC) satın alın.Bakiye: Sorunsuz bir şekilde işlem yapmak için HTX hesap bakiyenizdeki fonları kullanın.Üçüncü Taraflar: Kullanımı kolaylaştırmak için Google Pay ve Apple Pay gibi popüler ödeme yöntemlerini ekledik.P2P: HTX'teki diğer kullanıcılarla doğrudan işlem yapın.Borsa Dışı (OTC): Yatırımcılar için kişiye özel hizmetler ve rekabetçi döviz kurları sunuyoruz.3. Adım: CC(Canton) (CC) Varlıklarınızı SaklayınCC(Canton) (CC) satın aldıktan sonra HTX hesabınızda saklayın. Alternatif olarak, blok zinciri transferi yoluyla başka bir yere gönderebilir veya diğer kripto para birimlerini takas etmek için kullanabilirsiniz.4. Adım: CC(Canton) (CC) Varlıklarınızla İşlem YapınHTX'in spot piyasasında CC(Canton) (CC) ile kolayca işlemler yapın.Hesabınıza erişin, işlem çiftinizi seçin, işlemlerinizi gerçekleştirin ve gerçek zamanlı olarak izleyin. Hem yeni başlayanlar hem de deneyimli yatırımcılar için kullanıcı dostu bir deneyim sunuyoruz.

62 Toplam GörüntülenmeYayınlanma 2026.04.21Güncellenme 2026.04.21

CC Nasıl Satın Alınır

Tartışmalar

HTX Topluluğuna hoş geldiniz. Burada, en son platform gelişmeleri hakkında bilgi sahibi olabilir ve profesyonel piyasa görüşlerine erişebilirsiniz. Kullanıcıların A (A) fiyatı hakkındaki görüşleri aşağıda sunulmaktadır.

活动图片