In last week's report, we explicitly stated that $60,000 was an intermediate node in this correction cycle, not the bottom – a judgment directly validated by the market on June 5th: the price broke below this level, touching a low of $59,100. Thus, the monthly-level a-b-c three-wave correction structure from the October 2025 high of $126,200 has been fully established. The market is currently in the c-wave decline phase, with a total correction time of less than 35 days, indicating the structure is far from complete.
This week, we will focus on tracking the rebound height and resistance performance. The two major resistance zones at $65,000 and $69,500~$70,500 will be the core observation windows for judging subsequent trends.
Regarding HYPE, the top signal we warned about last week was also validated, with the price falling up to 27% from $75.87. This week, it has entered a stage for short-term positioning in the support zone. Strategically, we maintain a mid-term bearish outlook, awaiting opportune windows to add positions after a rebound.
Summary of Core Trading Views for This Week:
• BTC multi-timeframe structural analysis (Detailed in Part 1)
• BTC market outlook and mid/short-term trading strategies for this week (Detailed in Part 2)
• HYPE hourly chart structural analysis (Detailed in Part 3)
• HYPE market outlook and short-term trading strategy for this week (Detailed in Part 4)
Market Validation of Last Week's Trading Strategies and Core Views:
• BTC Market Outlook Validation: Last week's article pointed out: Bitcoin maintains a volatile downtrend after a weak rebound, with the short-term strategy focusing on "selling high." The current market movement validates our previous forecast.
• HYPE Market Outlook Validation: Last week's article pointed out: HYPE faces multiple resistances around $75.87, making a short-term top there highly probable. The current market movement closely aligns with our forecast.
I. Bitcoin Multi-Timeframe Structural Analysis
BTC Daily Chart Structural Analysis (Based on price action since the low on February 6, 2026)
Bitcoin _ Daily Candlestick Chart:
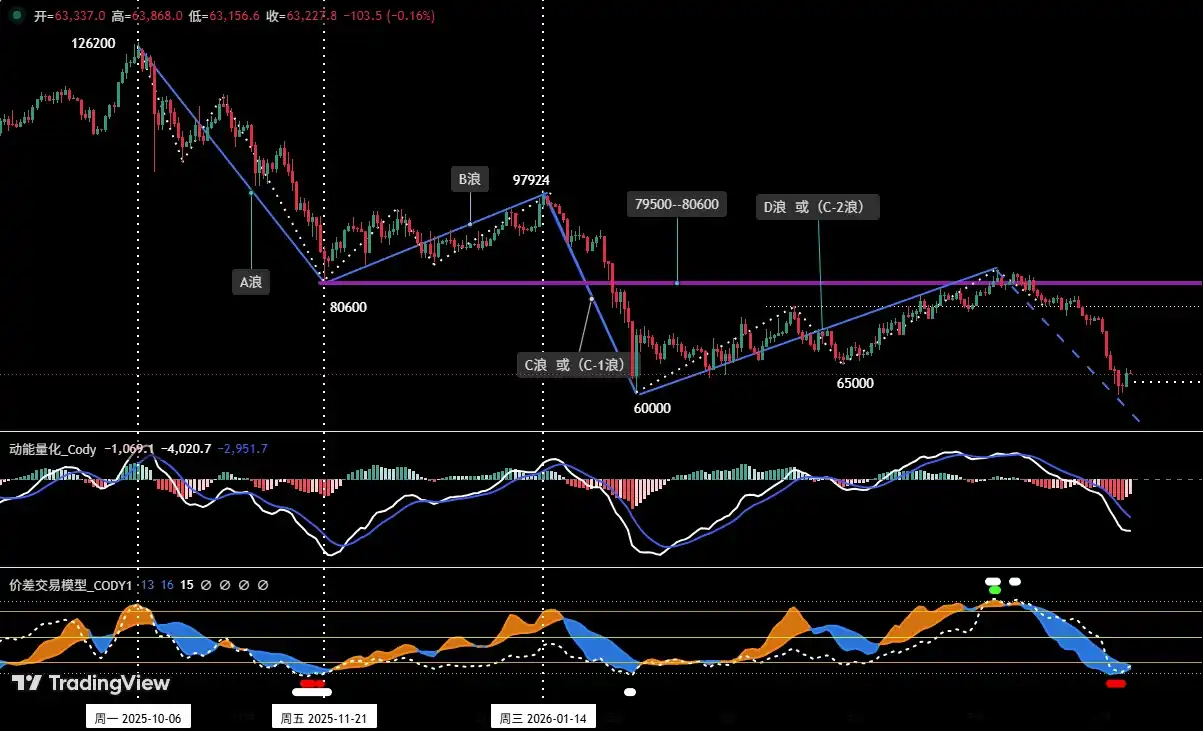
Figure 1
1. Dynamic Analysis of Bitcoin Market Structure Based on Wave Theory (Re-examination of key turning points since the October 2025 high correction)
As shown in (Figure 1), after hitting a historical high of approximately $126,200 in October 2025, the Bitcoin market entered a deep correction phase. By early February 2026, the price touched a low of $60,000 on February 6th, followed by a rebound lasting about 90 days. During this period, the market fiercely debated whether "$60,000 is the endpoint of this correction or just an intermediate low." Our analysis consistently favored the latter view, identifying it as a阶段性 low rather than the final bottom. We believed the rise starting on February 6th was a rebound within a larger corrective structure, not a trend reversal, and subsequent corrections would still break below the $60,000 level.
Following is a review of the analysis progression based on the technical framework:
1. Initial Assessment (Mid-February): Corrective rebound within C-wave (i.e., C-2 rebound wave)
In the weekly review on February 16, we explicitly stated that the rally starting from the February 6 low was, in nature, a "C-2 wave" oversold rebound within a larger "C-wave" correction. This would be followed by a "C-3 wave" correction, making a break below $60,000 highly likely.
2. Mid-term Revision (Late April): Re-classification of wave structure
In the weekly review on April 20, we noted: As the rebound extended in time and space, by April 19th, this rally had lasted about 73 days, exceeding the duration of the 54-day "B-wave" rebound significantly. Therefore, we redefined this upward movement as a larger "D-wave rebound." This would be followed by an "E-wave" correction, which would very likely break the $60,000 support.
3. Later Upgrade (Mid-May): Re-assessment of correction magnitude
In the weekly review on May 18, we emphasized again: By May 17, this rebound had lasted about 100 days, approaching the time taken for the decline from $126,200 to $60,000 (about 122 days). This led us to judge that the entire corrective pattern might have upgraded to a monthly-level correction. Consequently, we re-classified the wave structure.
4. Summary: The entire analytical process is one of dynamically tracking the evolution of market structure. Throughout, we consistently maintained that $60,000 was a significant intermediate point within the larger corrective process, not the ultimate bottom of this bear market cycle. So far, with the price breaking below the key $60,000 support on June 5th, touching lows near $59,100, the overall market movement validates our previous judgment about a breakdown below this level.
2. Wave Division Based on BTC Monthly Chart Structure
Bitcoin _ Monthly Candlestick Chart:
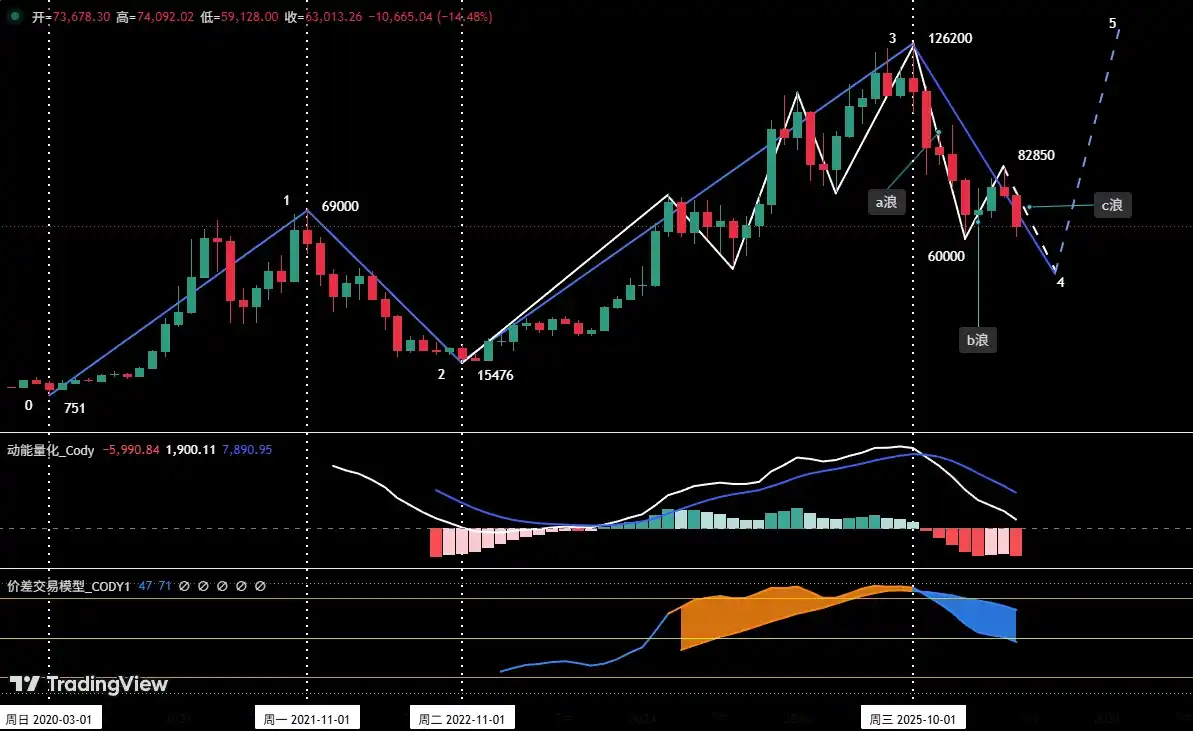
Figure 2
1. Bitcoin monthly chart shows: From January 1, 2017, to present (using this complete data segment only), the current structure can be subdivided into 4 phases:
• Phase 0-1 (Uptrend): From $751 (2017-01-01) to $69,000 (2021-11-10), lasting about 59 months (~1774 days).
• Phase 1-2 (Correction): From $69,000 (2021-11-10) to $15,476 (2022-11-21), lasting about 13 months (~376 days). Maximum drawdown about 77.57%.
• Phase 2-3 (Uptrend): From $15,476 (2022-11-21) to $126,200 (2025-10-06), lasting about 35 months (1050 days). This main uptrend wave set a new all-time high, with a maximum gain of about 715.46%.
• Phase 3-4 (Correction): From $126,200 (2025-10-06) to present, running for about 8 months (~243 days), with a maximum drawdown of 53.17%.
2. As shown in (Figure 2), the correction beginning from the previous high of $126,200 (Phase 3-4) can be preliminarily determined as a monthly-level a-b-c three-wave corrective structure. The market is currently in the c-wave decline phase.
• a-wave (Decline): $126,200 (2025-10-06) to $60,000 (2026-02-06), lasting about 4 months (~122 days), with a maximum drawdown of about 52.5%.
• b-wave (Rebound): $60,000 (2026-02-06) to $82,850 (2026-05-06), lasting 3 months (~90 days), with a maximum gain of about 38.1%.
• c-wave (Decline): $82,850 (2026-05-06) to present, running for 33 days. On June 5th, the price broke below the $60,000 support, probing lows near $59,100. This breakdown confirms the establishment of the c-wave (decline wave).
BTC Hourly Chart Structural Deep Dive (Using 4-hour as analysis周期)
Bitcoin _ 4-Hour Candlestick Chart
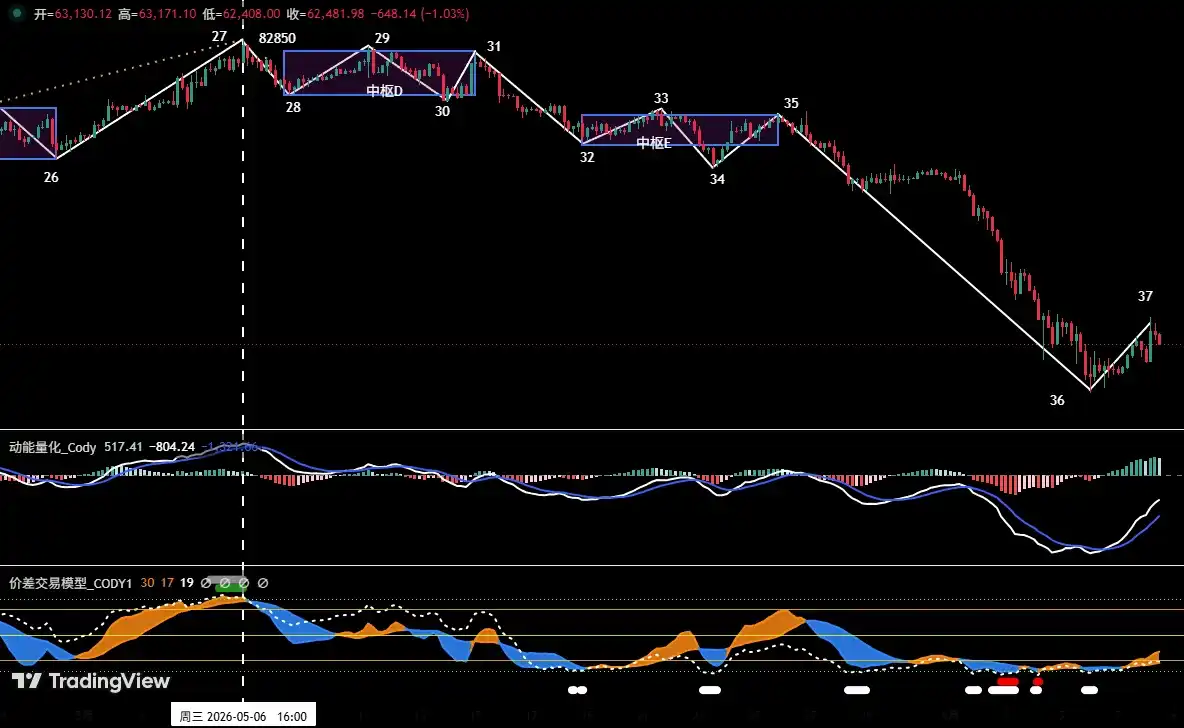
Figure 3
1. As shown in (Figure 3), the correction since the May 6th high of $82,850 can be subdivided into a 10-segment corrective structure in the 4-hour chart. It contains two declining central pivots: Pivot D and Pivot E. The overall structure is clear, presenting a typical complex correction pattern.
2. From the 4-hour structural perspective, it is currently in the 36-37 segment rebound. The first resistance above is located near $65,000; a significant resistance zone lies between $69,500~$70,500.
II. Bitcoin Current Operational Assessment
1. BTC Market Outlook for This Week:
Core Views for the Week:
• Monitor the test results of bulls and bears around the $65,000 level and the $69,500~$70,500 resistance zone.
• Also observe the support effect when the price retests the $59,000~$60,000 area.
2. Core Resistance Levels:
• First Resistance Zone: Around $65,000 (previous important low point)
• Second Resistance Zone: $69,500~$70,500 area (previous high-volume成交区)
3. Core Support Levels:
• First Support Zone: $59,000~$60,000 area (previous important support)
• Second Support Level: Around $55,000 (previous important support)
4. Trading Strategy for This Week (Excluding impact of突发 news)
1. Mid-term Strategy:
Bitcoin _ Daily Candlestick Chart (Position Monitoring Model)
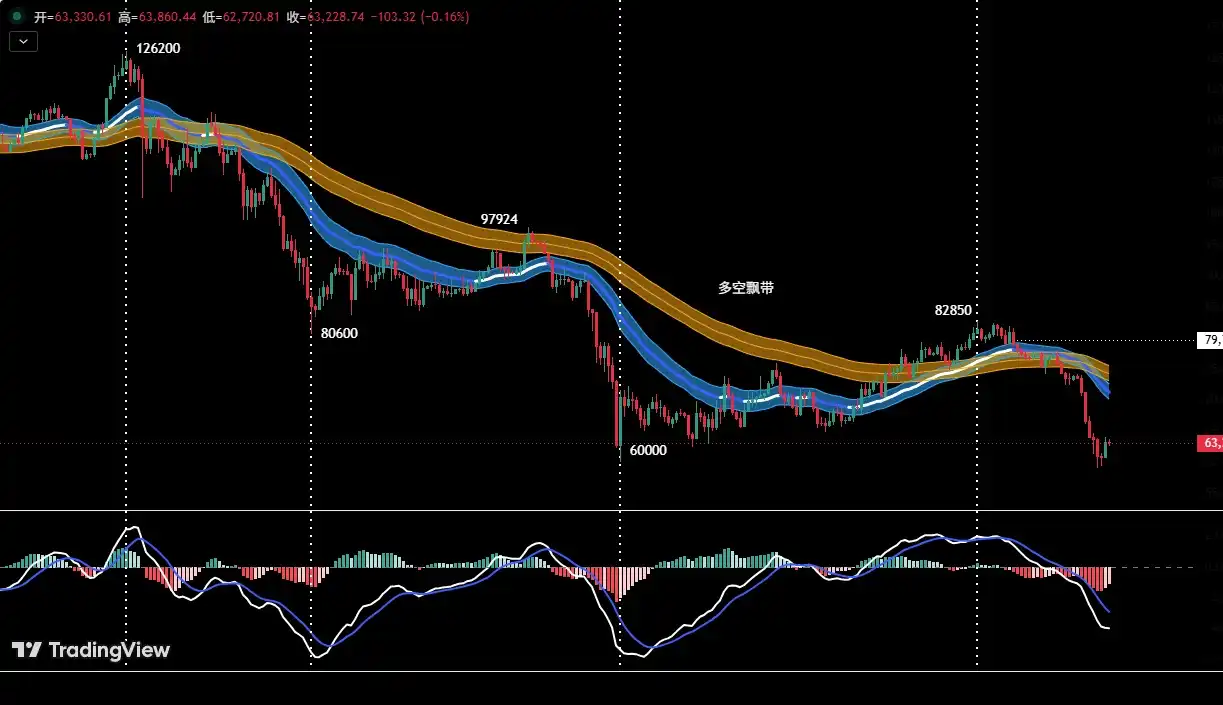
Figure 4
Position Monitoring Model: As shown in (Figure 4), the current price has effectively broken below the "Bull-Bear Channel," with technical patterns confirming a shift to a bear-dominated structure. Last week, the market showed a non-resistance unilateral sharp decline with weak intraday rebound momentum. Such market conditions do not align with our established principles for mid-term trend-following position building, hence we maintain a neutral mid-term position for observation.
If a technical rebound occurs this week, mid-term short positions can be gradually built based on the following three-tier strategy:
• Sell on Weak Rebound: If the price rebounds near $65,000 showing signs of stalling, preliminary mid-term short positions of 20% can be established.
• Add at Strong Resistance: If the price further rebounds to the $69,500~$70,500 area and shows clear承压 signs, mid-term short positions can be increased to 60%.
• Sell on Breakdown: If the rebound near $65,000 fails and the price falls back, effectively breaking below the $59,000~$60,000 support zone, short positions can be added顺势 to 60%.
2. Short-term Strategy: Utilize 30%仓位, set stop-loss points, and look for "spread" opportunities based on support and resistance levels (using 30-minute/60-minute as operational周期).
3. For short-term operations, to dynamically应对 complex market演变, we have prepared two specific operational plans, A and B.
• Plan A: Sell High on Rebound Resistance.
• Entry: If the price rebounds near $65,000 showing stalling signals, combined with quantitative model top signals, a 15% short position can be established.
• Risk Control: Set initial stop-loss.
• Exit: When the correction approaches important support levels combined with model signals, gradually close positions to take profits.
• Plan B: Add Positions at Strong Resistance Zone.
• Add Position: If the price further rebounds to the $69,500~$70,500 area showing stalling signals, combined with quantitative model top signals, short positions can be increased to 30%.
• Risk Control: Set initial stop-loss.
• Exit: When the correction approaches important support levels combined with model signals, gradually close positions to take profits.
• Plan C: Sell on Effective Breakdown of Support.
• Entry: If the rebound near $65,000 fails and the price falls back, effectively breaking below the $59,000~$60,000 support zone, combined with model top signals, short positions can be increased to 30%.
• Risk Control: Set initial stop-loss.
• Exit: When the decline reaches important support levels combined with model signals, gradually close positions to take profits.
III. HYPE Hourly Chart Structural Analysis:
HYPE_4-Hour Candlestick Chart
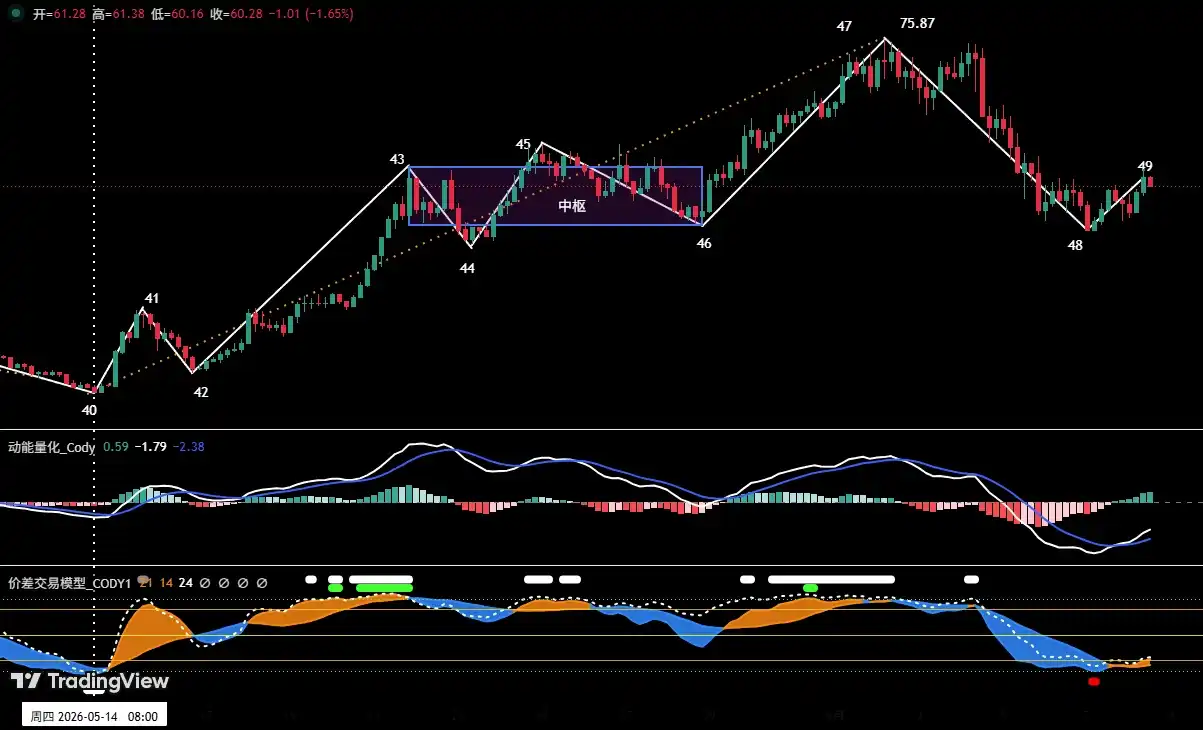
Figure 5
1. As shown in (Figure 5), on the 4-hour timeframe, HYPE has clearly constructed a seven-segment structure containing an "uptrend pivot" from the May 14th low of $38.14 to the June 2nd high of $75.87.
2. Last week's review had already提示: As "Endpoint 47" showed momentum divergence and overlapped with a top warning signal from the "Spread Trading Model," the two formed a共振. Therefore, forming a short-term high there was highly probable. Market movement confirmed this judgment: the price adjusted from "Endpoint 47" ($75.87) to "Endpoint 48" ($55.47), with a maximum decline of 26.89%.
3. Currently, HYPE price has stabilized and rebounded in the $55 support area, currently in the 48-49 rebound process. The resistance above lies in the $62.5 to $64.57 area. If the price rebounds there and falls back under pressure, it will continue searching for stronger support downwards.
IV. HYPE Market Outlook and Short-term Trading Strategy for This Week (06.08~06.14)
1. HYPE Market Outlook for This Week:
1. Core Resistance Levels:
• First Resistance Zone: $62.5 - $64.57 area;
• Second Resistance Zone: $68 - $70 area;
2. Core Support Levels:
• First Support Zone: $55 - $57 area;
• Second Support Zone: $47 - $49 area;
Core Views on HYPE for the Week:
• Observe the test results of price against resistance and support levels.
2. HYPE Short-term Trading Strategy for This Week (Buy on Support)
Short-term HYPE trading this week should adhere to the strategy of "buying low on dips, avoiding chasing rallies."
Short-term Strategy: Try long on stabilization in support zone.
When HYPE price retests the key support zones of $55-57 or the deeper $47-49 area, shows signs of stopping decline and stabilizing, and combines with bottom signals triggered by both models, consider testing a long position with light仓.仓位 must be controlled below 30%, strictly adhering to stop-loss discipline.
V. Special Notes:
1. When opening a position: Immediately set the initial stop-loss.
2. When profit reaches 1%: Move the stop-loss to the entry cost (breakeven point), ensuring principal safety.
3. When profit reaches 2%: Move the stop-loss to the 1% profit position.
4. Continuous tracking: Thereafter, for every additional 1% profit,同步移动 the stop-loss by 1%, dynamically protecting and locking in profits.
The financial markets change rapidly. All market analysis and trading strategies require dynamic adjustments. All views, analytical models, and operational strategies mentioned in this article are derived from personal technical analysis and are solely for personal trading journal purposes. They do not constitute any investment advice or operational basis. Markets involve risks; investment requires caution. Do not make decisions based solely on this content.






