Annual Revenue of Hundreds of Millions, Aggressive Buybacks: Why is Pump.fun Still Being 'Shorted' by the Market?

marsbit2026-03-19 tarihinde yayınlandı2026-03-19 tarihinde güncellendi

Özet

Despite circulating rumors, on-chain evidence and multiple independent data sources (DeFiLlama, Dune, and verifiable wallet transactions) confirm that Pump.fun's revenue and aggressive buyback program are legitimate. Over eight months, 99.5% of daily protocol revenue—totaling $328 million—was used to repurchase and burn 105.1 billion PUMP tokens, offsetting 29.52% of the circulating supply. Statistical analyses of the 747-day revenue data further validate its authenticity, showing expected patterns like weekend effects, autocorrelation, and structural breaks aligned with product updates. However, PUMP's valuation remains suppressed due to three key factors: its classification as a "sin stock" (98.6% of tokens launched on the platform are alleged scam "rug pulls"), trust issues (anonymous founders, discretionary buyback policy, and historical controversies), and insider selling pressure (notable wallets dumping tokens at market prices despite the buyback). While community token emissions will stop in July 2026—reducing monthly inflation from 10 billion to 9.2 billion tokens—current buybacks already absorb twice the new supply. The trust discount, rather than fundamentals, explains the undervaluation of a protocol generating $1.25 million in daily verifiable revenue.

Original Author: Four Pillars

Original Compilation: AididiaoJP, Foresight News

Key Points

Completed a $328 million buyback in eight months using 99.5% of daily protocol revenue. Two independent data aggregators, despite not being interconnected, reached the same conclusion. To manipulate the data, one would need to simultaneously deceive DeFiLlama, maintain a stable 68-69% ratio with Adam_tech's Dune data (which only indexes Solana), and have 105.17 billion PUMP tokens in verifiable wallets as support.

The "dilution curve" in August 2026 is actually a supply replacement rather than an addition. At current revenue levels, the buyback can absorb twice the new supply. Community emissions will cease when team and investor unlocks begin. Monthly emissions will drop from 10 billion tokens to 9.2 billion tokens.

The real reasons for the current suppressed valuation multiples are: industry classification (the nature of "original sin stocks"), trust foundation (anonymous team, discretionary buybacks), and capital flow (insiders allegedly using buybacks to sell).

1. Proof of the $328 Million Buyback

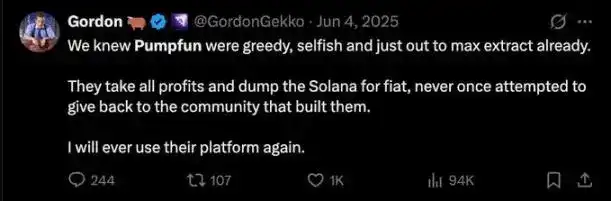
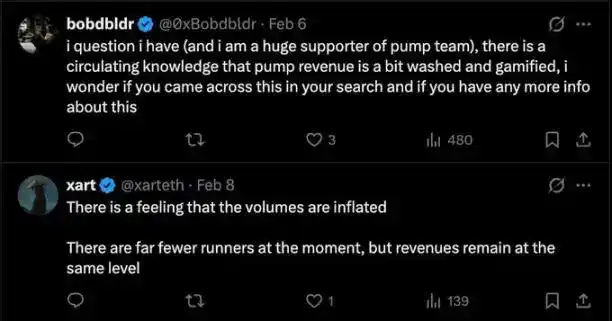
Rumors of Pump.fun's fabricated revenue have been circulating on Twitter. The following analysis shows these rumors are false.
As of March 15, 2026, data from fees.pump.fun shows a cumulative buyback amount of $328 million. This means 2,283,518 SOL was used to purchase 104.5 billion PUMP, accounting for 10.45% of the total supply and offsetting 29.52% of the circulating supply. Over eight months, the daily buyback amount remained between 99.5% and 100.5% of protocol revenue, averaging $1.25 million per day as of February 2026. Fabricating revenue would require massive capital support: for every dollar bought back, one dollar of SOL flows out from a verifiable wallet to purchase tokens stored in an auditable address. To fake $328 million in revenue, one would need to actually spend $328 million.

The relevant tokens are stored on-chain and can be verified (as of March 17, wallet G8CcfRff holds 103.96 billion PUMP, 8PSmqJy6 holds 1.21 billion PUMP, totaling 105.17 billion). The initial execution wallet 3vkpy5Y (marked as "Pump Buy Back" on Solscan) completed transfers to the holding wallets and was rotated in August 2025, now with a zero balance.

DeFiLlama recorded total protocol revenue from July 15, 2025, to February 21, 2026, as $300,041,880. During the same period, the cumulative buyback amount on fees.pump.fun was $300,178,162. The match is 100.05%, with only a $136,000 difference between two independent systems on a total of $300 million.

Adam_tech's Dune dashboard provides a third layer of verification. This platform only tracks Solana chain revenue, consistently representing 68-69% of DeFiLlama's multi-chain data, as it does not index Padre revenue launched on Base, Ethereum, and BNB Chain in October 2025. This ratio remains stable daily, indicating both are independently reading the same on-chain events.
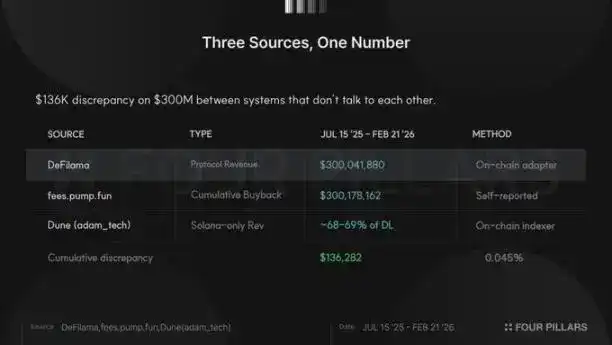
Before the launch of PumpSwap in March 2025, the error margin between the three data sources was within 1-5%. After PumpSwap launched, the data differentiated into three layers: total fees, protocol revenue, and Solana-only revenue. If someone were to fabricate revenue data, they would need to simultaneously deceive two independent on-chain indexers, maintain stable cross-correlation ratios through three product changes, keep a multi-chain revenue split ratio consistent with actual business expansion, and support it with token purchases in verifiable wallets.

2. Four Statistical Tests

In addition to on-chain evidence, 747 days of fee data can be subjected to four standard tests to verify the authenticity of the financial data. While a single test is not conclusive, when four tests point to the same conclusion, credibility increases significantly.

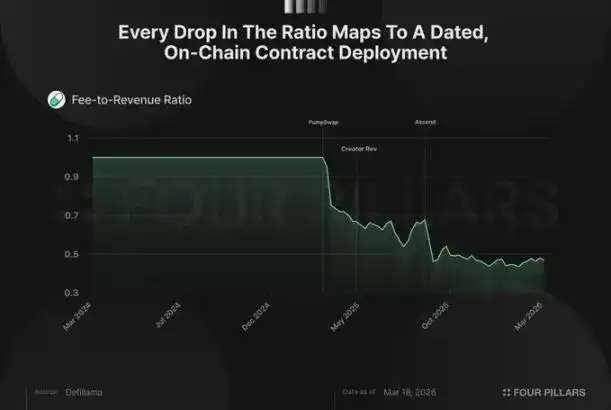
The first test is the fee-to-revenue ratio, the hardest indicator to fake. Pump.fun collects fees from each bonding curve transaction, but not all count as protocol revenue; some go to LPs, creators, and referral rewards. In the dataset, the total fee to net revenue ratio dropped from 1.0 to about 0.48, but not gradually. It dropped sharply in three stages, each corresponding to a documented on-chain product change:

  • March 20, 2025: PumpSwap launched with an LP fee split mechanism, ratio dropped from 1.00 to 0.70 in two days.
  • May 13, 2025: Creator revenue sharing mechanism launched, ratio dropped from 0.69 to 0.56.
  • September 2-3, 2025: The Ascend project introduced a dynamic fee mechanism, layered pricing allowing creators to get up to 0.95% fees on low-market-cap tokens, with the protocol keeping only 0.05%, ratio dropped from 0.68 to 0.46.

Faking this data would require simulating fee and revenue series undergoing three structural adjustments simultaneously, with the daily ratio fluctuating between 0.40 and 0.55 based on token tier composition. This complexity makes fabrication difficult. The reality is that product iterations naturally caused the changes, not artificial construction aligning with contract deployment times.
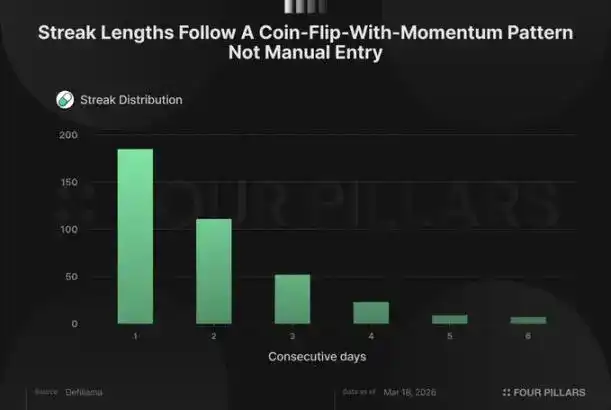
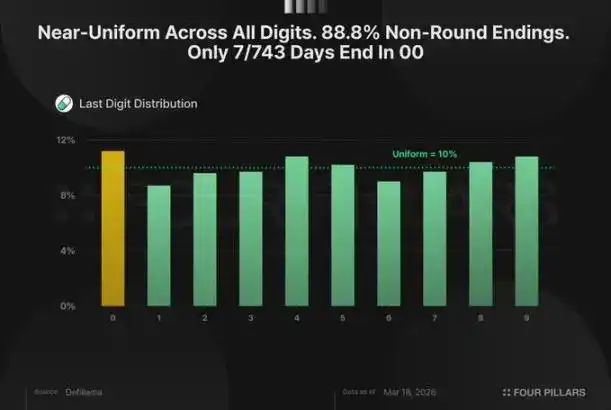
The second test examines continuity and digit distribution, aiming to determine if the data shows signs of manual entry. Humans struggle to generate truly random sequences, tend to avoid long streaks, prefer integers, and have unconscious biases toward specific digits. Pump.fun data lacks these characteristics:

The longest consecutive rise or fall is 6 days, with an average streak length of 1.92 days, consistent with expectations for a natural process with moderate momentum. Streak length decreases geometrically: 185 one-day streaks, 111 two-day streaks, 52 three-day streaks, down to 7 six-day streaks.

The last digit of daily fees is nearly uniformly distributed between 0-9, with each digit accounting for 8.7%-11.2%. 88.8% of days do not end with an integer; only 7 out of 743 non-zero days end with 00 or 000.
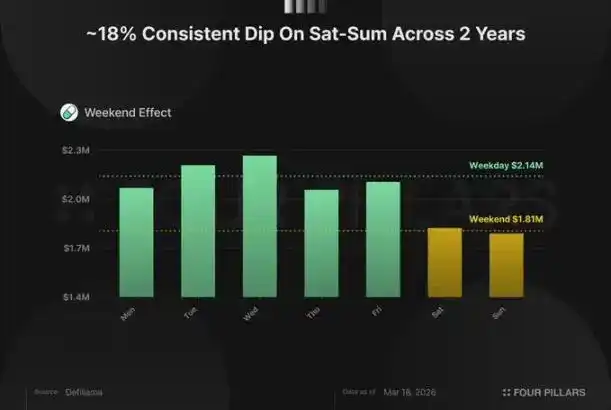
The third test examines the weekend effect. Pump.fun is a retail platform; users issue tokens more on weekdays than weekends. Average daily fees are $2.14 million on weekdays and $1.81 million on weekends, a consistent ~18% drop, appearing week after week in the two-year data. A Mann-Whitney test shows a p-value of 0.003, statistically significant. If data were fabricated, one would need to deliberately keep weekends consistently lower, increasing the complexity and risk of detection.
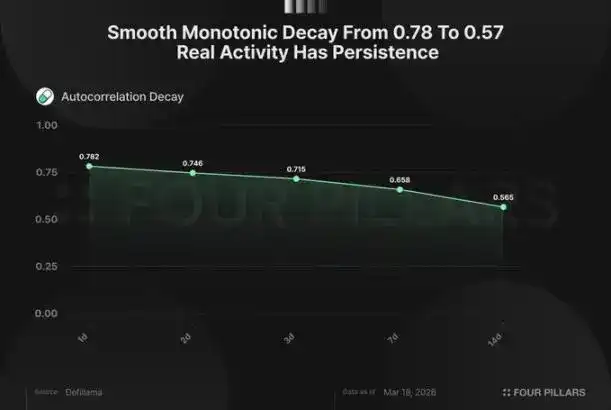
The final test examines autocorrelation, measuring the relationship between today's revenue and tomorrow's. Pump.fun's first-order lag autocorrelation is 0.78, meaning today's fees are 78% correlated with yesterday's; it remains 0.65 after one week (lag 7 days); and 0.57 after two weeks (lag 14 days). This slow, smooth decay reflects the momentum characteristic of organic platform activity: active periods cluster, and downturns persist. If daily revenue were generated randomly, correlation between adjacent days would be near zero, and the data would jump like noise rather than flow like a market. Faking high autocorrelation for a single lag is not difficult, but faking the entire decay structure (monotonically decreasing step by step for each lag), while maintaining the weekend effect, streak characteristics, and realistic digit distribution, is nearly impossible.
Four independent tests, four consistent conclusions, three data sources corroborating each other. The revenue data is authentic and reliable.

3. Analysis of Remaining Valuation Discount Factors

Rumors of fabricated revenue are one reason for PUMP's current suppressed valuation. The previous analysis has clarified this. But the token still trades at a discount; other suppressing factors and their validity need exploration.

First, analyze the August team unlock. Community emissions are 10 billion tokens monthly, will reach 240 billion tokens by July and then stop, coinciding with the start of team and investor unlocks, totaling 9.2 billion tokens monthly. Monthly emissions will drop from 10 billion to 9.2 billion tokens, an 8% decrease in inflation rate. At the current average daily revenue of $1.25 million, the monthly average buyback is $38 million. At a price of $0.0021 per token, this can absorb about twice the $19 million worth of new monthly supply. After August, emissions decrease while buybacks continue, further improving this ratio.

Revenue shows no sign of decline either. Over fourteen months, monthly average fees fluctuated between $2.3 million and $4.8 million daily: down 49% in July 2025, rebounded 94% in August, surged 72% in September, and jumped 45% in January 2026. Overall, it mean-reverts around a daily average of $2.5-3 million, with weekly trading volume stable at $640-700 million. The so-called "Q3 to Q1 decline" is a one-sided conclusion drawn by selectively picking September peak data.

The remaining suppressing factors are as follows:

The "original sin stock" discount is the most persistent. Solidus Labs found that 98.6% of tokens on the platform have "rug pull" characteristics. This finding had the intended effect: regardless of revenue, institutional allocators will not include a "meme coin casino" in their portfolios. This is a persistent structural factor, completely unrelated to revenue quality.
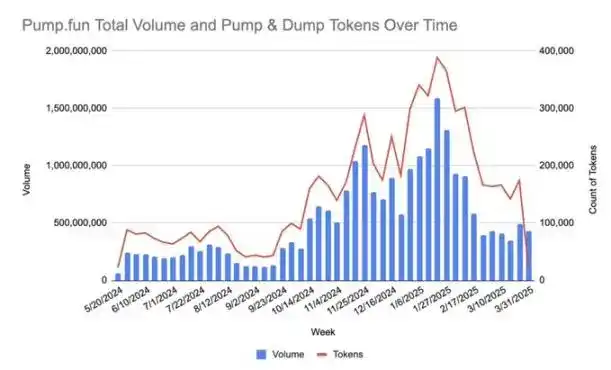
Source: Solidus Labs
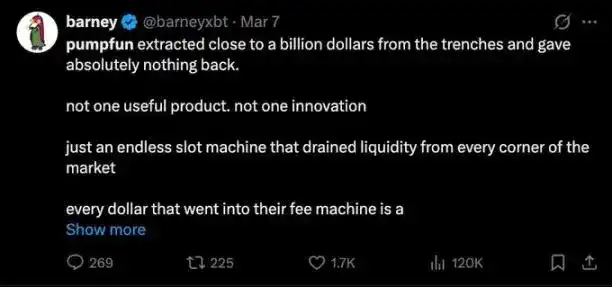

Alleged insider selling constitutes tangible recent pressure. Wallet 77DsB received 3.75 billion PUMP in July 2025 from an address marked "Token Custody Wallet" on Solscan, allegedly liquidated its position for 8.02 million USDC between February 16 and 22, 2026. Wallet GpCfm transferred 1.21 billion PUMP ($2.57 million) to Bitget during the same period. A third wallet deposited 1.757 billion PUMP ($3.54 million) into Bitget on March 6. Although no source confirms actual ownership, at least $14 million flowed to exchanges at a market price of $0.002 within thirty days while the protocol was buying back, compared to a private round price of $0.004. This situation raises questions, regardless of the wallet owners' identities.

The trust aspect is the hardest to price. The founders are anonymous (co-founder Dylan has a "rug pull" record from 2017); buybacks are explicitly "discretionary" ("pump.fun may modify or中止 the plan at any time"); Bubblemaps once alleged Hayden Davis was associated with a $50 million private placement, but later deleted the claim after co-founder Alon called it "defamation." On-chain associations exist, but attribution is disputed and unverified.

None of these factors relate to business fundamentals. The revenue is real, supported by data, and the unlock arrangement is favorable to holders. The "original sin stock" label, anonymous founders, and insider fund flows are all trust discounts applied to a protocol with $1.25 million in daily verifiable on-chain revenue, whose buybacks can absorb twice the new supply. The trust discount will eventually narrow; revenue of this scale will not be mispriced forever.


İlgili Sorular

QWhat evidence supports the claim that Pump.fun's $328 million in buybacks and revenue are real and not fabricated?

AMultiple independent data sources (DeFiLlama, fees.pump.fun, and Adam_tech's Dune dashboard) align, showing a 100.05% match on $300 million in total revenue and buybacks. The buybacks are verifiable on-chain, with 105.17 billion PUMP tokens held in public wallets. The data also passes statistical tests for authenticity, including fee-to-revenue ratio changes corresponding to product updates, natural number distribution, a consistent weekend effect, and realistic autocorrelation patterns, making a coordinated fraud across all these metrics highly improbable.

QHow does the upcoming 'dilution curve' in August 2026 affect PUMP token supply and inflation?

AThe community emissions of 10 billion tokens per month will cease upon the start of team and investor token unlocks in August 2026. The new combined monthly issuance from unlocks will be 9.2 billion tokens. This represents an 8% reduction in the monthly inflation rate, from 10 billion to 9.2 billion tokens. Furthermore, at current revenue levels, the protocol's buybacks are sufficient to absorb twice the amount of new supply being created.

QWhat are the key factors cited as the real reasons for PUMP's discounted valuation, despite its high revenue?

AThe three main factors suppressing PUMP valuation are: 1. The 'sin stock' discount, as the platform is associated with meme coins and rug pulls, deterring institutional investment. 2. Trust issues stemming from an anonymous founding team, a discretionary buyback policy that can be changed, and past controversies. 3. Insider selling pressure, with significant amounts of tokens from early wallets being sold on exchanges concurrently with the protocol's buyback program.

QWhat statistical tests were performed on the revenue data, and what did they conclude?

AFour statistical tests were performed: 1. Fee-to-Revenue Ratio Test: Showed structural breaks that perfectly matched three specific product updates, a pattern too complex to fake. 2. Continuity and Digit Distribution Test: Found natural sequences and a near-uniform distribution of ending digits, lacking human manipulation patterns. 3. Weekend Effect Test: Confirmed a statistically significant 18% drop in revenue on weekends, consistent with user behavior. 4. Autocorrelation Test: Revealed a high and smoothly decaying correlation between daily revenues, indicating organic market momentum. All tests concluded the data is authentic.

QHow does the protocol's current buyback capacity compare to the new token supply being emitted?

AAt the daily revenue rate of $1.25 million, the protocol generates approximately $38 million monthly for buybacks. At the current price of $0.0021 per PUMP, this allows it to buy back roughly 18 billion tokens per month. This buyback power is double the current monthly community emission of 9.2 billion tokens, meaning the buyback absorbs twice the new supply being created. This ratio is expected to improve further after August 2026 when emissions decrease.

İlgili Okumalar

The Changing Landscape: What Are Crypto VCs Experiencing?

Title: The Shifting Landscape of Crypto Venture Capital The era of dedicated crypto venture capital funds is undergoing a significant transformation. Once essential for navigating the sector's complexity and high risk, these specialized funds are now facing an identity crisis as the market matures. This shift mirrors historical patterns in other specialized investment classes like cleantech and SPACs, where initial information advantages dissipate as technologies become mainstream and integrated into existing industry frameworks. The article argues that crypto is reaching a critical inflection point, transitioning from a "building phase" to an "integration phase." Major players like Stripe, BlackRock, and Visa now engage with crypto not for its novel mechanics but as a foundational financial infrastructure. Their needs—regulatory compliance, banking partnerships, distribution channels—align with traditional fintech, a domain easily understood by large, generalist funds like Sequoia and Founders Fund. This evolution creates a "barbell effect" within the VC landscape. On one end are massive, diversified platforms that can incorporate crypto as one vertical among many. On the other are small, nimble funds focused on niche, experimental projects. The middle ground—medium-sized dedicated crypto funds—is being squeezed out. Their typical fund size makes it impossible to generate sufficient returns solely from early-stage crypto bets, yet they cannot compete with giants for later-stage deals. Consequently, leading crypto-native firms like Paradigm and Framework Ventures are expanding into AI, robotics, and other sectors, driven partly by LP pressure for better returns amid a broader VC DPI crisis. Others, like Dragonfly and a16z, have narrowed their crypto focus predominantly to financial infrastructure like stablecoins, reframing the sector's core narrative. For crypto entrepreneurs, this consolidation presents challenges. While generalist funds offer larger checks and broader resources, crypto projects now compete fiercely with AI for attention and capital within these firms. Furthermore, the long-term, non-commercial foundational work that built the ecosystem—funded by dedicated crypto VCs—is less likely to attract generalist capital focused on direct returns. The conclusion is that "crypto investor" as a standalone category is becoming obsolete, akin to "internet investor." Crypto is becoming a baseline infrastructure layer. The future will see a barbell structure: large-scale growth financing handled by generalist funds, while pioneering, speculative projects are funded by small, specialized vehicles. The dedicated crypto funds of the 2017-2021 boom, which incubated core infrastructure, are giving way to this new, bifurcated reality.

Foresight News8 dk önce

The Changing Landscape: What Are Crypto VCs Experiencing?

Foresight News8 dk önce

As Consensus Accelerates, What Are Young Investors Betting On?

Title: As Consensus Forms Faster, What Are Young Investors Betting On? In the rapid evolution of tech investment, a new generation of young investors is navigating a landscape where AI, robotics, commercial aerospace, and quantum computing are advancing simultaneously. Traditional investment logic based on financial models is giving way to a need for deep technical understanding and the ability to act before industry consensus forms. An analysis of trends from the "WAIC FUTURE TECH" list of young investment leaders reveals key shifts in focus. The first major trend is the movement of AI from the digital screen into the physical world. Investment is shifting from large language models and chatbots towards embodied AI, robotics, AI hardware, and edge computing. While demonstrations generate excitement, the real challenge lies in achieving scalable, reliable, and cost-effective delivery in complex real-world environments like factories and logistics. Success depends not just on algorithms but on the integration of sensors, actuators, and control systems. Second, the competitive focus for large models is moving beyond raw capability toward building an "intelligence flywheel." The goal is to create self-reinforcing systems where user interaction generates data, improving the model, which in turn enhances the user experience and attracts more engagement. Companies that successfully embed AI into workflows to create these closed-loop systems can build lasting value that isn't easily erased by the next model upgrade. Third, facing a potential bottleneck in high-quality human-generated data, investors are looking at new underlying technologies. Reinforcement learning and self-play, as demonstrated by AlphaGo Zero, offer paths for AI to generate its own experience. Scientific foundation models, which aim to build general AI capabilities for fields like life sciences and materials discovery, represent a non-consensus direction that could unlock new frontiers of knowledge and data. Finally, in deep-tech areas like quantum computing, commercial aerospace, and space-based infrastructure, patient capital is essential. These fields have long, uncertain development and validation cycles involving complex engineering, supply chains, and regulations. Investment here requires a long-term view, focusing on foundational team capabilities and the eventual emergence of market demand, even if commercial returns are distant. Collectively, these trends illustrate how young investors are adapting to a new era. They are learning to make earlier, technically-informed judgments, balance hype with real-world viability, and provide the patient capital needed to build the deep-tech foundations of the future.

marsbit36 dk önce

As Consensus Accelerates, What Are Young Investors Betting On?

marsbit36 dk önce

Can Japan Buy Growth with AI? Will the Bond Market Believe It?

Japan's cabinet has introduced the 2026 Basic Policy on Economic and Fiscal Management and Reform, shifting its primary fiscal target. The new framework moves away from the traditional annual primary balance goal and instead prioritizes a stable reduction of the debt-to-GDP ratio. This change is tied to a strategy of increased "responsible proactive fiscal" spending, aiming to boost long-term growth through investments in strategic sectors like AI, semiconductors, energy, and robotics. The government estimates total public and private investment in 62 key technologies could exceed 370 trillion yen by 2040. The market reaction has been mixed and cautious. While equity markets may respond to policy signals, bond markets are focused on fiscal credibility. Concerns center on whether the weakening of the clear primary balance anchor could lead to looser fiscal discipline. If investors doubt that these strategic investments will generate sufficient productivity gains, tax revenue, and nominal growth to outpace rising interest costs, they may demand higher yields on Japanese Government Bonds (JGBs). Recent volatility in the yen and JGB yields, with the 10-year yield briefly reaching 2.9%, reflects this skepticism. The success of this new framework hinges on two factors: whether Japan can achieve a nominal growth rate consistently higher than its long-term interest rates, and whether future budgets demonstrate disciplined control over bond issuance. The government's narrative is that strategic investment is essential to break Japan's cycle of low growth, aging, and labor shortages. However, the bond market will continuously assess the credibility of this plan, pricing the risk that it may represent fiscal expansion rather than a viable growth strategy.

marsbit1 saat önce

Can Japan Buy Growth with AI? Will the Bond Market Believe It?

marsbit1 saat önce

İşlemler

Spot
活动图片