Analyzing 10 Major BTC Top Indicators: Why Is the Current Bull Market Different from Previous Ones?

marsbit2025-12-22 tarihinde yayınlandı2025-12-22 tarihinde güncellendi

Özet

This analysis examines 10 classic Bitcoin top indicators to assess why the current bull market (as of Q4 2025) differs from previous cycles. Key metrics like the Pi Cycle Top Indicator, Puell Multiple, Bitcoin Rainbow Chart, 2-Year MA Multiplier, 4-Year Moving Average, MVRV Z-Score, Altcoin Season Index, Long-Term Holder (LTH) Supply, Short-Term Holder (STH) Supply, and Net Unrealized Profit/Loss (NUPL) all show subdued or neutral readings compared to historical extremes observed at past market tops (e.g., 2017 and 2021). Unlike previous cycles, these indicators suggest a lack of typical overheating signals, such as extreme miner profitability, excessive valuation deviations, or rampant altcoin speculation. The price peak on October 6, 2025, did not align with classic top patterns, indicating structural shift in Bitcoin’s market behavior. This moderation may stem from increased institutional participation via Bitcoin ETFs, which has stabilized supply dynamics, as well as broader macroeconomic factors like global liquidity changes and geopolitical events. The declining peak values of indicators like MVRV (from 10 in 2017 to ~3 in 2025) suggest Bitcoin is maturing from a cyclical asset to a mainstream reserve, reducing volatility and extending cycles. Investors may need to adapt traditional indicators with adjusted thresholds or combined metrics for future decision-making.

In previous Bitcoin bull market cycles, the price peak has often been accompanied by signs of overheating. However, this bull market appears to have undergone some significant changes—many historically reliable indicators have been slow to signal a top, and the Bitcoin price has been in a sustained downtrend since hitting a new high on October 6, further driving bearish signals across multiple metrics.

Below, we will examine 10 classic indicators, evaluate their characteristics and limitations, and outline the underlying shifts within Bitcoin and the broader crypto market.

1. Pi Cycle Top Indicator: Has the Cycle Peak Been Reached?

The Pi Cycle indicator is a classic tool for identifying Bitcoin price tops using the 111-day moving average (111DMA) and twice the 350-day moving average (350DMA x 2).

Typically, when the short-term line crosses above the long-term line, it often signals a market top, as it indicates that prices are rising too rapidly, detached from fundamental support.

Historically, the Pi Cycle Top Indicator has shown crossover behavior before each bull market peak:

2017 peak: 111DMA crossed above 350DMA x 2, marking the subsequent bubble burst;

2021 double top: A similar crossover occurred before the first top, followed by a rapid market correction;

Currently (Q4 2025), as shown in the chart below, the two lines have not yet crossed.
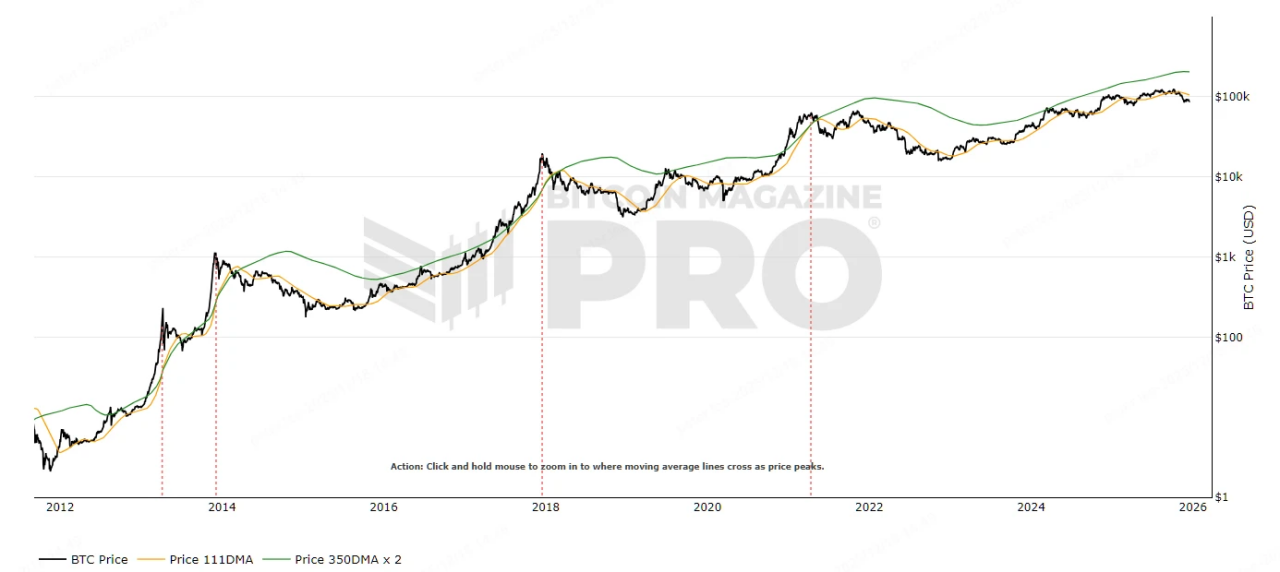
Source: https://www.bitcoinmagazinepro.com/charts/pi-cycle-top-indicator

2. Puell Multiple: Are Miner Profits Excessive?

The Puell Multiple measures the ratio of miners' daily revenue to its 365-day moving average, used to assess miner profitability and market cycles.

Its principle is based on miner behavior: when the ratio is too high, miners are highly profitable and may increase selling pressure, forming a top; when too low, it indicates miner capitulation, signaling a bottom. In other words, a high Puell Multiple reflects that "miners are making too much money," accumulating supply pressure.

Historically, the Puell Multiple has shown extreme spikes before each bull market peak:

2017 peak: Exceeded 7, a historical high;

2021 double top: Exceeded 3, followed by a crash;

Currently (Q4 2025), the Puell Multiple is in the 1~2 range, indicating moderate miner pressure.
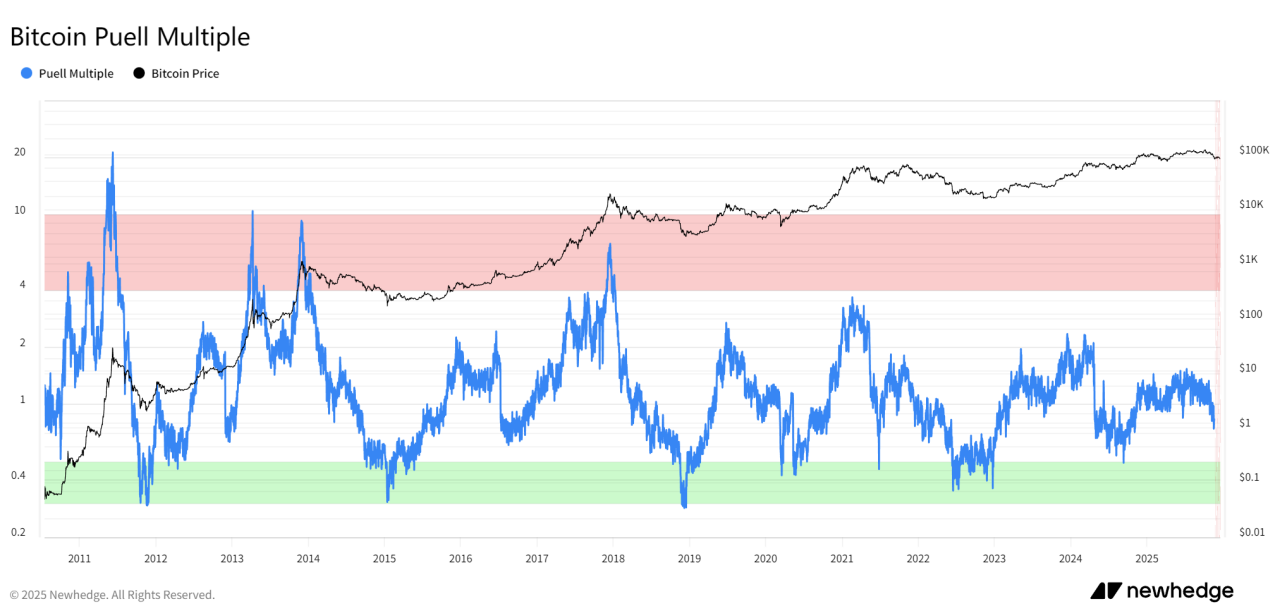
Source: https://newhedge.io/bitcoin/puell-multiple

3. Bitcoin Rainbow Chart: Has the Price Entered the "Sell" Zone?

The Bitcoin Rainbow Chart uses logarithmic growth curves overlaid with rainbow-colored bands to assess Bitcoin's long-term valuation levels.

Its principle maps prices to color bands: blue zones indicate undervaluation (buy), red zones indicate overvaluation (sell). The bands are based on historical growth curves, helping to identify extreme market sentiment.

Historically, the Bitcoin Rainbow Chart has entered the red zone before each bull market peak:

2017 peak: Deep red zone, bubble peak;

2021 double top: Orange-red zone, followed by a correction;

Currently (Q4 2025), the price is in the yellow to orange range, not yet reaching the red bubble zone. We have also seen many analysts adjust this indicator, but regardless of adjustments, the price has indeed not reached the red bubble zone based on past historical experience.
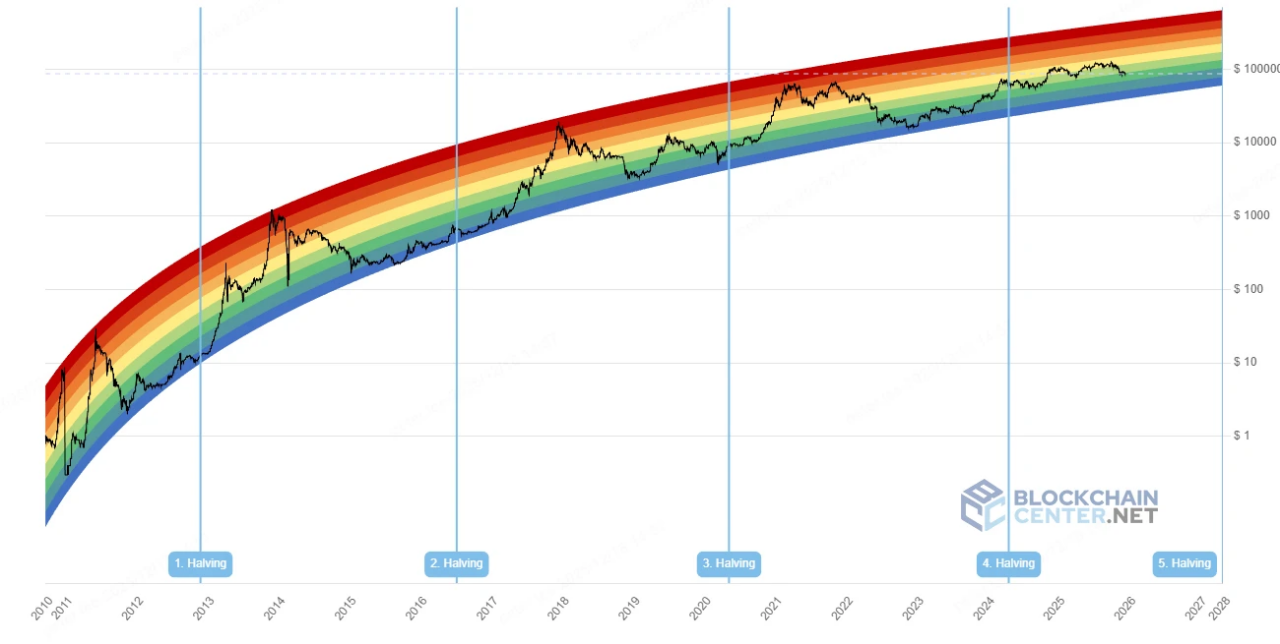
Source: https://www.blockchaincenter.net/en/bitcoin-rainbow-chart/

4. 2-Year MA Multiplier: Has the Multiple Peaked?

The 2-Year MA Multiplier (also known as the Golden Ratio Multiplier) uses the 2-year moving average multiplied by Fibonacci ratios to identify price zones of resistance.

Its principle combines the golden ratio (1.6) and Fibonacci sequences to assess the multiple of price relative to the long-term average: high multiples indicate overheating, signaling a correction. In other words, high multiples mean the price has "deviated too far from the long-term trend," accumulating risk.

Historically, the 2-Year MA Multiplier has shown extreme multiples before each bull market peak:

2017 peak: The indicator differed from the price by up to 10 times, with the top occurring one month after the price crossed above 2 Yr MA *5;

2021 double top: Exceeded 5 times, with the price just touching 2 Yr MA *5 before the first top;

Currently (Q4 2025), the multiple is in the 2~3 range, not yet entering the high multiple zone.
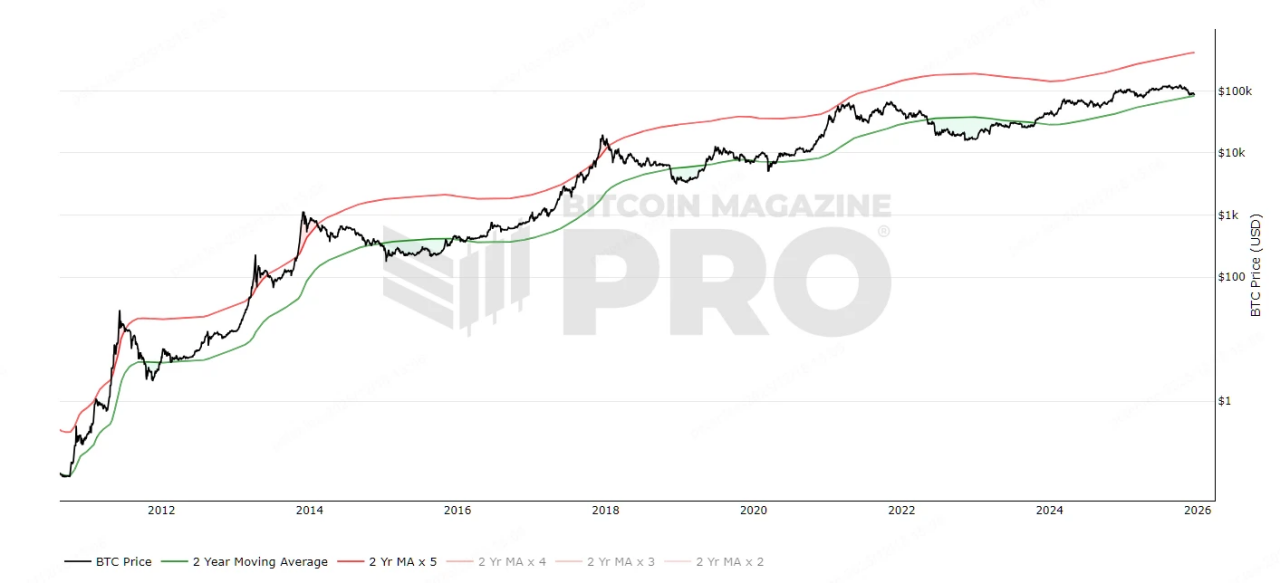
Source: https://www.bitcoinmagazinepro.com/charts/bitcoin-investor-tool/

5. Bitcoin 4-Year Moving Average: Is the Price Far Above the Long-Term Average?

The Bitcoin 4-Year Moving Average calculates the 4-year price average to assess Bitcoin's macro trend.

Its principle smooths out cyclical fluctuations: prices far above the average indicate overheating; prices near the average indicate equilibrium. In other words, excessive deviation implies a "cyclical bubble," accumulating risk.

Historically, the Bitcoin 4-Year Moving Average has shown extreme price deviations before each bull market peak:

2017 peak: The indicator reached 16;

2021 double top: Reached 6 at the first top, followed by a crash;

Currently (Q4 2025), the price peaked at 2.3, showing a decreasing peak trend.
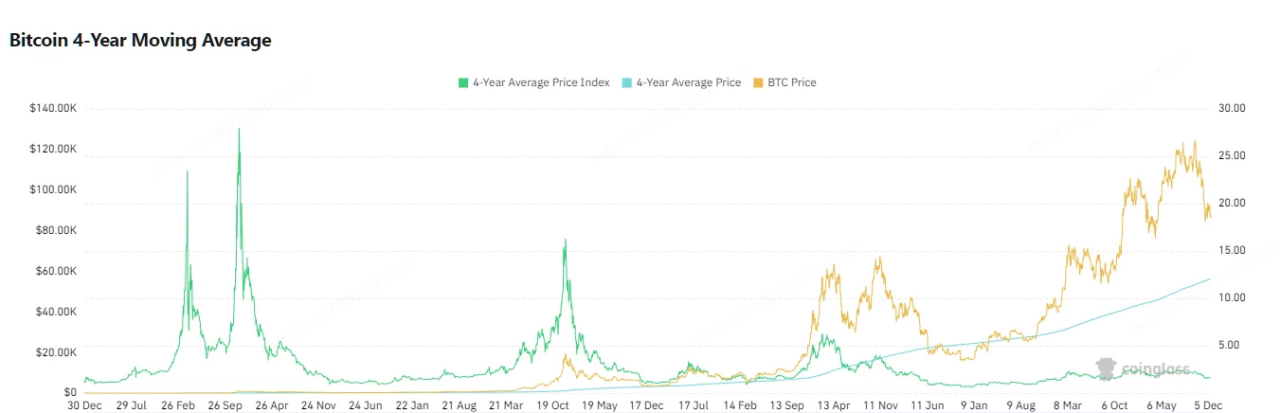
Source: https://www.coinglass.com/pro/i/four-year-moving-average

6. Bitcoin MVRV Z-Score: Has Valuation Entered the Risk Zone?

The MVRV Z-Score is a classic on-chain indicator for assessing whether Bitcoin's valuation has "deviated from its true value."

Its principle compares Bitcoin's current market cap to its "realized cap" (the total cost basis of all coins) and calculates the standard deviation of this difference. In other words: a higher Z-Score means most holders are in profit, the market is "making too much money," and risk is accumulating.

Historically, the MVRV Z-Score has shown extreme spikes before each bull market peak:

2017 peak: Approached 10, a historical extreme;

2021 double top: Exceeded 7 at the first top, followed by a market crash;

Currently (Q4 2025), the Z-Score is in the 2~4 range, indicating neutral valuation.
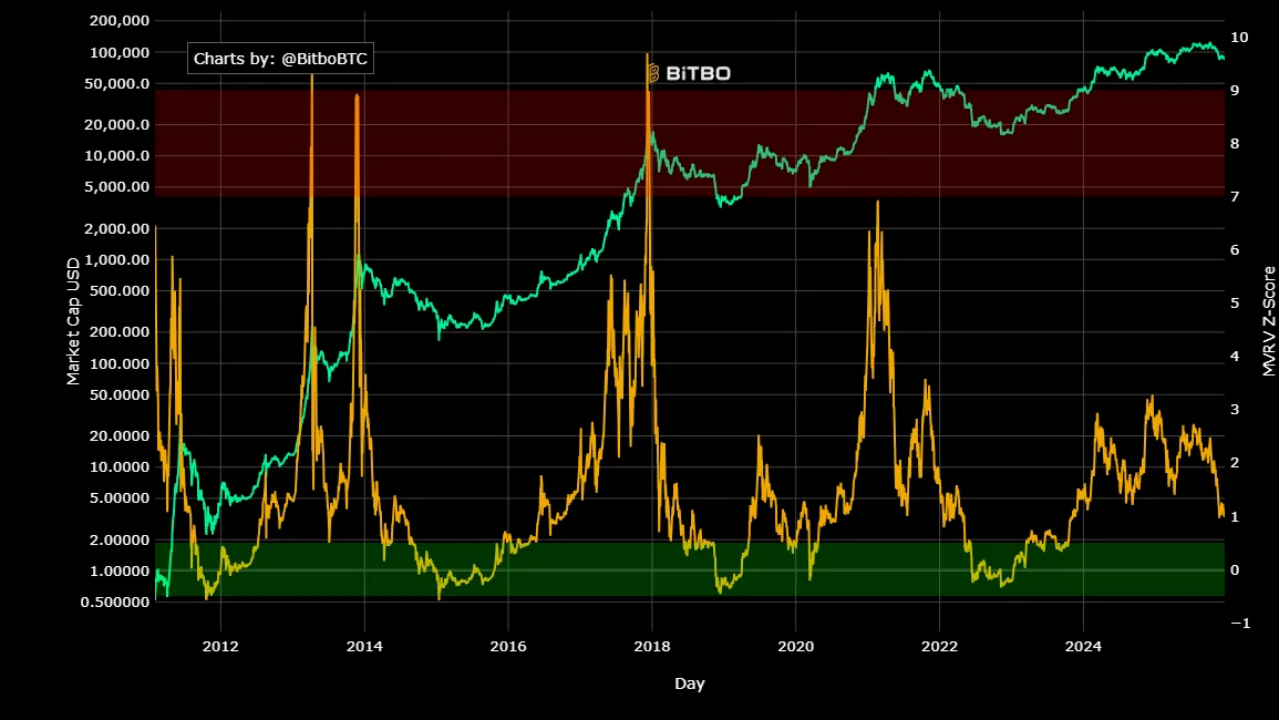
Source: https://charts.bitbo.io/mvrv-z-score

It is worth mentioning that the MVRV Rate adds statistical analysis to MVRV, measuring the standard deviation between the current MVRV and its historical average. This standardization helps identify when Bitcoin is trading above or below "fair value." However, as shown below, the peak values of this metric at each bull market top have shown a decreasing trend, and even diverged from the price peaks, greatly increasing the difficulty of using this indicator to predict tops.
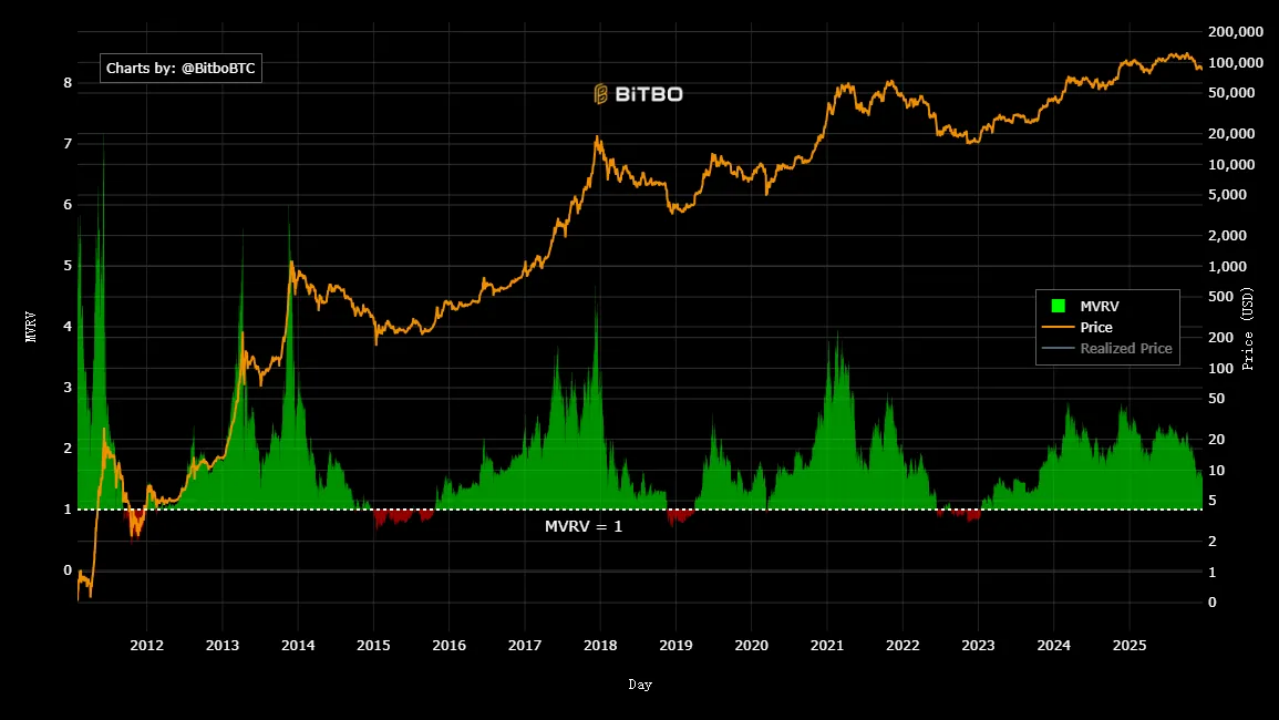
Source: https://charts.bitbo.io/mvrv

7. Altcoin Season Index: Has Altcoin Season Started?

The Altcoin Season Index tracks the performance of the top 100 altcoins relative to Bitcoin to assess whether an "alt season" has begun.

Its principle is based on relative performance: an index above 75 indicates the start of alt season, often occurring after a BTC top, as funds flow from BTC to alts. In other words, a high index means BTC dominance is weakening, and market risk is diversifying.

Historically, each bull market peak has ended with an alt season狂欢 as a closing signal:

2017 peak: Exceeded 90, alt season爆发;

2021 double top: Exceeded 80, followed by BTC correction;

Currently (Q4 2025), the index is in the 30~40 range, with the altcoin sector performing poorly. In fact, since the start of this BTC bull run, the index has not even reached 60, possibly due to insufficient liquidity and an oversupply of new coins.
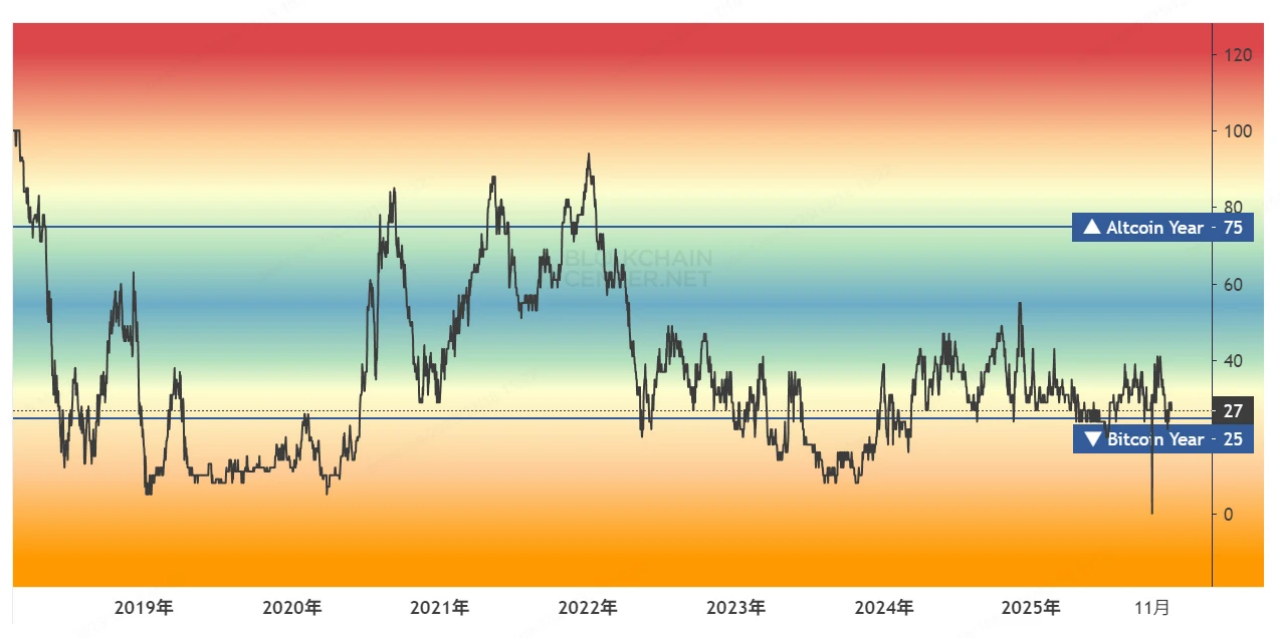
Source: https://www.blockchaincenter.net/en/altcoin-season-index

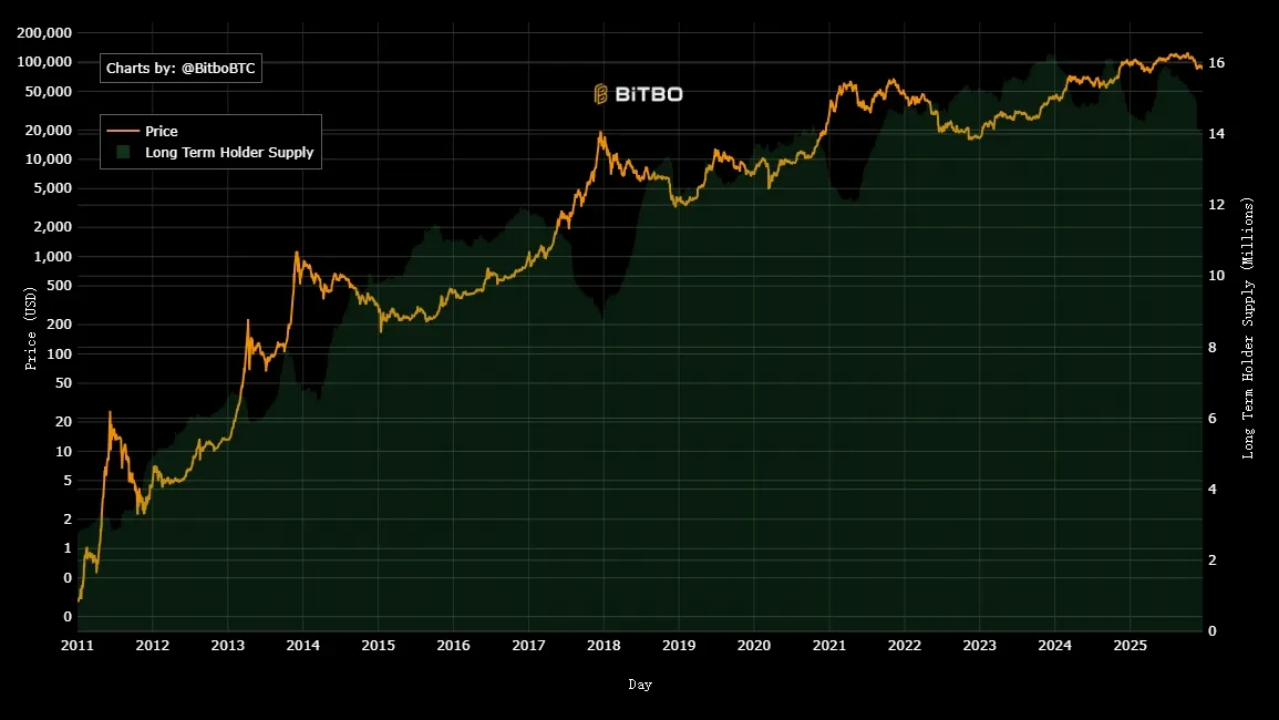
8. Bitcoin Long Term Holder Supply (LTH): Is Long-Term Holder Supply Decreasing?

Bitcoin Long Term Holder Supply (LTH) tracks the supply of Bitcoin held for more than 155 days, reflecting HODLer behavior.

Its principle observes supply changes: at tops, LTHs often sell to realize profits; at bottoms, they accumulate. In other words, a decrease in LTH supply means "smart money" is exiting, indicating high risk.

Historically, LTH has shown significant decreases before each bull market peak:

2017 peak: The selling period lasted a year, peaking at the top;

2021 double top: The first top followed a sustained selling trend for half a year, but the accumulation at the second top reached a historical high;

Currently (Q4 2025), slow selling has been ongoing for half a year, but the October top does not align with historical patterns.
Source: https://charts.bitbo.io/long-term-holder-supply

9. Bitcoin Short Term Holder Supply (STH): Is Short-Term Holder Supply Surging?

Bitcoin Short Term Holder Supply (STH) tracks the proportion of Bitcoin held for less than 155 days, assessing novice speculation.

Its principle captures new capital inflows: a high proportion indicates rampant speculation, often预示 a top; a low proportion indicates market maturity. In other words, high STH means "too many newcomers," making bubbles prone to burst.

Historically, STH has shown surges before each bull market peak:

2017 peak: Nearly 8M BTC, speculation peak;

2021 double top: Nearly 6.5M BTC at the first top, with the absolute peak selling at the second top not reaching the highest level;

Currently, STH is steadily climbing接近 5.5M BTC, but the price peak was on October 6,不像 past bull markets where STH peaks and price tops were closely aligned.

Source: https://newhedge.io/bitcoin/short-term-holder-supply

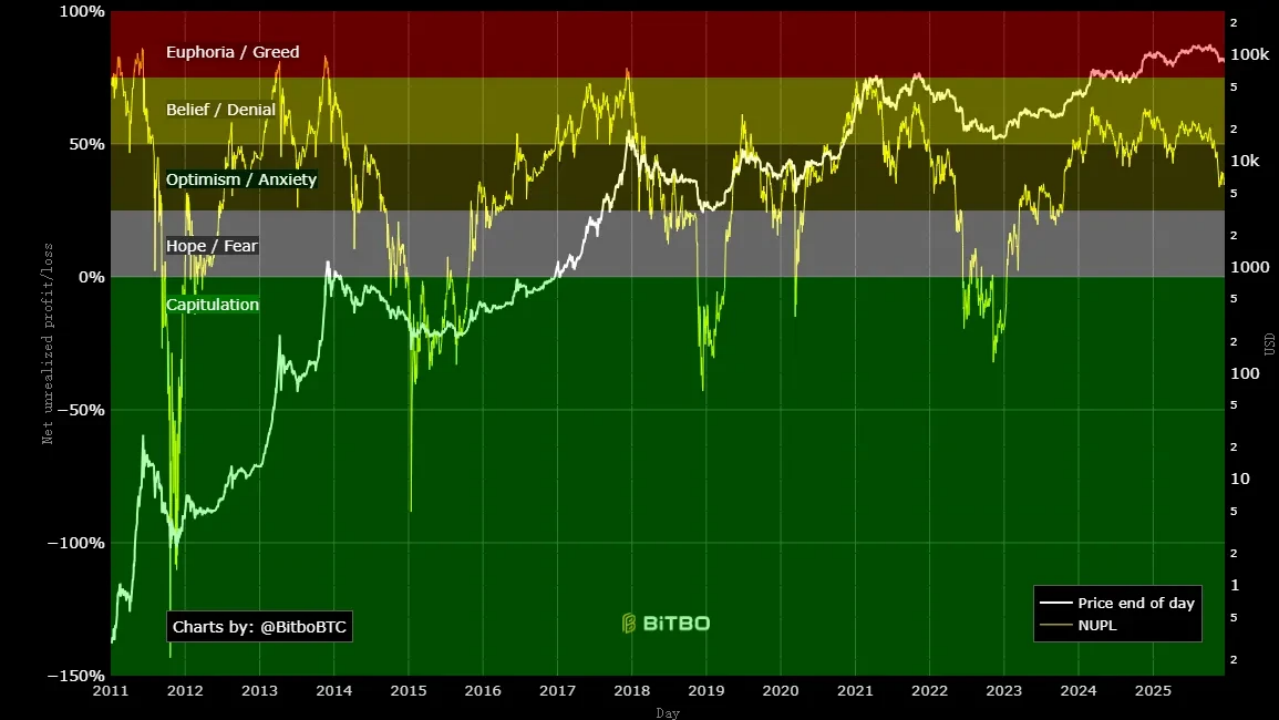
10. Bitcoin Net Unrealized Profit/Loss (NUPL): Has Unrealized Profit/Loss Entered the Greed Zone?

Bitcoin NUPL measures the network's overall unrealized profit/loss ratio, assessing market sentiment.

Its principle is: calculate market cap minus realized cap, then divide by market cap: above 0.75 indicates greed (top signal); below 0 indicates fear (bottom signal). In other words, high NUPL means "everyone is in profit," indicating high selling risk.

Historically, Bitcoin NUPL has shown extremely high values before each bull market peak:

2017 peak: Exceeded 0.8, a historical extreme;

2021 double top: Exceeded 0.7, followed by a crash;

Currently (Q4 2025), NUPL reached a high of 0.64 in early March 2024, has been fluctuating since, and has now fallen to 0.34.
Source: https://charts.bitbo.io/net-unrealized-profit-loss

Conclusion: Structural Changes in the Current Bitcoin Bull Market

Based on the above indicators, the current Bitcoin market trend does not highly align with the extreme performances seen at past bull market tops. Historical tops were often accompanied by multiple indicators overheating simultaneously, such as high Z-Score, high Puell Multiple, NUPL entering the greed zone, accompanied by LTH selling and STH surges, but now these indicators are performing very moderately.

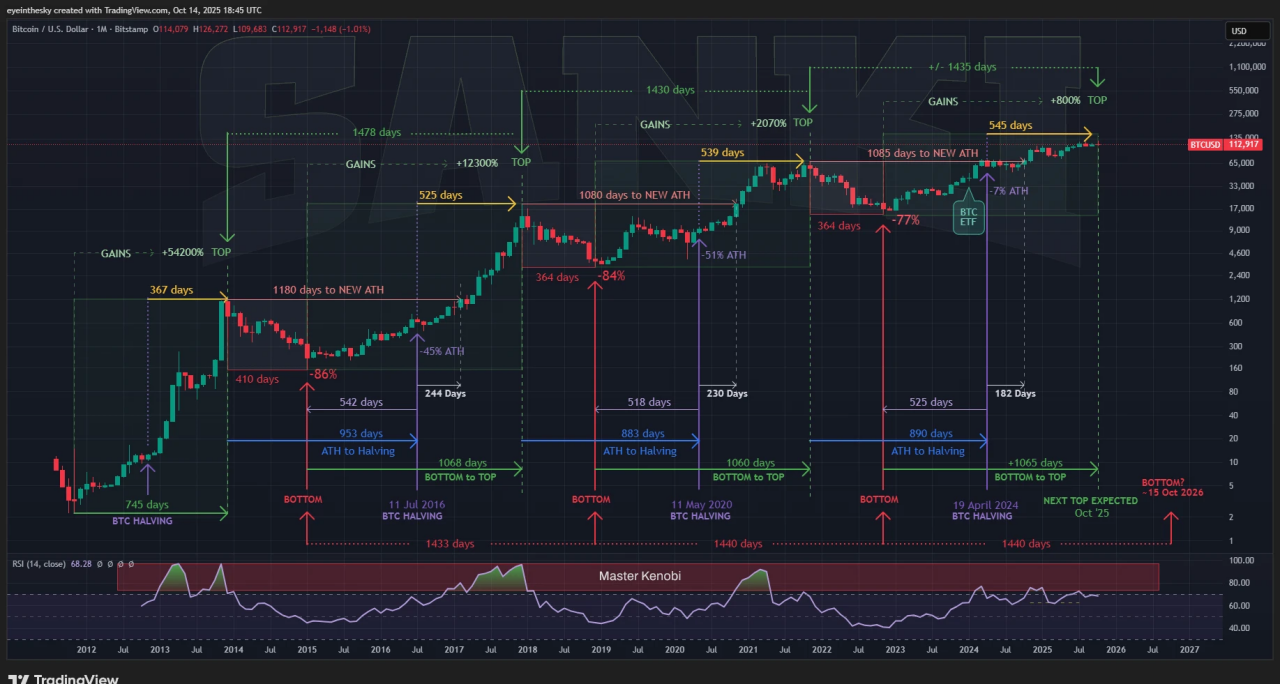
This does not mean that the current Bitcoin price has not yet peaked; these indicators are all based on spatial judgment, and the following chart, which predicts price tops based on a 3-year time cycle,似乎 suggests that Bitcoin has already peaked.
Source: https://x.com/btc_MasterPlan/status/1978180632410042828/photo/1

Of course, in analyzing the above indicators, we also found that these tools, based on linear price predictions, have already shown signs of decay in predicting top regions, exhibiting diminishing marginal effects. For example, the peak MVRV values during the 2017, 2021, and 2025 bull market tops were 10, 7, and 3 respectively. We显然 cannot expect the MVRV to reach 7 in this bull run, nor is it easy to predict a reliable value corresponding to this bull market top from MVRV.

In other words, while these indicators suggest the market is in a neutral or moderate range, they do not confirm that the bull market continues or that a bear market has arrived. Instead, they indicate that Bitcoin market growth has become more gradual rather than explosive, which may be attributed to:

First, the introduction of Bitcoin ETFs has attracted substantial long-term capital, stabilizing supply dynamics, which contrasts with past retail-driven bubbles and slows the pace of overheating.

Second, changes in global liquidity in 2025 (Fed rate cuts vs. BOJ rate hikes) and geopolitical shifts have repeatedly impacted BTC's price, and the平稳 changes in various indicators恰恰 show a more mature market.

In summary, whether the current high on October 6 is the peak of this bull market or not, we must acknowledge that Bitcoin price volatility may have broken through past historical frameworks and experiences. It seems to be undergoing a structural transformation from a "cyclical asset" to a "mainstream reserve." It is worth reminding investors that these indicators may need adjusted thresholds or combined use to be better applied to investment decisions.

About Us

WEEX Labs is the research department of WEEX Exchange, dedicated to tracking and analyzing cryptocurrencies, blockchain technology, and emerging market trends, providing professional assessments.

The team adheres to the principles of objective, independent, and comprehensive analysis, aiming to explore cutting-edge trends and investment opportunities through rigorous research methods and前沿 data analysis, outputting comprehensive, rigorous, and clear insights for the industry, and providing全方位 construction and investment guidance for Web3 startups and investors.

Disclaimer

The views expressed in this article are for reference only and do not constitute an endorsement of any products or services discussed, nor do they constitute any investment, financial, or trading advice. Readers should consult qualified professionals before making financial decisions. Please note that WEEX Labs may restrict or prohibit all or part of its services from restricted areas.


Trend Kriptolar

İlgili Sorular

QWhat is the Pi Cycle Top Indicator and what does it currently indicate about the Bitcoin market?

AThe Pi Cycle Top Indicator uses the 111-day moving average (111DMA) and the 350-day moving average multiplied by 2 (350DMA x 2) to identify market tops. Historically, a crossover occurs before a top. As of Q4 2025, the lines have not yet crossed, suggesting the market may not have reached a classic top signal according to this indicator.

QHow does the Puell Multiple gauge market cycles and what is its current reading?

AThe Puell Multiple measures the ratio of miners' revenue to its 365-day moving average, indicating miner profitability and potential selling pressure. A high value suggests a top. Currently, in Q4 2025, it is in the 1-2 range, indicating moderate miner pressure, not the extreme levels seen at past tops.

QAccording to the article, what is a key structural reason why this bull market might be different from previous ones?

AA key structural reason is the introduction of Bitcoin ETFs, which have attracted significant long-term institutional capital. This has stabilized supply dynamics and created a more gradual, mature market, contrasting with the retail-driven, rapid bubble formations of the past.

QWhat trend does the MVRV Z-Score show across the last three bull market peaks (2017, 2021, 2025)?

AThe MVRV Z-Score has shown a clear trend of diminishing peaks across the last three bull markets. It reached nearly 10 in 2017, over 7 at the first peak in 2021, and was only around 3 in the current cycle (Q4 2025), indicating its predictive power for identifying absolute tops may be weakening.

QWhat does the Altcoin Season Index measure and what does its current low value suggest?

AThe Altcoin Season Index tracks the performance of the top 100 altcoins relative to Bitcoin. A value above 75 indicates an 'altcoin season' where capital flows from BTC to alts, often near a market top. Its current low value (30-40 range in Q4 2025) suggests altcoins are underperforming and a classic speculative top has not been reached.

İlgili Okumalar

Analyzing the Impact of AI on Economic Growth and Productivity

**Title: Analyzing AI's Impact on Economic Growth and Productivity** This article examines three contrasting views on AI's influence on economic growth and productivity. **The Optimistic View** posits that AI, especially through automating R&D ("recursive self-improvement"), could dramatically accelerate growth, even triggering a technological "singularity" with explosive, potentially infinite, economic expansion. **The Moderate/Mainstream View** acknowledges AI's productivity benefits but emphasizes significant real-world constraints that could limit its impact. These include: limited cost savings per task, structural ceilings on which jobs and industries are "exposed" to AI, adoption bottlenecks (e.g., compute, energy, regulatory hurdles), and the "weak link" effect where non-automatable tasks cap overall gains. Consequently, the realized AI dividend may be far lower than optimistic projections, with estimates typically ranging from 0.1% to 1.3% annual productivity growth. **The Pessimistic View** stems from two strands. The first aligns with the moderate view but applies extremely conservative assumptions about task exposure and efficiency gains, yielding minimal projected impact. The second introduces a demand-side critique: if AI primarily replaces rather than augments labor, it could depress labor's share of income, weaken consumer demand, and create a "demand trap" that ultimately stifles growth, unless offset by redistribution policies. **The authors' assessment** is nuanced: * **Short-term (1-2 years):** AI will support growth primarily through investment spending, not significant productivity gains. * **Medium-term (3-5 years):** Three potential paths emerge based on AI demand and bottleneck severity: 1. **"Optimistic Path":** High demand, few bottlenecks. Rapid productivity gains but risk of major job displacement and social conflict without redistribution. 2. **"Moderate Path" (most likely):** High demand but significant, surmountable bottlenecks. Leads to moderate productivity gains, financial market volatility (K-shaped returns), and sectoral job losses. 3. **"Pessimistic Path":** Low demand or severe bottlenecks. Minimal productivity and growth impact, triggering financial market corrections but allowing a smoother societal transition with less labor disruption. * **Long-term:** AI holds potential for a major productivity revolution and prosperity. The conclusion stresses that no path is smooth. Technologically "optimistic" outcomes could be socially detrimental, while "pessimistic" technological diffusion might be more socially stable. Policymakers must monitor developments and prepare balanced responses to manage economic, financial, and social sustainability.

marsbit5 dk önce

Analyzing the Impact of AI on Economic Growth and Productivity

marsbit5 dk önce

The New Cold War is a Tech Stock War

The New Cold War is a Tech Stock War The article argues that the contemporary geopolitical and economic rivalry between the US and China represents a "New Cold War," but one fundamentally fought through technology and financial markets, not physical barriers or conventional trade. Historically, US dominance was secured through financial systems. The Soviet Union, reliant on the rigid "Transferable Ruble," was ultimately undermined by its dependency on the US dollar for oil trade. Later, Japan's semiconductor challenge was countered not just by tariffs (e.g., Plaza Accord, 301 investigations) but by binding it to US Treasury bonds. China presents a more complex, "embedded" challenger. While it holds vast dollar reserves and US debt like Japan, its industrial base is stronger and more diversified than the Soviet Union's. Surviving the initial 2018 trade war phase, the conflict has evolved into a "tech-financial war." The core battlefield is now the stock market. US tech stocks (AI, semiconductors) are treated as sovereign assets, buoyed by bipartisan national will. China is pushing to strengthen its own financial markets to convert industrial strength into financial power and fund its tech ambitions. Companies like ChangXin (semiconductors), Moonshot AI, and DJI compete not just for market share but as financial proxies for their respective systems. The new paradigm is moving from globally efficient monopolies (Apple, Google) towards companies that achieve monopolistic profits within their respective geopolitical spheres. This competition over "pricing power" and financial valuation in segmented markets defines the current era, making the stock market the primary arena for this tech-centric struggle.

marsbit15 dk önce

The New Cold War is a Tech Stock War

marsbit15 dk önce

RWA Weekly: Ten European Financial Institutions Establish Tokenized Asset Cooperative; Ondo Launches New Execution Network Ondo Network

RWA Weekly: European Banks Form Tokenized Asset Cooperative; Ondo Launches New Execution Network Ondo Network Covering July 24-31, 2026, the RWA sector saw a steady on-chain total value locked (TVL) of $36.8 billion, with holder count hitting a record high. However, stablecoin transfer volumes fell sharply (~30%), indicating low on-chain settlement demand. Key regulatory moves include South Korea advancing stablecoin legislation and a push to scrap crypto taxes, Kenya lowering capital requirements for stablecoin issuers, and Zimbabwe approving seven projects for its crypto sandbox. In project developments, BIS-led Project Agorá successfully tested cross-border payments with tokenized funds across six currencies. Ten major European financial institutions formed the RL1 blockchain cooperative to build tokenized asset infrastructure. Other notable updates: Aviva launched a tokenized dollar liquidity fund on XRPL, POSCO International tokenized commercial invoices on Injective, and a Brazilian farmer used tokenized cattle as collateral for a loan. Additional progress includes BNY Mellon migrating its core transfer agent operations to blockchain, Securitize gaining SEC investment advisor registration, and Tether’s compliant stablecoin USA₮ launching on Celo. Ondo Finance introduced Ondo Network, a new execution layer focused on speed and privacy, moving away from its initial chain plans. An analysis highlights that despite the growing scale of on-chain RWAs (~$32B), approximately 90% remain underutilized in DeFi, pointing to a critical challenge in unlocking liquidity and fostering real-world application beyond mere issuance.

marsbit15 dk önce

RWA Weekly: Ten European Financial Institutions Establish Tokenized Asset Cooperative; Ondo Launches New Execution Network Ondo Network

marsbit15 dk önce

South Korean Stock Market Sees Sharp Rebound After Forceful De-leveraging, SK Hynix Rises 30%

On July 31, South Korean stocks staged a historic rebound. The benchmark KOSPI index surged 18.27%, with chipmaker SK Hynix hitting a 30% gain limit. This followed a brutal, near-40% decline in the KOSPI over the previous month, driven largely by a deleveraging spiral involving leveraged ETFs. Analysts attributed the sharp sell-off to structural liquidity issues rather than deteriorating corporate fundamentals. The rally was triggered by a confluence of positive catalysts. Firstly, strong earnings from U.S. cloud giants Microsoft and Amazon alleviated fears of an "AI bubble burst," boosting global tech sentiment. Secondly, SK Group Chairman Chey Tae-won made a rare personal purchase of SK Hynix shares, seen as a strong vote of confidence. Thirdly, the South Korean government announced a 20 trillion won ($139 billion) AI investment fund. In response to the market turmoil, South Korean regulators are tightening controls on leveraged ETFs, admitting oversight shortcomings. Measures include raising minimum cash保证金 requirements for散户 investors and suspending new product launches. While the rebound signals eased liquidity pressure, analysts note deep structural issues remain. The market's future stability is seen as dependent on global tech capital expenditure trends and memory chip price cycles, with some viewing the surge as a technical correction rather than a definitive trend reversal.

marsbit35 dk önce

South Korean Stock Market Sees Sharp Rebound After Forceful De-leveraging, SK Hynix Rises 30%

marsbit35 dk önce

İşlemler

Spot

Popüler Makaleler

BITCOIN Nedir

HarryPotterObamaSonic10Inu (ERC-20)'yu ve Kripto Alanındaki Yerini Anlamak Son yıllarda, kripto para piyasası, hem ticaret yapanların hem de topluluk etkileşimi ve eğlence değeri arayanların ilgisini çeken meme coin'lerin popülaritesinde bir artış gördü. Bu benzersiz token'lar arasında, kripto para dokusuna kültürel referansları harmanlayan ilginç bir proje olan HarryPotterObamaSonic10Inu (ERC-20) bulunmaktadır. Bu makale, HarryPotterObamaSonic10Inu'nun temel yönlerini, mekanizmalarını, topluluk odaklı ethosunu ve daha geniş kripto manzarasıyla etkileşimini incelemektedir. HarryPotterObamaSonic10Inu (ERC-20) Nedir? Adından da anlaşılacağı gibi, HarryPotterObamaSonic10Inu, Ethereum blok zinciri üzerinde inşa edilen bir meme coin'dir ve ERC-20 standardı altında sınıflandırılmaktadır. Geleneksel kripto paraların pratik kullanılabilirlik veya yatırım potansiyeline odaklandığı durumların aksine, bu token eğlence değeri ve topluluğunun gücü üzerine kuruludur. Proje, bağlı kullanıcıların bir araya gelebileceği, fikirlerini paylaşabileceği ve çeşitli kültürel fenomenlerden ilham alan etkinliklere katılabileceği bir ortam yaratmayı hedeflemektedir. HarryPotterObamaSonic10Inu'nun dikkate değer özelliklerinden biri işlemlerde sıfır vergi olmasıdır. Bu çekici unsur, küçük ölçekli yatırımcıları caydırabilecek ek ücretlerden yoksun olarak ticareti ve topluluk katılımını teşvik etmeyi amaçlamaktadır. Coin'in toplam arzı bir milyar token olarak belirlenmiştir; bu, topluluk içinde önemli bir dolaşım sağlama niyetini göstermektedir. HarryPotterObamaSonic10Inu (ERC-20) Yaratıcısı HarryPotterObamaSonic10Inu'nun kökenleri bir miktar gizemlidir; yaratıcısı hakkında spesifik bilgilerin ne olduğu bilinmemektedir. Bu token'ın geliştirilmesi, belirli bir ekip veya açık bir plan eksikliği ile gerçekleşmiştir; bu durum, meme coin sektöründe oldukça yaygındır. Proje, topluluğunun heyecanı ve katılımına dayalı olarak organik bir şekilde ortaya çıkmıştır. HarryPotterObamaSonic10Inu (ERC-20) Yatırımcıları Dış yatırımlar ve destekler söz konusu olduğunda, HarryPotterObamaSonic10Inu da belirsiz kalmaktadır. Token, bilinen herhangi bir yatırım fonunu veya önemli bir kurumsal desteği listelememektedir. Bunun yerine, projenin can damarı, kolektif eylem ve kripto alanındaki katılım yoluyla büyüme ve sürdürülebilirlik sağlayan temel topluluğudur. HarryPotterObamaSonic10Inu (ERC-20) Nasıl Çalışır? Bir meme coin olarak, HarryPotterObamaSonic10Inu, genellikle varlık değerini yöneten geleneksel çerçevelerin dışında çalışmaktadır. Projenin nasıl çalıştığını tanımlayan birkaç özelliği vardır: Sıfır Vergi İşlemleri: İşlemlerde vergi ücreti olmadan, kullanıcılar gizli maliyet endişesi olmadan token'ı serbestçe alıp satabilirler. Topluluk Etkileşimi: Proje, topluluk etkileşimi üzerine kuruludur ve sosyal medya platformlarını kullanarak heyecan yaratarak katılımı kolaylaştırır. Tartışmalar, içerik paylaşımı ve katılım, projenin erişimini genişletmeye ve destekleyiciler arasında sadakat oluşturmaya yardımcı olan kritik unsurlardır. Pratik Kullanılabilirlik Yok: HarryPotterObamaSonic10Inu'nun mali ekosistem içinde somut bir kullanılabilirlik sunmadığı belirtilmelidir. Daha ziyade, eğlence ve topluluk etkinlikleri için bir token olarak sınıflandırılmaktadır. Kültürel Referans: Token, popüler kültürden unsurları zekice harmanlayarak ilgi çekmektedir ve hem meme meraklıları hem de kripto takipçileriyle bağlantı kurmaktadır. HarryPotterObamaSonic10Inu, meme coin'lerin, daha geleneksel kripto para projelerinden nasıl farklı çalıştığını örneklendirmektedir; bu projeler, utilitarist varlıklar yerine yenilikçi sosyal yapıların bir parçası olarak piyasaya girmektedir. HarryPotterObamaSonic10Inu (ERC-20) Zaman Çizelgesi HarryPotterObamaSonic10Inu'nun tarihi, birkaç dikkate değer kilometre taşı ile işaretlenmiştir: Oluşum: Token, birçok kripto meraklısının hayal gücünü yakalayan bir viral meme'den ortaya çıkmıştır. Spesifik yaratım tarihleri mevcut değildir ve bu onun organik yükselişini vurgulamaktadır. Borsa Listelemeleri: HarryPotterObamaSonic10Inu, topluluğun daha kolay erişim ve ticaret yapabilmesini sağlamak için çeşitli borsalarda yer bulmuştur. Topluluk Katılım İnisiyatifleri: Yarışmalar, sosyal medya kampanyaları ve hayranlar ile destekçilerden içerik üretimini içeren topluluk etkileşimini artırmayı amaçlayan devam eden etkinlikler. Gelecek Genişleme Planları: Projenin yol haritası, kültürel temalarına ilişkin bir NFT koleksiyonu, ticari ürünler ve bir e-ticaret sitesi başlatılmasını içermektedir; bu da topluluğun daha fazla katılımını sağlamayı ve ekosistemine daha fazla boyut kazandırmayı hedeflemektedir. HarryPotterObamaSonic10Inu (ERC-20) Hakkında Kilit Noktalar Topluluk Odaklı Doğası: Proje, kullanıcı katılımını geliştirme önceliği taşır ve böylece kullanıcıların sürecin en önünde yer almasını sağlar. Meme Coin Sınıflandırması: Eğlenceye dayalı kripto paranın doruk noktasıdır ve geleneksel yatırım araçlarından ayrılmaktadır. Bitcoin ile Doğrudan İlişki Yok: Ticker ismindeki benzeliğe rağmen, HarryPotterObamaSonic10Inu ayırt edicidir ve Bitcoin veya diğer yerleşik kripto paralarla herhangi bir ilişkisi yoktur. İşbirliğine Odaklanma: HarryPotterObamaSonic10Inu, sahipleri arasında işbirliği ve hikaye paylaşımı için bir alan oluşturmak üzere tasarlanmıştır ve bu da yaratıcılık ve topluluk bağlarını sağlamaktadır. Gelecek Beklentileri: Başlangıçta belirlendiği temalardan NFTs ve ticari ürünlere genişleme arzusu, projenin dijital kültürde daha ana akıma girebilmesi için bir yol haritası çizmektedir. Meme coin'ler, kripto para topluluğunun hayal gücünü çalmaya devam ederken, HarryPotterObamaSonic10Inu (ERC-20), kültürel bağları ve topluluk merkezli yaklaşımıyla öne çıkmaktadır. Geleneksel bir hizmet odaklı token modeliyle uyumlu olmasa da, özünde destekçileri arasında sağlanan neşe ve dostluğu vurgulayarak, giderek dijitalleşen bir çağda kripto paraların evrilen doğasını göstermektedir. Proje gelişmeye devam ettikçe, topluluk dinamiklerinin blockchain teknolojisi dünyasındaki seyrini nasıl etkilediğini izlemek önemli olacaktır.

2.2k Toplam GörüntülenmeYayınlanma 2024.04.01Güncellenme 2024.12.03

BITCOIN Nedir

BTC Nasıl Satın Alınır

HTX.com’a hoş geldiniz! Bitcoin (BTC) satın alma işlemlerini basit ve kullanışlı bir hâle getirdik. Adım adım açıkladığımız rehberimizi takip ederek kripto yolculuğunuza başlayın. 1. Adım: HTX Hesabınızı OluşturunHTX'te ücretsiz bir hesap açmak için e-posta adresinizi veya telefon numaranızı kullanın. Sorunsuzca kaydolun ve tüm özelliklerin kilidini açın. Hesabımı Aç2. Adım: Kripto Satın Al Bölümüne Gidin ve Ödeme Yönteminizi SeçinKredi/Banka Kartı: Visa veya Mastercard'ınızı kullanarak anında Bitcoin (BTC) satın alın.Bakiye: Sorunsuz bir şekilde işlem yapmak için HTX hesap bakiyenizdeki fonları kullanın.Üçüncü Taraflar: Kullanımı kolaylaştırmak için Google Pay ve Apple Pay gibi popüler ödeme yöntemlerini ekledik.P2P: HTX'teki diğer kullanıcılarla doğrudan işlem yapın.Borsa Dışı (OTC): Yatırımcılar için kişiye özel hizmetler ve rekabetçi döviz kurları sunuyoruz.3. Adım: Bitcoin (BTC) Varlıklarınızı SaklayınBitcoin (BTC) satın aldıktan sonra HTX hesabınızda saklayın. Alternatif olarak, blok zinciri transferi yoluyla başka bir yere gönderebilir veya diğer kripto para birimlerini takas etmek için kullanabilirsiniz.4. Adım: Bitcoin (BTC) Varlıklarınızla İşlem YapınHTX'in spot piyasasında Bitcoin (BTC) ile kolayca işlemler yapın.Hesabınıza erişin, işlem çiftinizi seçin, işlemlerinizi gerçekleştirin ve gerçek zamanlı olarak izleyin. Hem yeni başlayanlar hem de deneyimli yatırımcılar için kullanıcı dostu bir deneyim sunuyoruz.

8.3k Toplam GörüntülenmeYayınlanma 2024.12.12Güncellenme 2026.06.02

BTC Nasıl Satın Alınır

$BITCOIN Nedir

DİJİTAL ALTIN ($BITCOIN): Kapsamlı Bir Analiz DİJİTAL ALTIN ($BITCOIN) Tanıtımı DİJİTAL ALTIN ($BITCOIN), geleneksel değerli metallerin özelliklerini merkeziyetsiz teknolojilerin yeniliği ile birleştirmeyi amaçlayan Solana ağı üzerinde çalışan blockchain tabanlı bir projedir. Bitcoin ile aynı isme sahip olmasına rağmen, genellikle bir değer saklama aracı olarak algılandığı için “dijital altın” olarak anılmaktadır; DİJİTAL ALTIN, Web3 ortamında benzersiz bir ekosistem yaratmak için tasarlanmış ayrı bir tokendir. Hedefi, uygulanabilir bir alternatif dijital varlık olarak kendini konumlandırmaktır, ancak uygulamaları ve işlevleri ile ilgili ayrıntılar hala gelişmektedir. DİJİTAL ALTIN ($BITCOIN) Nedir? DİJİTAL ALTIN ($BITCOIN), Solana blockchain'inde kullanılmak üzere açıkça tasarlanmış bir kripto para tokenidir. Bitcoin'in yaygın olarak tanınan bir değer saklama rolü sağlamasının aksine, bu token daha geniş uygulamalara ve özelliklere odaklanıyor gibi görünmektedir. Dikkate değer yönler şunlardır: Blockchain Altyapısı: Token, yüksek hızlı ve düşük maliyetli işlemleri yönetme kapasitesi ile bilinen Solana blockchain'inde inşa edilmiştir. Arz Dinamikleri: DİJİTAL ALTIN'ın maksimum arzı 100 katrilyon token (100P $BITCOIN) ile sınırlıdır, ancak dolaşımdaki arzı ile ilgili ayrıntılar şu anda açıklanmamıştır. Kullanım Alanı: Kesin işlevler açıkça belirtilmemiş olsa da, token'ın merkeziyetsiz uygulamalar (dApps) veya varlık tokenizasyon stratejileri ile ilgili çeşitli uygulamalar için kullanılabileceğine dair işaretler bulunmaktadır. DİJİTAL ALTIN ($BITCOIN) Yaratıcısı Kimdir? Şu anda, DİJİTAL ALTIN ($BITCOIN) arkasındaki yaratıcıların ve geliştirme ekibinin kimliği bilinmemektedir. Bu durum, merkeziyetsiz finans ve meme coin fenomenleriyle uyumlu olan birçok yenilikçi proje arasında yaygındır. Böyle bir anonimlik, topluluk odaklı bir kültürü teşvik edebilirken, yönetişim ve hesap verebilirlik konusundaki endişeleri artırmaktadır. DİJİTAL ALTIN ($BITCOIN) Yatırımcıları Kimlerdir? Mevcut bilgiler, DİJİTAL ALTIN ($BITCOIN) için bilinen herhangi bir kurumsal destekçi veya önde gelen risk sermayesi yatırımı olmadığını göstermektedir. Proje, geleneksel finansman yolları yerine topluluk desteği ve benimsemeye odaklanan bir eşler arası modelde çalışıyor gibi görünmektedir. Faaliyetleri ve likiditesi esas olarak PumpSwap gibi merkeziyetsiz borsalarda (DEX'ler) yer almakta olup, bu da onun taban hareketine vurgu yapmaktadır. DİJİTAL ALTIN ($BITCOIN) Nasıl Çalışır DİJİTAL ALTIN ($BITCOIN) 'ın operasyonel mekanikleri, blockchain tasarımı ve ağ özellikleri temelinde açıklanabilir: Konsensüs Mekanizması: Solana'nın benzersiz tarih kanıtı (PoH) ile bir hisse kanıtı (PoS) modelini birleştirerek, proje ağın yüksek performansına katkıda bulunan verimli işlem doğrulamasını sağlar. Tokenomik: Belirli deflasyonist mekanizmalar kapsamlı bir şekilde detaylandırılmamış olsa da, geniş maksimum token arzı, henüz tanımlanmamış mikro işlemler veya niş kullanım durumlarına hitap edebileceğini ima etmektedir. Etkileşim: Solana'nın daha geniş ekosistemi ile entegrasyon potansiyeli bulunmaktadır; bu, çeşitli merkeziyetsiz finans (DeFi) platformlarını içermektedir. Ancak, belirli entegrasyonlarla ilgili ayrıntılar belirtilmemiştir. Önemli Olayların Zaman Çizelgesi DİJİTAL ALTIN ($BITCOIN) ile ilgili önemli kilometre taşlarını vurgulayan bir zaman çizelgesi: 2023: Token'ın Solana blockchain'inde ilk dağıtımı, sözleşme adresi ile işaretlenmiştir. 2024: DİJİTAL ALTIN, PumpSwap gibi merkeziyetsiz borsalarda işlem görmeye başladıkça görünürlük kazanır ve kullanıcıların bunu SOL karşısında ticaret yapmasına olanak tanır. 2025: Proje, topluluk odaklı etkileşimlere yönelik potansiyel ilgi ve ara sıra ticaret faaliyetleri görür, ancak şu ana kadar dikkate değer ortaklıklar veya teknik ilerlemeler belgelenmemiştir. Kritik Analiz Güçlü Yönler Ölçeklenebilirlik: Temel Solana altyapısı, yüksek işlem hacimlerini destekleyerek $BITCOIN'in çeşitli işlem senaryolarındaki faydasını artırabilir. Erişilebilirlik: Token başına potansiyel düşük ticaret fiyatı, perakende yatırımcıları çekebilir ve parçalı mülkiyet fırsatları sayesinde daha geniş katılımı kolaylaştırabilir. Riskler Şeffaflık Eksikliği: Kamuya açık olarak bilinen destekçilerin, geliştiricilerin veya bir denetim sürecinin olmaması, projenin sürdürülebilirliği ve güvenilirliği konusunda şüpheler doğurabilir. Piyasa Volatilitesi: Ticaret faaliyeti büyük ölçüde spekülatif davranışa dayanmakta olup, bu da yatırımcılar için önemli fiyat dalgalanmalarına ve belirsizliklere yol açabilir. Sonuç DİJİTAL ALTIN ($BITCOIN), hızla gelişen Solana ekosisteminde ilginç ama belirsiz bir proje olarak ortaya çıkmaktadır. “Dijital altın” anlatısını kullanmaya çalışırken, Bitcoin'in değer saklama rolünden ayrılması, amaçlanan faydasının ve yönetişim yapısının daha net bir şekilde tanımlanması gerekliliğini vurgulamaktadır. Gelecekteki kabul ve benimseme, mevcut belirsizliklerin giderilmesine ve operasyonel ile ekonomik stratejilerinin daha açık bir şekilde tanımlanmasına bağlı olacaktır. Not: Bu rapor, Ekim 2023 itibarıyla mevcut olan sentezlenmiş bilgileri kapsamaktadır ve araştırma döneminin ötesinde gelişmeler yaşanmış olabilir.

245 Toplam GörüntülenmeYayınlanma 2025.05.13Güncellenme 2025.05.13

$BITCOIN Nedir

Tartışmalar

HTX Topluluğuna hoş geldiniz. Burada, en son platform gelişmeleri hakkında bilgi sahibi olabilir ve profesyonel piyasa görüşlerine erişebilirsiniz. Kullanıcıların BTC (BTC) fiyatı hakkındaki görüşleri aşağıda sunulmaktadır.

活动图片