Analyst’s Bitcoin Price Crash Prediction From May 2025 Resurfaces And It Says The Bottom Is Not In

bitcoinist2026-02-09 tarihinde yayınlandı2026-02-09 tarihinde güncellendi

Özet

A previously published Bitcoin price crash projection from analyst KillaXBT, dating back to May 13, 2025, has regained attention for accurately predicting the current market downturn. The model uses rotational market mathematics to identify cycle stages—accumulation, distribution, and breakdown—and signaled that Bitcoin had not yet reached a macro bottom. The analysis highlighted key levels, including accumulation phases that fueled the rally and distribution zones near $115,000–$120,000 where exhaustion signals emerged. The chart correctly anticipated rejections at highs, fading momentum, and eventual breakdowns, with Bitcoin transitioning into mid-range consolidation around $100,000 before falling further. Currently, Bitcoin is trading in a lower distribution band near $70,000, with the model suggesting extended bearish consolidation. Relief rallies lack strength, and volatility remains high on declines. The projection indicates a potential capitulation toward $50,000 to complete the distribution phase, concluding that the true market bottom has not yet been established.

A previously published Bitcoin price crash projection from May 13, 2025, has re-entered market discourse after several prominent crypto traders on X recirculated the chart and commended the foresight behind the analysis from KillaXBT. The model mapped Bitcoin’s full cycle structure — from accumulation to distribution and breakdown — long before the current correction unfolded. Now, the same framework is signaling that Bitcoin has yet to establish a macro bottom.

Chart Signals That Nailed The Bitcoin Price Crash

KillaXBT’s framework is built on rotational market mathematics, measuring how many times price cycles are within a range before exhaustion. The analyst segmented Bitcoin’s structure into consolidation blocks and assigned swing counts to identify when liquidity had been fully absorbed.

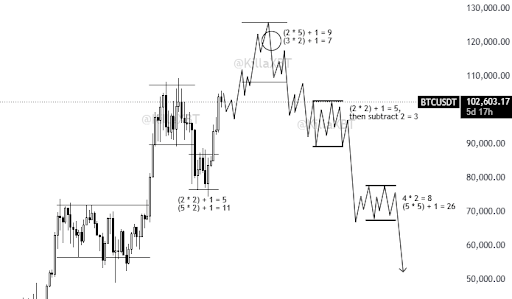
In the early phase, accumulation rotations labeled “(2×2)+1 = 5” and “(5×2)+1 = 11” defined the base that ultimately fueled Bitcoin’s impulsive rally. These counts indicated that internal liquidity cycling was complete, clearing the path for expansion. Once that move matured, the price transitioned into a high-range consolidation beneath the cycle peak.

Inside the 115,000–120,000 distribution zone, the chart identified overlapping exhaustion clusters marked “(2×5)+1 = 9” and “(3×2)+1 = 7.” For traders, stacked counts at highs typically signal supply absorption. Although Bitcoin printed marginal higher highs, momentum was fading — a textbook late-stage distribution signal.

Source: Chart from KillaXBT on X

Market behavior followed that roadmap. Bitcoin formed repeated rejection wicks near the highs, upside momentum slowed, and breakout attempts failed to secure acceptance above resistance. Volume compression reinforced the distribution thesis. Instead of continuation, the price rolled over.

The model then mapped a transition into mid-range consolidation around the 100,000 psychological level, with BTCUSDT referenced near 102,603. Annotated “(2×2)+1 = 5, then subtract 2 = 3,” the structure signaled weakening bounce capacity. Price action mirrored the setup: multiple support tests, lower highs, and eventual breakdown — completing the crash phase outlined in the May 2025 forecast.

Bitcoin Price Could Drop Further Before Hitting Bottom

The resurfaced chart’s larger significance lies in its forward projection. After the six-figure range failed, the model guided Bitcoin into a lower distribution band around 70,000. This zone carried heavier rotational counts — “4×2 = 8” and “(5×5)+1 = 26” — implying extended consolidation within a bearish continuation framework.

Current market behavior continues to align with that structure. Bitcoin has already rotated into lower support territory following the 100K breakdown, while volatility has expanded on selloffs rather than recoveries. Relief rallies remain corrective, lacking the impulsive follow-through required to confirm bottom formation.

The chart’s final stage shows a potential capitulation toward the $50,000 area, marked by a sharp move below the lower range. Structurally, this is an unfinished downside that completes the current distribution phase.

The sequence is straightforward: accumulation pushed prices higher, the rise led to distribution, and now distribution is causing further breakdowns. Because no consolidation has shown the expansion profile typical of a macro base, the model maintains that the true bottom is not yet in.

BTC trading at $69,162 on the 1D chart | Source: BTCUSDT on Tradingview.com

İlgili Sorular

QWhat is the main prediction of the resurfaced Bitcoin price analysis from May 2025?

AThe analysis predicts that the Bitcoin price crash is not over yet and that the true macro bottom has not been established, with a potential further drop toward the $50,000 area.

QWho created the Bitcoin price projection model that is being discussed?

AThe model was created by an analyst known as KillaXBT.

QWhat key mathematical concept does KillaXBT's framework use to analyze Bitcoin's price action?

AThe framework is built on rotational market mathematics, measuring how many times price cycles are within a range before exhaustion, using formulas like (2x2)+1=5 to identify liquidity absorption and exhaustion clusters.

QAccording to the model, what was the significance of the distribution zone between $115,000 and $120,000?

AThis zone was identified as a high-range distribution area with overlapping exhaustion clusters, signaling supply absorption and marking a late-stage distribution phase before the price rolled over.

QWhat is the model's final projected stage for the current Bitcoin price cycle?

AThe model's final projected stage is a potential capitulation event, involving a sharp move below the lower consolidation range toward the $50,000 area to complete the current distribution phase.

İlgili Okumalar

The Entire Internet Hails Noam's Joining, But OpenAI's Loss Bill Just Got Thicker

While the AI community celebrates Noam Shazeer, co-author of the "Attention Is All You Need" paper, joining OpenAI as Head of Architectural Research, the company's audited financials reveal a starkly different reality. In 2025, OpenAI reported $13.07 billion in revenue but a massive $20.92 billion operating loss. Even excluding a one-time accounting charge, the cash burn is severe, with $3.7 billion consumed in Q1 2026 alone. This high-profile hiring occurs against a backdrop of significant internal research talent drain, with key founders and researchers departing as the company's focus shifts from exploratory research to product iteration. Meanwhile, OpenAI's fundamental business model faces a deep crisis. It paid Microsoft $10.59 billion for compute in 2025, while its vast user base of 9 billion weekly actives includes only 50 million paying customers, making growth a direct driver of escalating costs. The article argues Shazeer's recruitment is less about technical necessity and more about crafting a compelling narrative for OpenAI's upcoming IPO, aiming to justify a rumored $1 trillion valuation to future public market investors. It contrasts OpenAI's strategy with Anthropic's reported path to profitability, which relies on a strong enterprise customer base and cost control, rather than star-powered narratives. Ultimately, the piece concludes that while Shazeer's architectural work may take 1-2 years to materialize, OpenAI's financial clock is ticking much faster, with its massive losses undercutting the celebratory headlines.

marsbit1 saat önce

The Entire Internet Hails Noam's Joining, But OpenAI's Loss Bill Just Got Thicker

marsbit1 saat önce

Market Trend (June 19): US-Iran Deal Drives Out Geopolitical Premium; Chip Stocks Soar to New Highs; Energy Sector Leads Declines

U.S. Market Trends (June 19): U.S.-Iran Deal Eases Tensions, Chip Stocks Soar, Energy Sector Leads Declines. U.S. stocks rallied on Thursday as the signing of a temporary U.S.-Iran deal in Geneva de-escalated Middle East tensions, with Saudi oil tankers transiting the Strait of Hormuz. This geopolitical relief helped markets recover from recent Fed-driven volatility. The S&P 500 rose over 1%, the Nasdaq gained nearly 2%, and the Dow Jones Industrial Average closed at another record high. The Philadelphia Semiconductor Index surged over 6% to a historic peak. Chip stocks were the standout performers. Reports of an Apple-Intel design and foundry deal for certain products, alongside mentions of potential Nvidia and SpaceX collaborations with Intel, propelled the sector. Intel surged ~10.5%, while memory chip makers like Micron also saw significant gains, highlighting sustained confidence in long-term AI capital expenditure. In contrast, the energy sector was the day's sole loser, with the S&P 500 energy sub-index declining as WTI crude fell ~2% to around $74.29/barrel. The reopening of key shipping routes erased prior geopolitical risk premiums. SpaceX extended losses for a second day on news of a potential large bond offering. Market volatility (VIX) dropped sharply, indicating a swift reversal of post-Fed jitters. Treasury yields dipped slightly but remained elevated. The focus now shifts to upcoming economic data, including next week's PCE inflation report and Micron's earnings, which will serve as a key test for the AI trade's durability.

marsbit2 saat önce

Market Trend (June 19): US-Iran Deal Drives Out Geopolitical Premium; Chip Stocks Soar to New Highs; Energy Sector Leads Declines

marsbit2 saat önce

İşlemler

Spot
Futures
活动图片