Analyst Exposes Bitcoin Market Maker Buy Strategy, Shows What Happens When Accumulation Ends

bitcoinist2026-04-18 tarihinde yayınlandı2026-04-18 tarihinde güncellendi

Özet

A crypto analyst, Merlijn The Trader, has presented a market structure model suggesting Bitcoin is following an institutional trading cycle. The model outlines four key phases: a "Distribution" phase where large holders sold BTC near highs, a sharp "Flush" that dropped prices 38% to eliminate weak traders, the current "Accumulation" phase where institutions are buying in a tight range between $60k-$77k, and a future "Re-accumulation" period. The analyst projects that once accumulation ends, Bitcoin could break out to new all-time highs, with a potential target above $142,000 by early 2027. Holding above the $70,000 resistance level is critical for this bullish scenario to remain valid.

A crypto analyst has outlined a detailed market structure, suggesting that Bitcoin (BTC) may be entering a decisive stage after months of consolidation and price declines. His strategy maps recent price behavior into a sequence of institutionally driven phases, arguing that the end of accumulation often signals the start of a stronger upward expansion.

The Bitcoin MarketMaker Buy Strategy

Crypto market expert Merlijn The Trader has presented a market structure model on X, showing that Bitcoin’s recent price action is unfolding in line with an institutional trading cycle. The chart framework, known as the MarketMaker Buy Model, argues that large institutional players move markets in predictable stages designed to transfer Bitcoin from emotional retail traders into stronger, long-term holders before pushing prices significantly higher.

According to the analyst, the first stage of the cycle, highlighted in the first green box on the chart, began with a “Distribution” phase that occurred between about $100,000 and $120,000 in mid-2024. During this period, Bitcoin traded in a choppy downward pattern. This type of movement indicated that large holders were selling their Bitcoin amid strong demand from retail traders buying aggressively near the market top.

The second stage identified by Merlijn The Trader is the “Flush,” marked by the red box on the chart. This phase saw a sharp and aggressive price decline designed to force weaker traders out of the market. Here, Bitcoin reportedly fell from $100,000 to $62,000, a roughly 38% drop.

Source: Chart from Merlijn The Trader on X

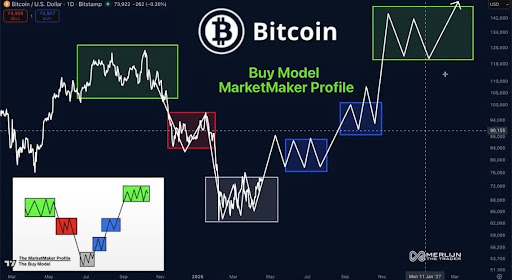
Following this correction, the MarketMaker model transitions into the “Accumulation” phase, represented by the larger grey box on the chart. According to the model, this is the stage where the market is currently consolidating. Merlijn The Trader places this phase between roughly $60,000 and $77,000.

Within this zone, Bitcoin is trading in a relatively tight and choppy range rather than trending strongly in one direction. The sideways movement during this period also suggests that Bitcoin is building a foundation near a potential price bottom, as institutional buyers gradually accumulate more coins.

In the fourth stage, Merlijn The Trader identifies the two blue boxes on the chart as a “Re-accumulation.” This zone, between approximately $80,000 and $95,000, marks a secondary consolidation period that typically follows a price bottom. This phase provides another opportunity for large investors to strengthen their positions before BTC potentially begins its next upward movement.

What’s Next For BTC After Accumulation

Looking ahead, Merlijn The Trader projects a potential upside target above $142,000 once Bitcoin emerges from its accumulation and re-accumulation phases. In his chart model, the path to this level may involve another short consolidation period before a possible breakout into new all-time highs by January 2027.

The analyst also highlights a key resistance level around $70,000. Holding above this resistance is critical to maintaining the integrity of the MarketMaker model. Meanwhile, falling below the level suggests the structure may not be following the expected path.

BTC trading at $75,550 on the 1D chart | Source: BTCUSDT on Tradingview.com

İlgili Sorular

QWhat is the name of the market structure model presented by the analyst Merlijn The Trader?

AThe MarketMaker Buy Model.

QAccording to the model, what is the purpose of the 'Flush' phase?

AThe 'Flush' phase is a sharp and aggressive price decline designed to force weaker traders out of the market.

QIn which price range is the current 'Accumulation' phase taking place, according to the analyst?

AThe 'Accumulation' phase is taking place between roughly $60,000 and $77,000.

QWhat is the potential upside price target for Bitcoin once it emerges from the accumulation phases?

AThe potential upside price target is above $142,000.

QWhat is the critical resistance level that Bitcoin must hold above to maintain the integrity of the MarketMaker model?

AThe critical resistance level is around $70,000.

İlgili Okumalar

You Bet on the News, the Pros Read the Rules: The True Cognitive Gap in Losing Money on Polymarket

The article explains that the key to profiting on Polymarket, a prediction market platform, lies not just predicting real-world events correctly, but in meticulously understanding the specific rules that govern how each market will be resolved. It illustrates this with examples, such as a market on Venezuela's 2026 leader, where the official rules defining "officially holds" the office overruled the intuitive answer of who was in practical control. Other examples include debates over the definition of a "token" or what constitutes an "agreement." The core argument is that a "reality vs. rules" gap creates pricing discrepancies that savvy traders ("车头" or "whales") exploit. The platform has a formal dispute resolution process managed by UMA token holders to settle ambiguous outcomes. This process involves proposal submission, a challenge window, a discussion period, and a final vote. However, the article highlights a critical flaw in this system compared to a traditional court: the lack of separation between the arbiters (UMA voters) and the interested parties (traders with financial stakes in the outcome). This conflict of interest undermines the discussion phase, leads to herd mentality, and results in opaque final decisions without explanatory rulings. Consequently, the system lacks a body of precedent, making it difficult for users to learn from past disputes. The ultimate takeaway is that success on Polymarket requires a lawyer-like scrutiny of the rules to identify and capitalize on the cognitive gap between how events appear and how they are contractually defined for settlement.

marsbit50 dk önce

You Bet on the News, the Pros Read the Rules: The True Cognitive Gap in Losing Money on Polymarket

marsbit50 dk önce

Will the Fed Still Cut Interest Rates? Tonight's Data Is Crucial

The core debate surrounding the Federal Reserve's potential interest rate cuts is intensifying amid geopolitical conflict and rebounding inflation. The key question is whether high energy prices will cause persistent inflation or weaken consumer demand enough to force the Fed to cut rates. Citigroup presents a bullish case for cuts, arguing that oil supply disruptions from the Strait of Hormuz are temporary and will not lead to lasting inflationary pressure. They point to receding bond yields and oil prices as evidence the market is pricing in a short-lived shock. Citi's data also shows tightening financial conditions, a stabilizing labor market, and healthy tax returns, supporting their view that the path to lower rates remains open. Conversely, Deutsche Bank offers a starkly contrasting, more hawkish outlook. They argue the Fed's current policy is already neutral and expect rates to remain unchanged indefinitely. Their view is based on stalled disinflation progress and a shift toward more hawkish rhetoric from key Fed officials like Waller, who cited risks from prolonged Middle East conflict and tariffs. Other officials, including Williams and Hammack, signaled rates would likely stay on hold for a "considerable time." The market pricing has shifted dramatically, now forecasting zero cuts in 2026. The imminent release of the March retail sales "control group" data is highlighted as a critical test. This metric, which excludes gas station sales, will reveal if high gasoline prices are eroding consumer spending in other areas. A weak reading could support the case for imminent rate cuts, while a strong one would bolster the argument for the Fed to hold steady. This data is pivotal for determining the near-term policy path.

marsbit1 saat önce

Will the Fed Still Cut Interest Rates? Tonight's Data Is Crucial

marsbit1 saat önce

İşlemler

Spot
Futures
活动图片