a16z Crypto: 9 Charts to Understand the Evolution of Stablecoins

marsbit2026-04-25 tarihinde yayınlandı2026-04-25 tarihinde güncellendi

Özet

Stablecoins are evolving from trading instruments to core financial infrastructure, driven by regulatory clarity and increased adoption. Key trends include accelerated growth following the U.S. GENIUS Act and the EU’s MiCA framework, which spurred non-USD stablecoin activity. Consumer-to-business transactions are growing fastest, doubling in 2025, while stablecoin card usage has surged. Velocity has nearly doubled since 2024, indicating active use rather than passive holding. Geographically, Asia dominates volume, led by Singapore, Hong Kong, and Japan. Notably, domestic transactions now account for nearly three-quarters of payments, highlighting stablecoins' role as local payment mediums on global infrastructure. Non-USD stablecoins, like Brazil’s BRLA, are also gaining traction. The data suggests stablecoins are becoming ubiquitous payment tools—global in design but increasingly local in practice.

Author: a16z crypto

Compiled by: Jiahuan, ChainCatcher

Stablecoins have been finding their footing for years.

Initially, they were just a trading tool, a means to transfer dollars across exchanges. Then they evolved into a savings instrument, held rather than spent. Today, the data points in a new direction: stablecoins are increasingly becoming core financial infrastructure.

The following nine charts reveal the factors driving this trend.

Regulation Accelerates Market Growth

For most of their history, regulatory uncertainty limited institutional participation. Later, the GENIUS Act brought regulatory clarity. It didn't create this trend, but it amplified and accelerated it.
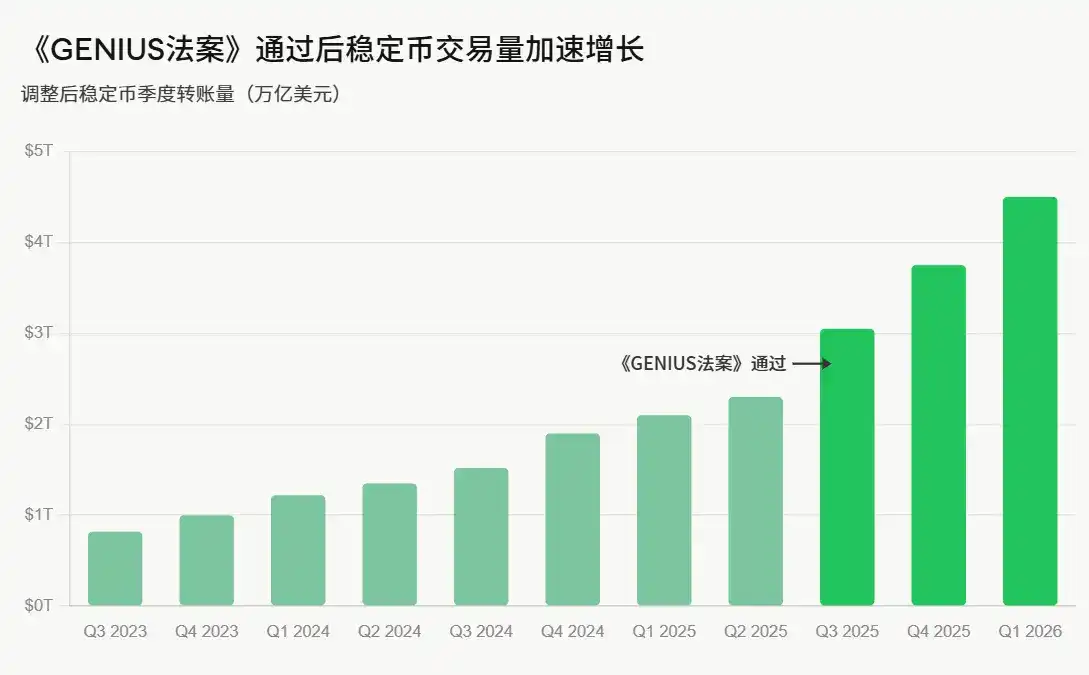
In the United States, the GENIUS Act established the first federal-level framework for stablecoin issuance. This shift is clearly visible in the data: adjusted trading volume had been rising for several quarters before the bill's passage, and growth accelerated further after its passage, reaching approximately $4.5 trillion in Q1 2026.

European regulation—the Markets in Crypto-Assets (MiCA) framework—tells a more complex story. When the法案 fully came into effect at the end of 2024, several major exchanges delisted USDT to comply, leading to a surge in activity for non-dollar stablecoins, which一度 exceeded $40 billion.
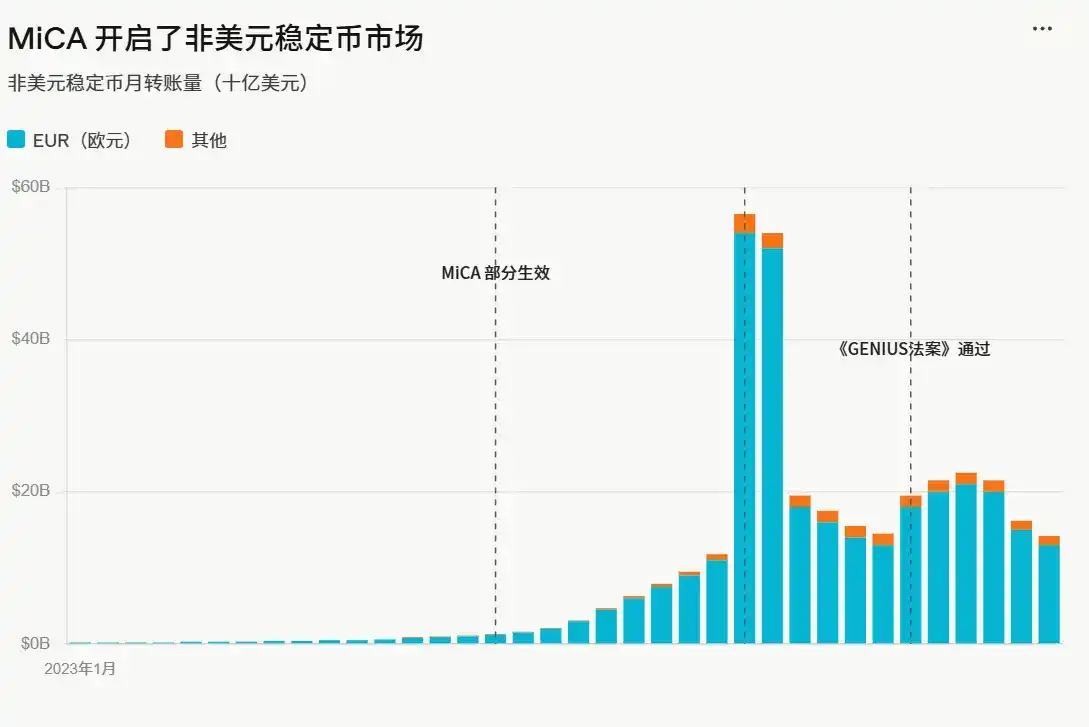
Since then, trading volume has stabilized at levels higher than the pre-MiCA baseline, around $15 billion to $25 billion per month. Regulation created a lasting market for non-dollar stablecoins that previously barely existed.

Stablecoin Commercial Activity is Growing

Perhaps the most noteworthy structural change lies in how people are actually using stablecoins.
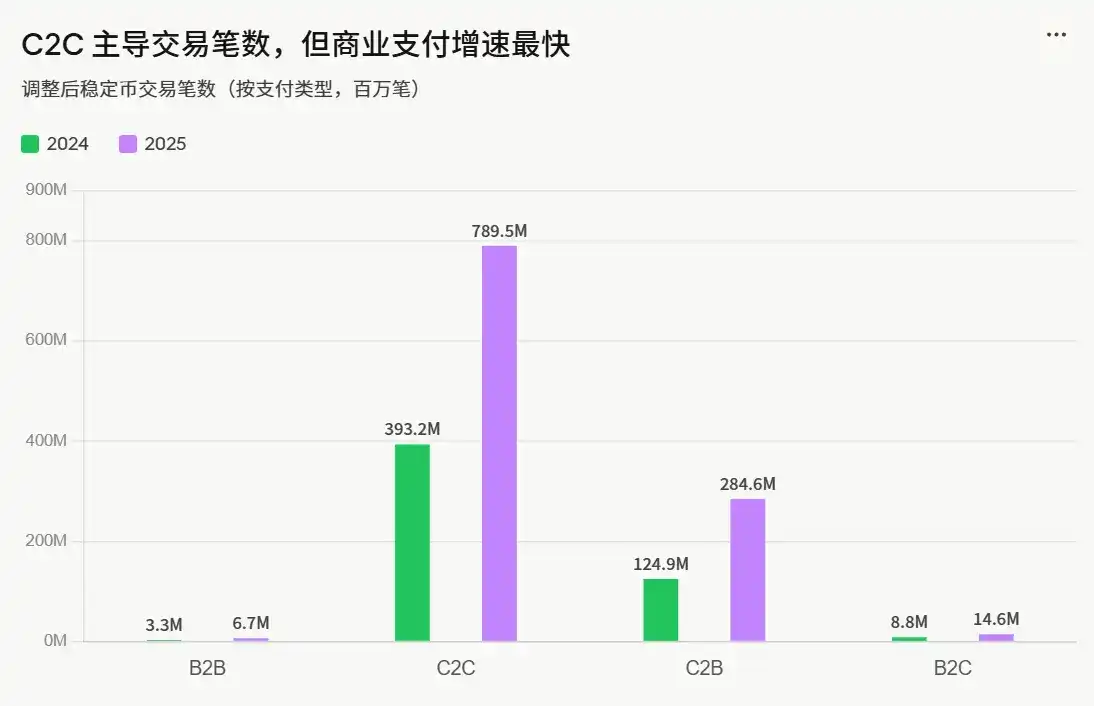
In terms of raw transaction count, the C2C category far surpasses all others: reaching 789.5 million in 2025. But Consumer-to-Business (C2B) stablecoin transactions grew the fastest, reaching 284.6 million in 2025 compared to 124.9 million in 2024, more than doubling year-over-year (+128%).

Data from stablecoin card infrastructure highlights this trend.
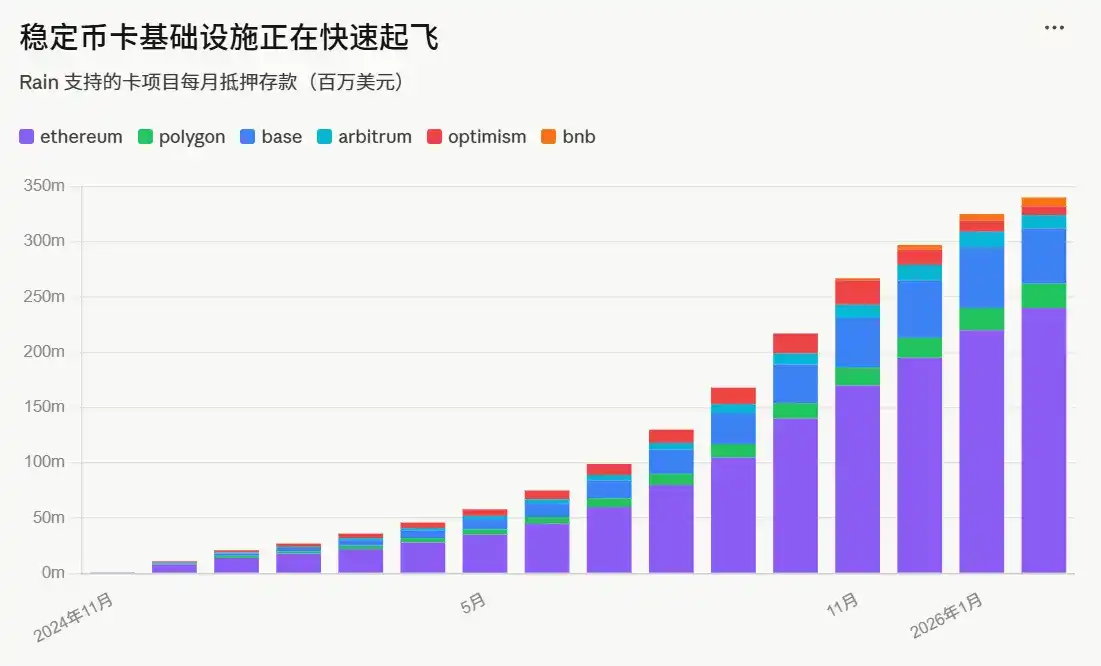
Monthly collateral deposits for stablecoin card programs supported by Rain (including Etherfi Cash, Kast, Wallbit, etc.) grew from nearly zero in November 2024 to over $300 million per month by early 2026. While this is collateral supporting spending, not direct spending of stablecoins, the trajectory is striking: stablecoin commercial activity is on the rise.

Stablecoin Velocity is Increasing

Every dollar of stablecoin supply is turning over more frequently.

Since early 2024, the velocity of stablecoins (the ratio of adjusted monthly transfer volume to circulating supply) has almost doubled, rising from 2.6x to 6x. An increase in velocity means demand for stablecoin transactions is outpacing new issuance, and the existing supply is working harder.
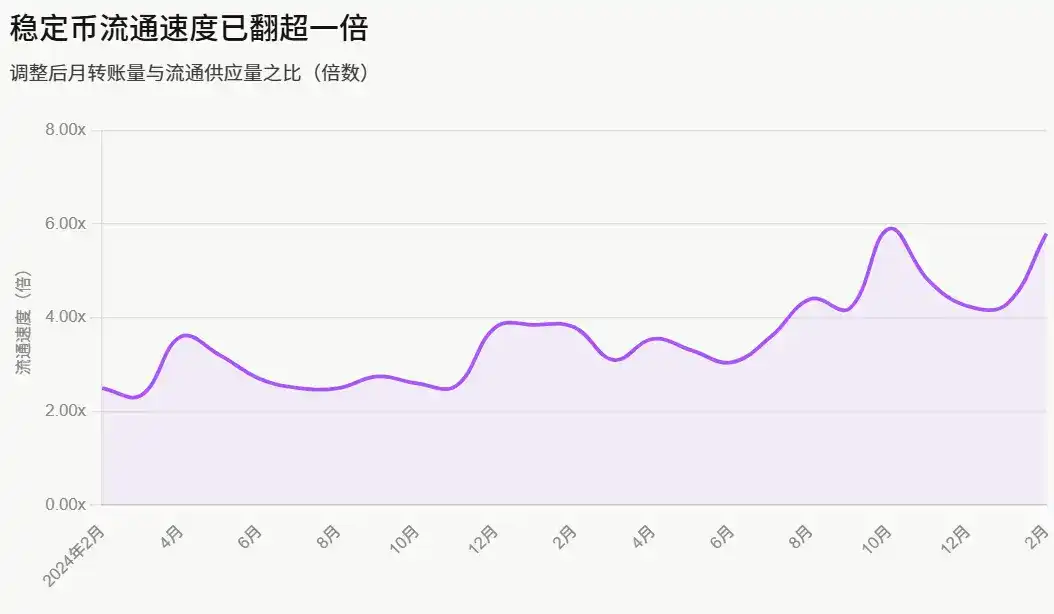
This is a hallmark of a true payment network—the base currency is being actively used, not just held.

Stablecoin Volume Reflects More Payments

If trading, fund flows, and exchange mechanisms—which make up the bulk of stablecoin transactions—are excluded, the estimated total for payments between different entities last year was still between $350 billion and $550 billion.

By volume, the Business-to-Business (B2B) sector dominates stablecoin payments (unsurprising given its scale). But other sectors, such as direct Consumer-to-Consumer (C2C) payments and interactions with merchants, are also expanding rapidly.

Stablecoin Payments are Currently Concentrated in Specific Regions

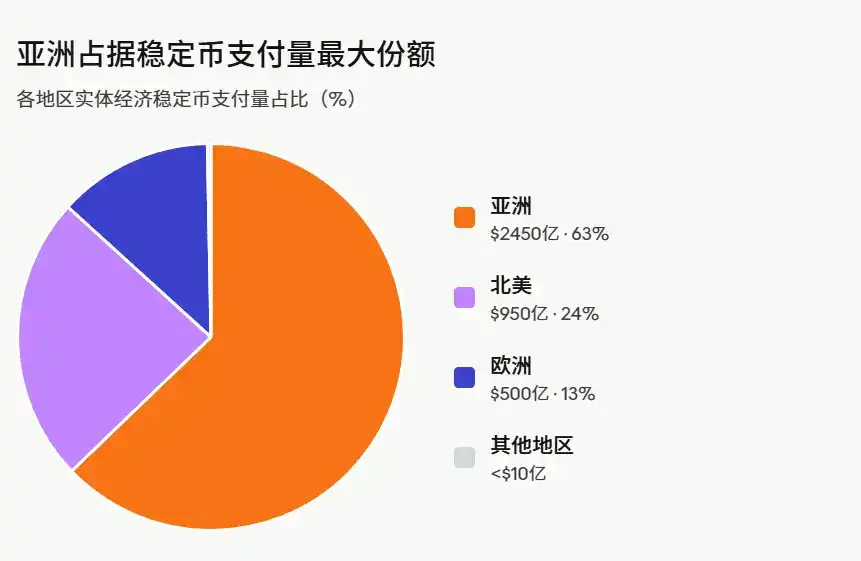
Geographically, stablecoin payment activity is not evenly distributed.

Nearly two-thirds of the transaction volume comes from Asia, primarily concentrated in Singapore, Hong Kong, and Japan.

North America accounts for about a quarter. Europe's share is around 13%. Latin America and Africa together make up only a very small portion, less than $1 billion.
Not Just Cross-Border Payments, But Local Currencies on Global Rails

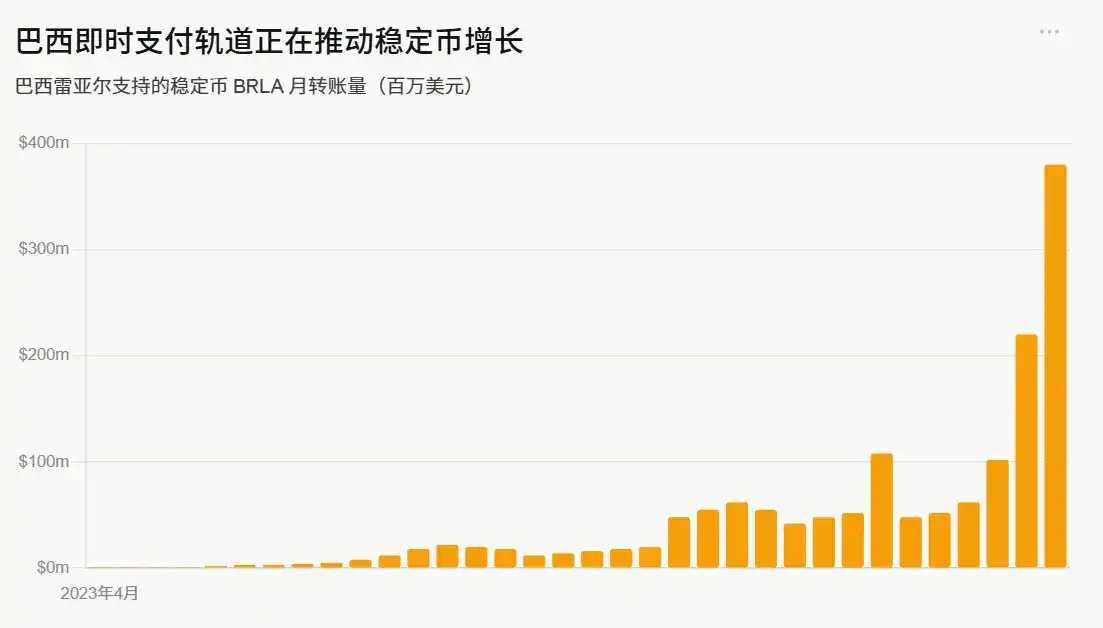
The development of non-dollar stablecoins is not limited to Europe; it is also evident in emerging markets, driven by various factors.

Brazil is a prime example. The monthly transfer volume of BRLA (a stablecoin backed by the Brazilian Real) has grown from nearly zero in early 2023 to about $400 million per month by early 2026. Access to the PIX instant payment network has driven its adoption.
Although stablecoins are often described as cross-border tools, the proportion of cross-border activity has actually been declining, not rising.

Domestic transactions (stablecoin transfers occurring within the same country/region) have grown from about half of the payment volume in early 2024 to nearly three-quarters by early 2026. What does this mean? Stablecoins are not only establishing themselves as remittance or forex tools but also becoming a local payment medium running on global infrastructure.
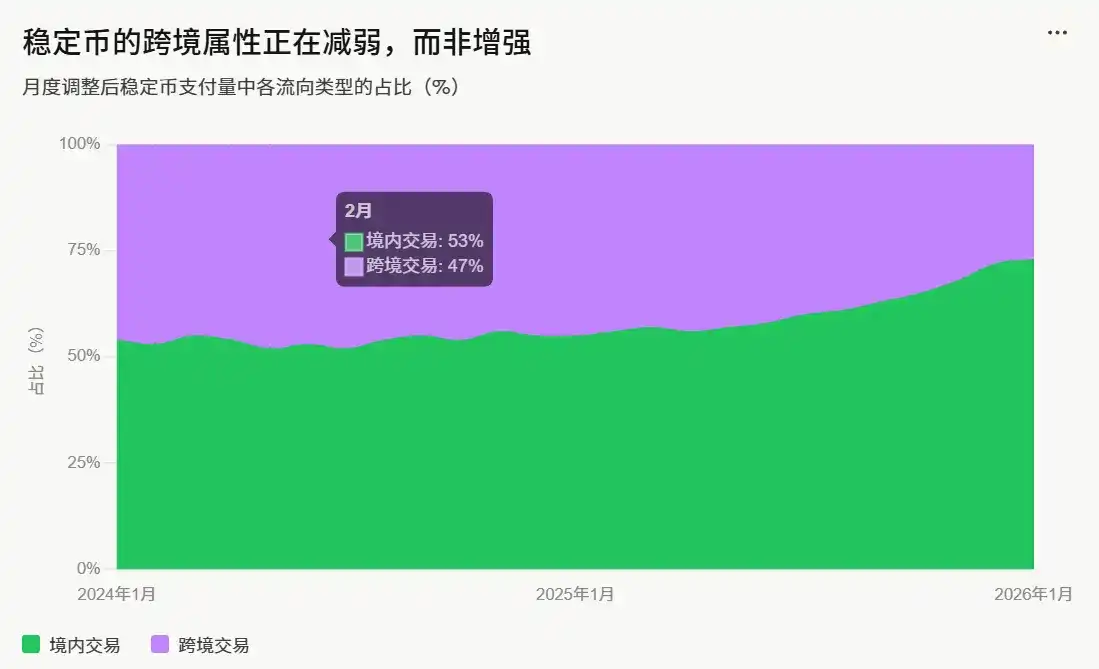
Putting all these factors together, a clear picture emerges, though it's not the one most people expected: many thought stablecoins would be purely focused on cross-border transactions. Instead, they are becoming increasingly localized.

While the US dollar remains the core f币锚定 for the vast majority of stablecoins, stablecoins are by no means simply an export of the dollar. Non-dollar variants, such as euro-backed and Brazilian real-backed local currency stablecoins, are gaining popularity.

Although peer-to-peer (C2C) stablecoin transfers far exceed other types of payment flows in quantity, increasingly usage is flowing towards everyday consumption (C2B).

Each quarter's data provides more evidence that stablecoins are developing into general-purpose payment infrastructure. They are global by design but increasingly local in practice.

It's still early days. But the shape of this system is becoming clearer.

İlgili Sorular

QWhat was the impact of the GENIUS Act on stablecoin trading volume in the US?

AThe GENIUS Act established the first federal-level framework for stablecoin issuance in the US. Before its passage, adjusted trading volume had been increasing for several consecutive quarters. After its enactment, growth accelerated further, reaching approximately $4.5 trillion in Q1 2026.

QWhich region accounts for the largest share of stablecoin payment volume, and which specific areas are the main contributors?

AAsia accounts for nearly two-thirds of the stablecoin payment volume. The main contributors are Singapore, Hong Kong, and Japan.

QWhat is the most significant structural change in how people use stablecoins, as indicated by transaction growth?

AThe most significant structural change is the growth in Consumer-to-Business (C2B) stablecoin transactions. This category saw the fastest growth, more than doubling (+128%) from 124.9 million transactions in 2024 to 284.6 million in 2025.

QWhat does the increasing velocity of stablecoins indicate about their use?

AThe increasing velocity of stablecoins, which nearly doubled from 2.6x to 6x since early 2024, indicates that the demand for stablecoin transactions is outpacing new issuance. It means the existing supply is circulating more frequently, which is a hallmark of a genuine payment network where the base currency is being actively used, not just held.

QContrary to common belief, what trend is observed in the proportion of cross-border stablecoin activity?

AContrary to the common belief that stablecoins are primarily for cross-border transactions, the proportion of cross-border activity has actually been decreasing. Domestic transactions (stablecoin transfers within the same country/region) grew from about half of the payment volume in early 2024 to nearly three-quarters by early 2026.

İlgili Okumalar

Interview with Robinhood Executive: Meme + Tokenized US Stocks as "Barbell" Customer Acquisition Strategy, All Business Lines Achieve Hundreds of Millions in Revenue

Interview with Robinhood executive Johann Kerbrat reveals the company's "barbell" customer acquisition strategy for its new Robinhood Chain, combining meme tokens with tokenized stocks. Three weeks after mainnet launch, the chain has seen over $3B in weekly DEX volume and 105M transactions. Kerbrat explains the logic behind the permissionless chain: meme tokens attract DeFi users, while tokenized real-world assets (RWA), currently over 90 US stocks and ETFs accessible in 120+ countries, serve global users. The goal is to bring Robinhood's 27 million funded accounts on-chain by simplifying DeFi with a user-friendly interface, exemplified by features like Robinhood Earn which offers yield without requiring wallet management. Built on Arbitrum's technology stack for its speed, low cost, and Ethereum's security, the chain focuses on financial products like Earn, spot trading, and perpetuals. Kerbrat downplays direct competition with platforms like Base, emphasizing the goal of expanding the overall market for on-chain assets. He details selective partnerships (e.g., Morpho, Lighter) based on compliance, unique UX, and differentiation. While regulatory clarity is pending for US perpetuals, the expansion continues via Bitstamp in Europe. Finally, Kerbrat positions Robinhood as a "super app" integrating stocks, options, crypto, banking, and AI trading, with all major business lines generating hundreds of millions in revenue. For the chain, current priority is driving adoption over maximizing gas fee revenue.

marsbit1 saat önce

Interview with Robinhood Executive: Meme + Tokenized US Stocks as "Barbell" Customer Acquisition Strategy, All Business Lines Achieve Hundreds of Millions in Revenue

marsbit1 saat önce

Fidelity Q3 Report: BTC, ETH, and SOL Continue to Build Bottoms; How Much Further Will This Crypto Bear Market Go?

Fidelity's Q3 Crypto Signal Report analyzes the current bear market, noting Bitcoin (BTC), Ethereum (ETH), and Solana (SOL) are in a prolonged bottoming phase. Key indicators like the weighted Net Unrealized Profit/Loss (NUPL) have turned negative (-0.01), signaling the market is slightly below its aggregate cost basis, with BTC acting as the primary stabilizing asset. BTC's dominance has risen to 68%, indicating a lack of capital rotation to other digital assets. Performance has been weak across the board, with BTC, ETH, and SOL down significantly year-to-date. Market sentiment is depressed, exacerbated by substantial outflows from spot ETPs and a challenging macro environment. The report compares the current ~203-day downtrend to historical ~300-day bottoming cycles, suggesting the process may be two-thirds complete, with late 2026 as a potential timeframe to monitor. For Bitcoin, NUPL at 0.09 indicates cautious sentiment, while momentum signals remain negative. The Yardstick metric points to potential undervaluation relative to network security (hashrate). Ethereum's NUPL is deep in the "capitulation" zone at -0.43, a historically positive signal for future returns, though its momentum and network fee revenue are negative. Solana shows the deepest NUPL at -0.72 but demonstrates relative resilience in on-chain activity and stablecoin transfer volume. The report concludes that while several metrics are near historical capitulation levels, a definitive market bottom has not yet been established. The path forward likely involves continued consolidation, with BTC's relative strength and fundamental on-chain usage for ETH and SOL providing key areas for investor observation.

marsbit1 saat önce

Fidelity Q3 Report: BTC, ETH, and SOL Continue to Build Bottoms; How Much Further Will This Crypto Bear Market Go?

marsbit1 saat önce

İşlemler

Spot
活动图片