a16z Brief: Prediction Markets Set a Record for the Third Consecutive Week, Weekly Trading Volume Surpasses $14.4 Billion for the First Time

marsbit2026-06-30 tarihinde yayınlandı2026-06-30 tarihinde güncellendi

Özet

A16z Crypto's weekly report highlights record-breaking activity in prediction markets. For the third consecutive week, total weekly trading volume hit a new all-time high, surpassing $14.4 billion for the first time, a significant jump from the $5-6 billion range seen earlier this year. Aggregate open interest also reached a new weekly record of $1.6 billion, marking its third straight week of growth. This metric, which reflects the total value of unsettled bets, has increased roughly 8-fold since last autumn, indicating sustained capital inflow. While events like the World Cup drove initial interest, growth has expanded beyond sports. Non-sports categories—including politics, economics, and geopolitics—achieved a weekly volume of $3.6 billion across platforms like Kalshi and Polymarket. This figure now exceeds the entire prediction market's weekly volume (including sports) from last year. Since July 2025, non-sports trading volume has grown approximately 18-fold, with acceleration notably steepening recently.

Author: Robert Hackett

Compiled by: Deep Tide TechFlow

Deep Tide Introduction: According to data from the a16z Crypto brief, weekly trading volume in prediction markets surpassed $14.4 billion for the first time last week, setting a new all-time high for the third consecutive week. At the beginning of the year, this figure was only around $5-6 billion. Even more noteworthy is the non-sports category—covering politics, economics, geopolitics—which reached $3.6 billion in a single week, exceeding the total weekly volume (including sports) for the entire market last year. While the World Cup has driven attention and funds, the growth has long extended beyond sports betting.

Last week, weekly trading volume in prediction markets surged to $14.4 billion for the first time. At the start of the year, this number was still around $5-6 billion. The previous all-time high (approximately $10 billion) was set just a week prior.

Aggregated across all platforms, current trading volume is over 10 times higher than it was a year ago.

Caption: Trend of weekly trading volume in prediction markets, reaching $14.4 billion last week, compared to around $5-6 billion at the start of the year.

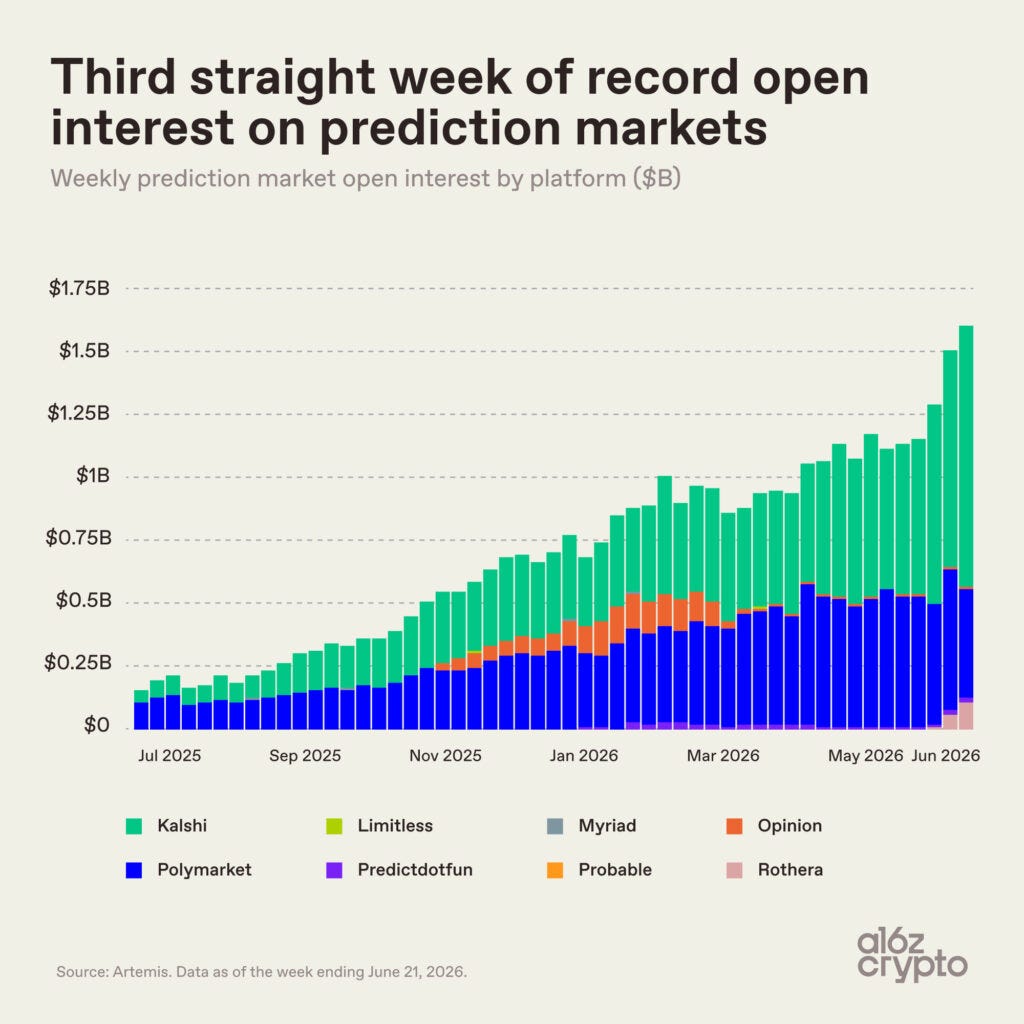
Open interest (the total value of unsettled positions) reached $1.6 billion last week, setting a new weekly record for the third consecutive week.

Unlike trading volume, open interest only increases when the rate of new positions being opened outpaces the settlement of old ones. Therefore, an upward trend in this curve indicates that more real money is being committed to these markets.

Since last fall, this curve has been steadily climbing. During this period, open interest has increased approximately eightfold, rising from less than $200 million to $1.6 billion.

Caption: Open interest has grown about 8 times since last fall, increasing from under $200 million to $1.6 billion.

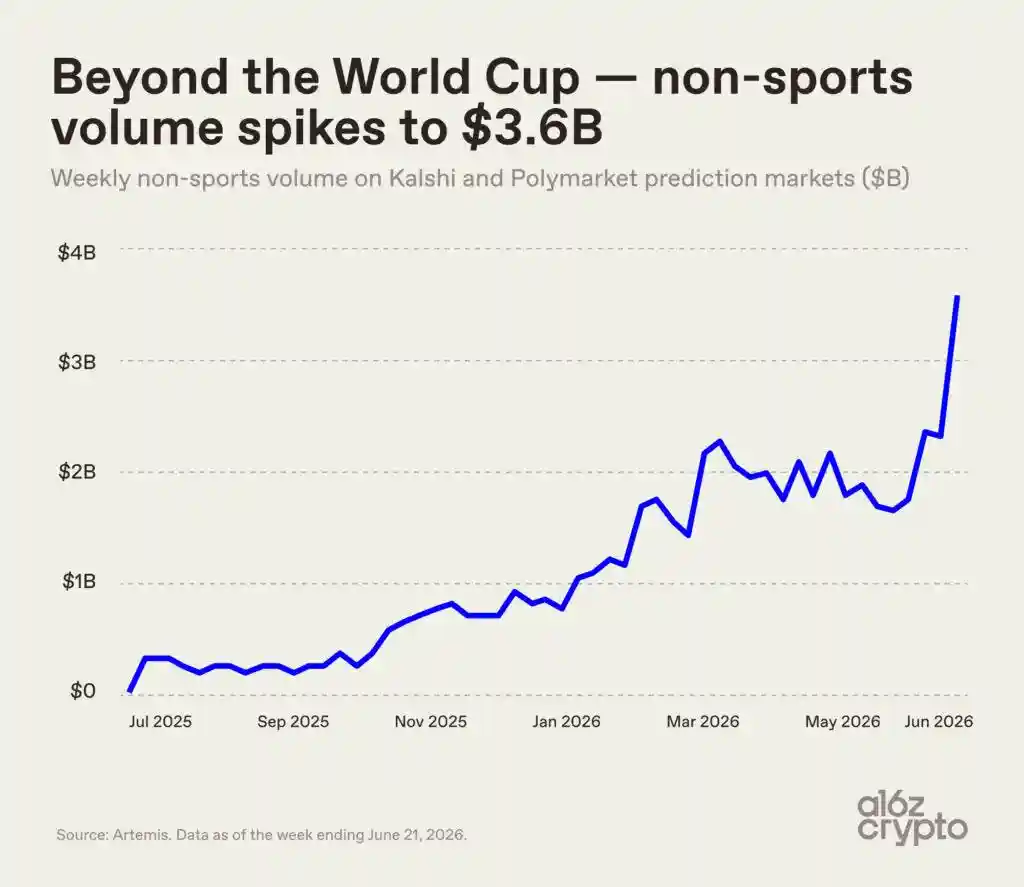
While the World Cup has absorbed significant attention and capital, other sectors have also risen alongside it. Non-sports trading volume—encompassing categories like politics, economics, geopolitics, and current events—reached $3.6 billion last week combined on the Kalshi and Polymarket platforms. This figure is larger than the total weekly volume for the entire prediction market (including sports) last year.

In July 2025, weekly non-sports trading volume was only around $200 million. It has since grown approximately 18-fold, with the slope of the curve noticeably steepening this month.

Acknowledgments: Data and charts provided by Ryan Holloway and Robert Hackett (a16z crypto special feature editor and head of special projects).

İlgili Sorular

QAccording to the a16z Crypto data report, what milestone did the weekly trading volume of prediction markets reach last week?

AThe weekly trading volume of prediction markets reached a new record, exceeding $14.4 billion for the first time.

QHow does the article describe the growth in non-sports trading volumes (covering politics, economics, etc.)?

ANon-sports trading volume reached $3.6 billion last week on Kalshi and Polymarket combined, which is larger than the entire prediction market's weekly volume (including sports) last year. It has grown approximately 18-fold since July 2025.

QWhat does the sustained growth in open interest indicate about the prediction markets, according to the article?

AThe steady climb in open interest, which has grown about 8-fold from under $200 million to $1.6 billion since last fall, indicates that real money is flowing into these markets as new positions are being opened faster than old ones are being settled.

QWhat was the approximate weekly trading volume for prediction markets at the beginning of the year, as mentioned in the article?

AAt the beginning of the year, the weekly trading volume for prediction markets was approximately $5-6 billion.

QWhich major event is credited with initially boosting attention and capital in prediction markets, although growth has expanded beyond it?

AThe World Cup is credited with absorbing a lot of attention and capital, but growth has since expanded far beyond sports betting.

İlgili Okumalar

Earning Six Figures and Still Struggling to Rent in San Francisco

A couple in San Francisco with a combined tech income over $360,000 struggled for months to find a one-bedroom apartment under $5,000 per month. Their story highlights how the AI wealth boom, driven by upcoming IPOs from companies like OpenAI and Anthropic, is dramatically escalating the city's cost of living. Even six-figure salaries are becoming insufficient for a comfortable lifestyle. The article details the financial reality for tech workers earning around $180,000 annually. After taxes, retirement contributions, and healthcare, take-home pay is roughly $7,000 per month. With average rents exceeding $3,800 and one-bedrooms often costing $4,500-$5,200, discretionary income shrinks to $1,500-$2,500. This contrasts sharply with reported median total compensations of $640,000 at OpenAI and $420,000 at Anthropic. The AI gold rush is identified as the primary driver. The scale of potential wealth from these IPOs, far surpassing previous tech booms, is flooding the housing market. Data shows San Francisco's average rent is now the highest in the U.S., with vacancy rates in desirable neighborhoods plummeting to around 3%. The overall cost of living is 65.6% above the national average. The piece features multiple professionals, including a 25-year-old with a $250,000 salary, facing housing instability, fierce competition for rentals, and a persistent, low-grade financial anxiety despite high earnings. It concludes that the rapid concentration of AI wealth is redefining what constitutes a "high salary" in San Francisco, pushing out mid-tier tech talent and creating a stark divide between those in the AI sector and everyone else.

marsbit17 dk önce

Earning Six Figures and Still Struggling to Rent in San Francisco

marsbit17 dk önce

Rate Hikes to Save STRC, Selling Bitcoin to Preserve Credit: Strategy Picks Its Two Most Expensive Paths

Over the past six weeks, Strategy has faced a significant crisis of confidence, with its core securities MSTR and STRC experiencing sharp price declines. The situation escalated as the company utilized dollar reserves intended for dividends and interest payments to repurchase debt, and then sold a small amount of Bitcoin for the first time since 2022—an action that contradicted its "never sell" narrative and signaled potential liquidity strain. In response, Strategy introduced a Digital Credit capital framework. This formalized a series of measures to manage the pressure down its capital structure: ordinary shareholders have already borne costs through equity dilution from an $11.5 billion ATM offering; new rules enforce a hard dollar reserve covering at least 12 months of expected dividend and interest payments; the STRC dividend rate was increased from 11.5% to 12%; and, most notably, Bitcoin was officially integrated into the capital toolkit, with board authorization to sell up to $1.25 billion worth if needed to support obligations and repurchase programs. The market reacted with a mix of relief and skepticism. While the announcement triggered a sharp single-day rally in both MSTR and STRC, the preferred shares still trade at a significant discount. Supporters view the framework as pragmatic crisis management that provides a price floor and clearer rules. Critics argue that institutionalizing Bitcoin sales undermines the core investment thesis and, with Bitcoin's price below the company's average cost basis, amounts to selling assets at a loss to maintain its financial structure. The broader context shows institutional Bitcoin buying drying up, highlighting that Strategy's challenges and new framework are now a key indicator for overall market risk sentiment. Ultimately, the framework buys time, but STRC's return to par value depends on market belief in the company's ability to cover dividends without further dilution or substantial Bitcoin sales—a task that would be easier if Bitcoin's price recovers.

链捕手23 dk önce

Rate Hikes to Save STRC, Selling Bitcoin to Preserve Credit: Strategy Picks Its Two Most Expensive Paths

链捕手23 dk önce

Has Bitcoin Bottomed? Unpacking 12 Key Data Indicators

Author: BitalkNews **Title: Has Bitcoin Bottomed? Analyzing 12 Key Data Indicators** The current Bitcoin price is around $59,600, representing a maximum drawdown of approximately 53% from the 2025 high. The market is in a deep correction phase. Multiple indicators suggest valuations are nearing historical lows, but a confirmed bottom requires more time. **Summary of Key Indicators:** 1. **Fear & Greed Index:** At 16, indicating "Extreme Fear," similar to levels seen during the 2022 FTX collapse. 2. **Rainbow Chart:** BTC has fallen into the "Bitcoin is dead" zone, only the second such occurrence historically. 3. **MVRV Ratio:** Currently around 1.13, near the lower historical band, pointing to a bottoming valuation area (approx. $53,200-$53,400). 4. **Realized Price:** The aggregate cost basis is ~$53,400; the current price is only about 12% above it but hasn't broken below yet. 5. **UTXO Profit/Loss Ratio:** Has dropped to its lowest level this cycle, signaling a potential "capitulation" event often seen near cycle bottoms. 6. **Long-Term Holder SOPR:** For holders >155 days, it's at 0.662, now negative, indicating seasoned investors are selling at a loss. 7. & 8. **Miner Health:** ~20% of miners are unprofitable, and actual miner revenue is below theoretical levels, indicating ongoing miner stress. 9. **ETF Flows:** U.S. spot BTC ETFs have seen sustained net outflows, including a 13-day streak with over $1.7B in weekly outflows. 10. **Strategy Risk:** Strategy's stock premium has significantly contracted, pressuring the traditional "borrow-to-buy" model. 11. **Bear Duration & Drawdown:** The correction has lasted >265 days with a ~52.5% drawdown, shorter in depth but lengthy in duration. 12. **Market Expectations (Polymarket):** Betting markets suggest an ~80% probability of BTC falling below $55,000 and a notable chance below $50,000. **Conclusion:** Bitcoin is in a deep correction with potential bottom formation. Valuation metrics are in historically low ranges, and on-chain capitulation signals are accumulating. However, a complete shakeout isn't finished—the realized price hasn't been breached, and ETF demand hasn't reversed. The area below $60,000 holds long-term appeal, but patience is advised. Key signals to watch for include a return to ETF inflows, a recovery in the Long-Term Holder SOPR, and easing miner pressure.

marsbit31 dk önce

Has Bitcoin Bottomed? Unpacking 12 Key Data Indicators

marsbit31 dk önce

Valuation Inversion Emerges, Bitcoin Treasury Companies Face Trust Crisis

"Valuation Inversion Emerges, Sparking Trust Crisis for Bitcoin Treasury Firms" The investment thesis for corporate Bitcoin treasury stocks has fundamentally shifted. Investors are no longer rewarding companies simply for accumulating more Bitcoin. Instead, the focus is now on net Bitcoin per share, with intense scrutiny on whether new financings truly benefit existing shareholders or merely dilute their stake. Key indicators highlight the new reality. Metaplanet's market capitalization has fallen below the total value of its Bitcoin holdings, indicating a valuation discount. While MicroStrategy maintains a premium, its core metric—Bitcoin per diluted share for common shareholders—has been declining due to dilution from financing activities, primarily through its STRAT permanent preferred shares. This marks a transition from a pure "asset accumulation" phase to an "equity attribution" phase. Investors now deduct costs like preferred dividends and debt to calculate the actual Bitcoin claim for common equity. The widespread adoption of spot Bitcoin ETFs has removed the scarcity value these stocks once held, forcing them to justify their structure with superior leverage, dividends, or capital efficiency. European entrants like France's Capital B and Sweden's BTC AB are testing this new environment with ambitious funding plans backed by relatively small Bitcoin holdings. They are asking investors to bear complex capital structures, betting future Bitcoin purchases will cover all dilution and dividend costs. The sector's core risk is a broken financing loop. Once a company's stock trades below its Bitcoin net asset value, it loses the ability to issue equity for accretive purchases. It is then left with unpalatable choices: dilutive financing at a discount, venturing into new businesses like Bitcoin lending, or selling assets. The winners in this next phase will be those that demonstrably increase Bitcoin per share for common shareholders with every financing move.

Foresight News1 saat önce

Valuation Inversion Emerges, Bitcoin Treasury Companies Face Trust Crisis

Foresight News1 saat önce

İşlemler

Spot
活动图片