A Repeat Of February? Watch Out For These Bitcoin Price Levels In March

bitcoinist2026-02-28 tarihinde yayınlandı2026-02-28 tarihinde güncellendi

Özet

The Bitcoin price had a disappointing performance in February, struggling to sustain a break above the $70,000 level and facing sharp reversals after briefly reaching $71,000. A market analyst highlights several key price levels to watch in March. The strongest support is the realized price at approximately $54,600, which has historically acted as a critical floor. On the upside, significant resistance levels include the 1-4 Week Realized Price at $71,600, where recent buyers may look to exit at break-even. A decisive break above the Short-Term Holder Realized Price (STH RP) at $90,800 could signal a shift from a bearish to a bullish trend. Further resistance exists at the 365-day Simple Moving Average ($98,900) and the 3-6 Month Realized Price (~$100,800). Bitcoin is currently in a bearish phase and must overcome these resistance levels for a meaningful recovery. As of the time of writing, BTC is trading around $63,696, down over 5% in 24 hours.

The Bitcoin price performance was quite disappointing over the past month. The flagship cryptocurrency has struggled to break sustainably above $70,000 throughout February, with prices only reaching $71,000 before facing sharp reversals.

It, then, becomes intuitively evident that this price region might be a key level acting as resistance to Bitcoin’s bullish attempts. Below are some other crucial levels to watch for in March and what they could potentially mean for the Bitcoin price.

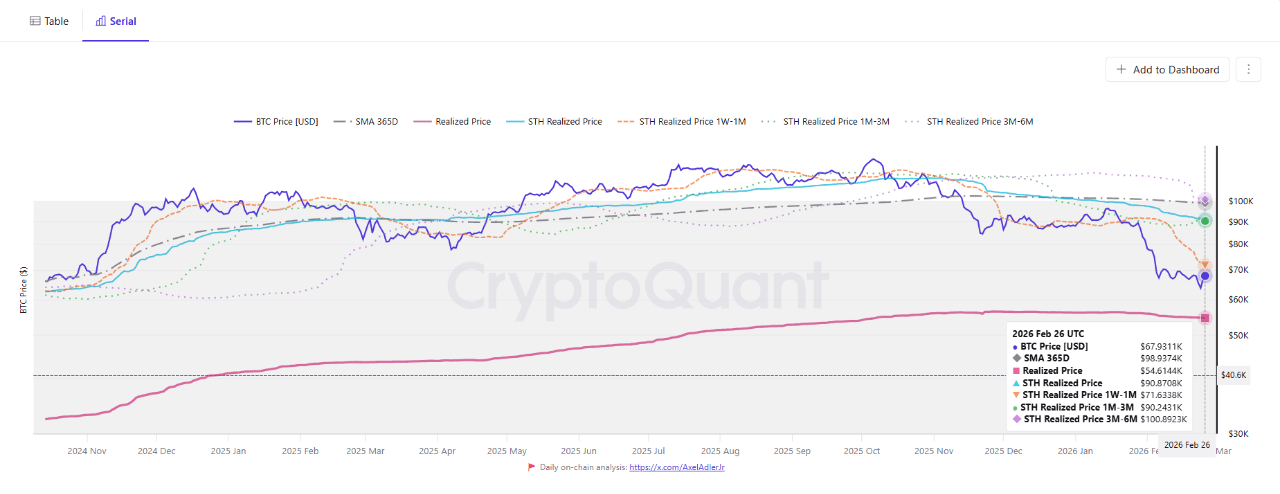
BTC Realized Price Sits At $54,600 – What This Means

In a Quicktake post on the CryptoQuant platform, market analyst Burak Kesmeci highlighted five “cost clusters” that might reveal the next move for the Bitcoin price. For context, Cost clusters are essentially price levels that represent the average acquisition price of an asset (Bitcoin, in this case) by different investor cohorts

To start with, Kesmeci immediately revealed Bitcoin’s surest support price — the realized price — to be around the $54,600 mark. The realized price is a strong support region because it reflects the average cost basis of all the BTC in circulation.

Source: CryptoQuant

Also, realized prices have historically served as long-term price support during bear phases. As a result, when the Bitcoin price trades above this level, it is often a sign of extant structural strength, while a break beneath the realized price is usually a sign of impending doom.

Bitcoin Could Switch Bullish In March — But On This Condition

While the Bitcoin price may be displaying its higher timeframe backing, it is also true that the world’s leading cryptocurrency has a series of battles to fight as it ascends. According to the crypto pundit, four resistance zones lie in wait to reject possible upward recovery.

The first of these zones is the 1 – 4-Week Realized Price, which reveals the average price at which recent buyers entered the BTC market. According to the highlighted CryptoQuant data, this cost basis stands at around the $71,600 level.

When the Bitcoin price trades beneath this level, it signals that the latest participants are under severe heat. Hence, recovery attempts towards this price level would typically be met with significant resistance, as this cohort would want to exit at break-even.

The analyst further highlighted that the Short-Term Holder Realized Price (STH RP) is around $90,800; this concerns investors who have held BTC for less than 155 days. If the Bitcoin price manages to overcome the evident resistance at this level, it could signal a change in Bitcoin’s trend from bearish to bullish.

Beyond the STH RP, the 365-day Simple Moving Average sits, occupying the $98,900 price level; then, a little more up North, the 3–6 Month Realized Price stands around $100,800. These metrics reflect the activity of Bitcoin’s medium-term holders, showing their realized price and average closing prices over the past year.

In the grand scheme, Bitcoin is clearly in a bearish phase. Thus, before March can stand as the pivotal month for market participants, BTC has to overcome those critical resistance levels. As of this writing, Bitcoin is valued at around $63,696, reflecting an over 5% decline in the past 24 hours.

The price of BTC on the daily timeframe | Source: BTCUSDT chart on TradingView

İlgili Sorular

QWhat is the realized price of Bitcoin and why is it considered a strong support level?

AThe realized price of Bitcoin is around $54,600. It is considered a strong support level because it reflects the average cost basis of all the BTC in circulation and has historically served as long-term price support during bear phases.

QWhat is the four resistance zones that Bitcoin needs to overcome for an upward recovery according to the analyst?

AThe four resistance zones are: the 1-4 Week Realized Price at ~$71,600, the Short-Term Holder Realized Price (STH RP) at ~$90,800, the 365-day Simple Moving Average at ~$98,900, and the 3-6 Month Realized Price at ~$100,800.

QWhat could a break above the Short-Term Holder Realized Price (STH RP) signal for Bitcoin's trend?

AIf the Bitcoin price manages to overcome the resistance at the Short-Term Holder Realized Price (~$90,800), it could signal a change in Bitcoin's trend from bearish to bullish.

QWhy would the 1-4 Week Realized Price level act as significant resistance for Bitcoin's price?

AThe 1-4 Week Realized Price (~$71,600) reveals the average price at which recent buyers entered the market. When the price is below this level, these buyers are at a loss, so they are likely to sell at break-even, creating significant selling pressure and resistance.

QWhat was the Bitcoin price performance like in February and what is its value as of the writing of the article?

AIn February, Bitcoin struggled to break sustainably above $70,000, only reaching $71,000 before facing sharp reversals. As of the writing of the article, Bitcoin is valued at around $63,696, reflecting an over 5% decline in the past 24 hours.

İlgili Okumalar

The Value Distribution of Stablecoins

**Summary: The Value Distribution of Stablecoins** The article argues that stablecoins are evolving from mere trading tools into broader channels for dollar access. It divides the stablecoin ecosystem into four layers to analyze how value is distributed: 1. **Issuance Layer:** Mints stablecoins, holds reserve assets, and captures the spread between reserve yield and user costs (e.g., Tether, Circle). This layer currently earns the largest profit margin. 2. **Infrastructure Layer:** Connects stablecoins to the traditional financial system, handling fiat on/off-ramps, banking integration, compliance (KYC/AML), and asset management (e.g., Bridge, BVNK). This is the "unglamorous" but critical work, building the essential bridges between crypto and real-world finance. 3. **Acquiring/Distribution Layer:** Integrates stablecoins into merchant systems, manages payment flows, and provides enterprise financial software (e.g., Stripe, Coinbase). They act as the access point for businesses. 4. **Application Layer:** The end-users and businesses that ultimately use stablecoins for payments, settlements, or as a store of value. They benefit from convenience but have little pricing power. The core thesis is that while the issuance layer currently dominates profits, the often-overlooked **infrastructure layer holds significant long-term potential**. The real challenge and barrier to mass adoption is not the on-chain transfer of stablecoins (which is simple), but the complex "last mile" integration into existing business workflows, banking systems, and regulatory frameworks across different countries. Companies in this layer are currently in a "land grab" phase, investing heavily to build networks, secure bank partnerships, and establish compliance pathways. While their position is currently pressured by the profitable issuers above and distribution platforms below, the article suggests that if stablecoins become a default financial rail for businesses, the infrastructure providers who have done the hard work of integration will ultimately gain strong pricing power and become entrenched, essential players.

marsbit5 saat önce

The Value Distribution of Stablecoins

marsbit5 saat önce

The Value Distribution of Stablecoins

The Value Distribution of Stablecoins The article argues that stablecoins are evolving from a mere trading tool into a broad "dollar channel." It analyzes the industry's value chain through four layers: 1. **Issuance Layer (e.g., Tether, Circle):** The top layer that mints stablecoins, holds reserve assets, and captures the thickest interest rate spread. 2. **Infrastructure Layer (e.g., Bridge, BVNK):** Connects stablecoins to the traditional financial system, handling critical but complex "dirty work" like fiat on/off-ramps, banking integration, compliance (KYC/AML), and cross-border settlement. 3. **Acquiring/Distribution Layer (e.g., Stripe, Coinbase):** Embeds stablecoins into merchant systems, manages payment flows, and integrates with enterprise software. 4. **Application Layer:** End-users and businesses that ultimately use stablecoins for payments, settlement, or storing value. The author posits that while the issuance layer currently captures the most profit, the most overlooked and potentially critical layer is infrastructure. The core challenge for stablecoin adoption isn't the on-chain transfer (which is simple), but bridging the gap between blockchain and the real-world financial system. This involves solving practical problems for businesses: fiat conversion, reconciliation, tax handling, and user onboarding. Infrastructure companies are currently in a difficult "land-grab" phase—building networks, securing banking relationships, and achieving compliance country-by-country. They face pressure from both the profitable issuance layer above and distribution platforms below. However, the author suggests this layer is building a crucial moat. Once stablecoins become a default business rail, the infrastructure players who have done the hard work of integration may gain significant, durable value and pricing power.

链捕手5 saat önce

The Value Distribution of Stablecoins

链捕手5 saat önce

İşlemler

Spot
Futures

Popüler Makaleler

F Nasıl Satın Alınır

HTX.com’a hoş geldiniz! Synfutures (F) satın alma işlemlerini basit ve kullanışlı bir hâle getirdik. Adım adım açıkladığımız rehberimizi takip ederek kripto yolculuğunuza başlayın. 1. Adım: HTX Hesabınızı OluşturunHTX'te ücretsiz bir hesap açmak için e-posta adresinizi veya telefon numaranızı kullanın. Sorunsuzca kaydolun ve tüm özelliklerin kilidini açın. Hesabımı Aç2. Adım: Kripto Satın Al Bölümüne Gidin ve Ödeme Yönteminizi SeçinKredi/Banka Kartı: Visa veya Mastercard'ınızı kullanarak anında Synfutures (F) satın alın.Bakiye: Sorunsuz bir şekilde işlem yapmak için HTX hesap bakiyenizdeki fonları kullanın.Üçüncü Taraflar: Kullanımı kolaylaştırmak için Google Pay ve Apple Pay gibi popüler ödeme yöntemlerini ekledik.P2P: HTX'teki diğer kullanıcılarla doğrudan işlem yapın.Borsa Dışı (OTC): Yatırımcılar için kişiye özel hizmetler ve rekabetçi döviz kurları sunuyoruz.3. Adım: Synfutures (F) Varlıklarınızı SaklayınSynfutures (F) satın aldıktan sonra HTX hesabınızda saklayın. Alternatif olarak, blok zinciri transferi yoluyla başka bir yere gönderebilir veya diğer kripto para birimlerini takas etmek için kullanabilirsiniz.4. Adım: Synfutures (F) Varlıklarınızla İşlem YapınHTX'in spot piyasasında Synfutures (F) ile kolayca işlemler yapın.Hesabınıza erişin, işlem çiftinizi seçin, işlemlerinizi gerçekleştirin ve gerçek zamanlı olarak izleyin. Hem yeni başlayanlar hem de deneyimli yatırımcılar için kullanıcı dostu bir deneyim sunuyoruz.

211 Toplam GörüntülenmeYayınlanma 2024.12.21Güncellenme 2026.06.02

F Nasıl Satın Alınır

Tartışmalar

HTX Topluluğuna hoş geldiniz. Burada, en son platform gelişmeleri hakkında bilgi sahibi olabilir ve profesyonel piyasa görüşlerine erişebilirsiniz. Kullanıcıların F (F) fiyatı hakkındaki görüşleri aşağıda sunulmaktadır.

活动图片