A Bullish Pennant Just Appeared On The Dogecoin Monthly Chart, Here’s What To Expect

bitcoinist2026-03-10 tarihinde yayınlandı2026-03-10 tarihinde güncellendi

Özet

A massive bullish pennant pattern is forming on the Dogecoin (DOGE/USD) monthly chart, a development that began after the cryptocurrency's historic rally in 2021. The pattern started with a sharp "flagpole" surge that took DOGE from under $0.01 to its all-time high of $0.73. Since that peak, the price has been compressing between two converging trendlines, creating a symmetrical triangle with a series of lower highs and higher lows. The price is currently testing a critical juncture, trading near the lower, rising support trendline around $0.09. Holding this support is crucial for the pattern's validity; a monthly close below it would weaken the bullish outlook. For the pattern to confirm and trigger a significant breakout, DOGE must first push above the upper, descending trendline, which requires closing consecutive months above the $0.32 level. If a breakout occurs, the measured move target—calculated from the height of the 2021 flagpole—projects a substantial upward move. Conservative estimates suggest a target well above $1, with more optimistic projections reaching the $3 to $4 range.

Most traders are watching Dogecoin on the daily or weekly chart, reacting to intraday price action. However, the monthly candlestick chart tells a different story, one that has been developing since the 2021 cycle and is now approaching an inflection point.

Technical analysis shows a massive bullish pennant is forming on the DOGE/USD monthly timeframe. Dogecoin is now at a lower high support in the pennant, and the technical implications are significant.

Giant Pennant Has Been Forming Since The 2021 Rally

The monthly chart shows Dogecoin’s price compressing between two converging trendlines, forming what appears to be a large bullish pennant. The structure begins with the flagpole: the near-vertical surge that launched Dogecoin from below $0.01 to its all-time high of $0.73 in May 2021.

Since that peak, DOGE’s price action has been forming a symmetrical triangle on the monthly chart, a series of lower highs and higher lows converging steadily toward an apex. The upper boundary slopes downward from the peak reached during the 2021 surge, creating a descending resistance line that has rejected several major rallies since then.
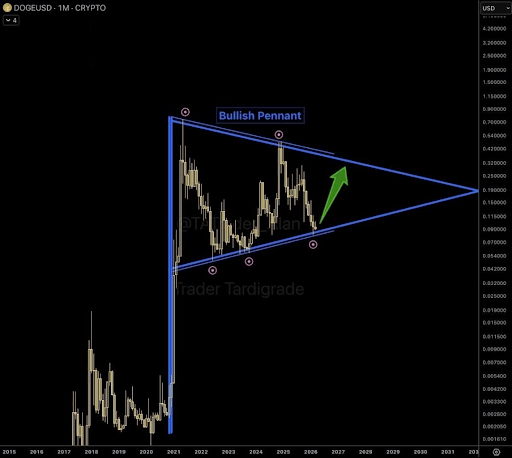
Source: Chart from TheMoonHailey on X

The lower boundary, on the other hand, rises gradually from the base that formed once the previous rally cooled to create a higher low. The lower trendline has provided consistent support, and critically, it held last month when the price tested the $0.08 zone.

As shown in the Dogecoin monthly candlestick chart below, these two lines have created a triangular formation that has continued to narrow since 2021. Multiple turning points on the chart show price reacting precisely at these boundaries, and the structure has been respected repeatedly over time.

Here’s What To Expect From The Bullish Pennant

One of the most important details in the chart is the most recent interaction with the lower trendline. Dogecoin dipped to the rising support boundary in February and bounced. That rebound occurred around the same area where Dogecoin has been trading recently, just below the $0.09 level.

At the time of writing, Dogecoin is trading at $0.094, still close to the support. Holding this support and closing above it in March is important for the structure because a bullish pennant depends on price remaining inside the converging boundaries. If DOGE were to close the month below the lower trendline, then the bullish outlook would weaken.

On the other hand, the bullish outlook depends on Dogecoin breaking above the upper end of the bullish pennant. The measured move target of a bullish pennant is calculated from the height of the flagpole, projected from the breakout point. Given the scale of Dogecoin’s 2021 flagpole, even conservative projections point well above $1, with upper-range targets in the $3 to $4 territory.

However, there is still much work to do for DOGE to return to the upper trendline before a breakout. Particularly, Dogecoin needs to push above $0.32 and close consecutive months above this level.

DOGE trading at $0.09 on the 1D chart | Source: DOGEUSDT on Tradingview.com

İlgili Sorular

QWhat pattern is forming on the Dogecoin monthly chart according to the article?

AA massive bullish pennant is forming on the DOGE/USD monthly timeframe.

QWhat was the starting point (flagpole) of this bullish pennant pattern?

AThe flagpole was the near-vertical surge that launched Dogecoin from below $0.01 to its all-time high of $0.73 in May 2021.

QWhat is the critical support level that Dogecoin recently tested and held?

ADogecoin recently tested and held the support at the lower trendline around the $0.08 zone in February.

QWhat is the significance of Dogecoin closing a month above the $0.32 level?

AClosing consecutive months above the $0.32 level is necessary for Dogecoin to push towards the upper trendline and attempt a breakout from the pennant.

QWhat is the potential price target if the bullish pennant pattern completes with a successful breakout?

AThe measured move target, based on the height of the 2021 flagpole, points well above $1, with upper-range targets in the $3 to $4 territory.

İlgili Okumalar

Why Bitcoin Holds Above $64,000 After Fed's Hard Pause

**Bitcoin Stabilizes Near $64,000 Following Hawkish Fed Pause** The cryptocurrency market, led by Bitcoin, remained stable around $64,000 despite a volatile reaction to the latest U.S. Federal Reserve meeting. The Fed paused interest rates but signaled a hawkish stance, with three committee members voting for an increase—the highest dissent since 2016. This limits risk appetite but hasn't triggered panic selling. Key market highlights include Bitcoin ETFs seeing a net inflow of $32.1 million, breaking a streak of outflows, while Ethereum ETFs experienced outflows of $18.65 million. Liquidations affected about 90,000 traders. Technically, Bitcoin finds support around $63,000-$63,500, with major resistance near $66,000. While its price is about 49% below its all-time high, institutional demand via ETFs and the absence of mass capitulation support a potential recovery scenario in the second half of the year. Major altcoins showed mixed movements, with Solana attracting capital while Ethereum faced selling pressure despite strong on-chain metrics like a growing staking queue. Regulatory news took a pause as the U.S. Senate delayed the CLARITY Act vote until at least autumn. For the final trading day of July, U.S. inflation and consumer spending data will be crucial. Bitcoin's key levels to watch are $63,000 support and $66,000 resistance. Sustained ETF inflows and Bitcoin holding above $63,000 are seen as positive signs for a potential market recovery later in the year.

cryptonews.ru1 saat önce

Why Bitcoin Holds Above $64,000 After Fed's Hard Pause

cryptonews.ru1 saat önce

Participants in XRP Fraud Scheme That Stole $9 Million from 71 Investors Arrested

South Korean police have arrested three individuals accused of operating a fraudulent investment platform that stole approximately 3.4 million XRP (worth about $9 million) from 71 investors between October 16 and 23. The suspects promoted the site Fxrpntwork.com through blogs, online articles, and YouTube videos, promising guaranteed principal and monthly returns of 1.5% to 1.8%. Investors were instructed to transfer XRP from Korean exchanges to overseas platforms and then to wallets controlled by the group before the site was shut down. The scammers copied the branding of legitimate projects Flare Network and FXRP to appear credible. Authorities warn that such impersonation frauds, which use familiar branding and urgent promises of guaranteed profits, are a common red flag. Legitimate companies do not solicit cryptocurrency transfers through unsolicited promotions. Seoul police have issued an Interpol Red Notice for a fourth suspect abroad and are investigating others involved in creating and promoting the fraudulent website. While investigators froze 17.3 billion won in assets, approximately 10 billion won was moved during the probe, with wallet analysis revealing transfers totaling 27.3 billion won, suggesting there may be additional unidentified victims and accomplices. The case underscores the organized, cross-border nature of crypto investment fraud.

cryptonews.ru1 saat önce

Participants in XRP Fraud Scheme That Stole $9 Million from 71 Investors Arrested

cryptonews.ru1 saat önce

İşlemler

Spot
活动图片





