A Bullish Pennant Just Appeared On The Dogecoin Monthly Chart, Here’s What To Expect

bitcoinist2026-03-10 tarihinde yayınlandı2026-03-10 tarihinde güncellendi

Özet

A massive bullish pennant pattern is forming on the Dogecoin (DOGE/USD) monthly chart, a development that began after the cryptocurrency's historic rally in 2021. The pattern started with a sharp "flagpole" surge that took DOGE from under $0.01 to its all-time high of $0.73. Since that peak, the price has been compressing between two converging trendlines, creating a symmetrical triangle with a series of lower highs and higher lows. The price is currently testing a critical juncture, trading near the lower, rising support trendline around $0.09. Holding this support is crucial for the pattern's validity; a monthly close below it would weaken the bullish outlook. For the pattern to confirm and trigger a significant breakout, DOGE must first push above the upper, descending trendline, which requires closing consecutive months above the $0.32 level. If a breakout occurs, the measured move target—calculated from the height of the 2021 flagpole—projects a substantial upward move. Conservative estimates suggest a target well above $1, with more optimistic projections reaching the $3 to $4 range.

Most traders are watching Dogecoin on the daily or weekly chart, reacting to intraday price action. However, the monthly candlestick chart tells a different story, one that has been developing since the 2021 cycle and is now approaching an inflection point.

Technical analysis shows a massive bullish pennant is forming on the DOGE/USD monthly timeframe. Dogecoin is now at a lower high support in the pennant, and the technical implications are significant.

Giant Pennant Has Been Forming Since The 2021 Rally

The monthly chart shows Dogecoin’s price compressing between two converging trendlines, forming what appears to be a large bullish pennant. The structure begins with the flagpole: the near-vertical surge that launched Dogecoin from below $0.01 to its all-time high of $0.73 in May 2021.

Since that peak, DOGE’s price action has been forming a symmetrical triangle on the monthly chart, a series of lower highs and higher lows converging steadily toward an apex. The upper boundary slopes downward from the peak reached during the 2021 surge, creating a descending resistance line that has rejected several major rallies since then.

Source: Chart from TheMoonHailey on X

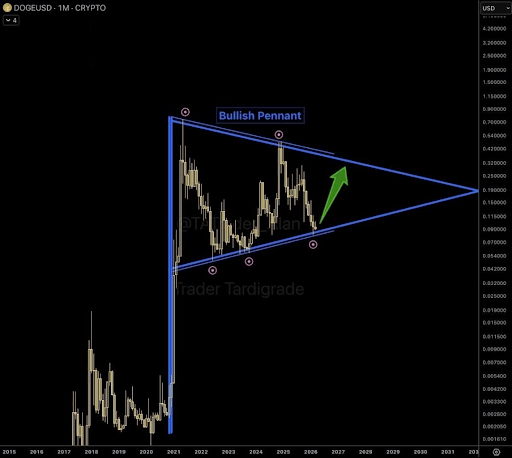
The lower boundary, on the other hand, rises gradually from the base that formed once the previous rally cooled to create a higher low. The lower trendline has provided consistent support, and critically, it held last month when the price tested the $0.08 zone.

As shown in the Dogecoin monthly candlestick chart below, these two lines have created a triangular formation that has continued to narrow since 2021. Multiple turning points on the chart show price reacting precisely at these boundaries, and the structure has been respected repeatedly over time.

Here’s What To Expect From The Bullish Pennant

One of the most important details in the chart is the most recent interaction with the lower trendline. Dogecoin dipped to the rising support boundary in February and bounced. That rebound occurred around the same area where Dogecoin has been trading recently, just below the $0.09 level.

At the time of writing, Dogecoin is trading at $0.094, still close to the support. Holding this support and closing above it in March is important for the structure because a bullish pennant depends on price remaining inside the converging boundaries. If DOGE were to close the month below the lower trendline, then the bullish outlook would weaken.

On the other hand, the bullish outlook depends on Dogecoin breaking above the upper end of the bullish pennant. The measured move target of a bullish pennant is calculated from the height of the flagpole, projected from the breakout point. Given the scale of Dogecoin’s 2021 flagpole, even conservative projections point well above $1, with upper-range targets in the $3 to $4 territory.

However, there is still much work to do for DOGE to return to the upper trendline before a breakout. Particularly, Dogecoin needs to push above $0.32 and close consecutive months above this level.

DOGE trading at $0.09 on the 1D chart | Source: DOGEUSDT on Tradingview.com

İlgili Sorular

QWhat pattern is forming on the Dogecoin monthly chart according to the article?

AA massive bullish pennant is forming on the DOGE/USD monthly timeframe.

QWhat was the starting point (flagpole) of this bullish pennant pattern?

AThe flagpole was the near-vertical surge that launched Dogecoin from below $0.01 to its all-time high of $0.73 in May 2021.

QWhat is the critical support level that Dogecoin recently tested and held?

ADogecoin recently tested and held the support at the lower trendline around the $0.08 zone in February.

QWhat is the significance of Dogecoin closing a month above the $0.32 level?

AClosing consecutive months above the $0.32 level is necessary for Dogecoin to push towards the upper trendline and attempt a breakout from the pennant.

QWhat is the potential price target if the bullish pennant pattern completes with a successful breakout?

AThe measured move target, based on the height of the 2021 flagpole, points well above $1, with upper-range targets in the $3 to $4 territory.

İlgili Okumalar

AI Agent Completely Transforms Web3 Gaming: From the Rugpull Bakery Bot Controversy to the New 2026 Agent Paradigm

This article explores how the AI Agent paradigm is fundamentally transforming Web3 gaming, moving from a disruptive force to a core, legitimized element. It begins with the controversy in the competitive baking game Rugpull Bakery, where automated scripts caused fairness issues. Instead of banning them, the developers integrated AI Agents into the official gameplay by providing technical documentation (skill.md, agent.json), marking a shift towards "Agentic Gaming." The piece outlines three primary implementation models for AI Agents in Web3 games by 2026: 1. **Autonomous Competitors & Economic Entities:** AI Agents act as independent players with unique strategies. Examples include TEN Protocol's poker agents, AI Arena's trainable NFT fighters, and Satoshi Strike Force's "Digital Athletes" trained on player data. The Somnia blockchain is highlighted as a dedicated "Agentic L1" infrastructure supporting this model at scale. 2. **Modular Infrastructure & Programmable Environments:** This model, exemplified by EVE Frontier, allows AI Agents to program game world logic itself. Using "Smart Assemblies" (e.g., Smart Turrets, Smart Gates), Agents can modify shared economic and physical rules on-chain, creating dynamic, player/AI-built worlds. The ERC-8183 standard further enables these automated entities to hire other AI services for complex tasks. 3. **Hybrid Companions & Dynamic Adaptation:** Here, AI serves as a collaborative partner. In Parallel Colony, highly autonomous AI Avatars work alongside human players who provide high-level guidance. Illuvium plans to use AI to make NPCs dynamic and responsive, creating personalized, emergent narratives for each player. The conclusion posits that Web3 gaming has reached a "post-human" inflection point. Blockchains' transparency and programmability, combined with new standards and infrastructure like Somnia, make integrating and governing AI Agents not just viable but essential. The future lies in a symbiotic digital order where players transition from manual laborers to commanders and partners of algorithmic intelligence.

marsbit5 dk önce

AI Agent Completely Transforms Web3 Gaming: From the Rugpull Bakery Bot Controversy to the New 2026 Agent Paradigm

marsbit5 dk önce

Saylor's Purchase of 1550 Bitcoin Is a Bad Trade

**Title: Saylor's Purchase of 1,550 Bitcoins Was a Bad Trade** The article critically analyzes Strategy's recent move of selling 32 bitcoins followed by a much larger purchase of 1,550 bitcoins. While appearing bullish, the author argues this trade is detrimental to MSTR shareholders. The core argument revolves around the concept of "breakeven modified Net Asset Value (mNAV)," a key metric for Strategy. To increase Bitcoin per share (BPS) for MSTR holders, Strategy must issue new shares at a premium high enough that the funds raised can buy more bitcoin than the bitcoin backing each existing share. Currently, this breakeven mNAV is estimated at 1.30. The recent trade failed on two counts: 1. The shares for the $181 million raise were issued at an mNAV *below* the 1.30 breakeven point. Selling "cheap" shares to buy bitcoin actually *reduces* BPS. 2. Only $101.3 million of the raised funds were used to buy bitcoin; the rest went to boost the company's dollar reserves. The breakeven mNAV calculation assumes *100%* of proceeds are used for bitcoin purchases. Diverting funds, even if mNAV were high, dilutes BPS. The result is an estimated 0.19% decrease in Bitcoin per share for MSTR holders. In exchange, Strategy merely extended its operational runway for its dollar reserves from ~6.3 months to 7 months. The author interprets this as Strategy prioritizing the survival and development of its STRC business over its stated core goal of increasing MSTR's BPS. This constitutes a gamble: if sacrificing MSTR value leads to improved market sentiment and a recovery in STRC's price (and thus mNAV), the whole system could work. If not, Strategy may be forced into a cycle of further diluting MSTR to stay afloat, potentially leading to deferred STRC dividends or corporate decline. The article concludes with a hope for price recovery for Bitcoin, MSTR, and STRC.

Foresight News16 dk önce

Saylor's Purchase of 1550 Bitcoin Is a Bad Trade

Foresight News16 dk önce

The AI Bear Market Lasting Two Days Is Over; Why Did Funds Buy Back Storage Stocks First?

After a severe two-day selloff in early June that erased over $1 trillion from U.S. chip stock market value, capital is flowing back first to the memory sector. The correction was not driven by a collapse in AI demand but rather a market reassessment of high expectations. Stocks like Broadcom faced selling pressure despite strong AI revenue guidance, signaling a shift in focus from who has an "AI story" to who can most rapidly translate AI demand into verifiable profits and earnings per share (EPS). Memory companies, such as Micron and SK Hynix, are leading the recovery because their EPS growth is more immediately verifiable. The AI server boom directly increases demand for high-bandwidth memory (HBM) and high-capacity server DRAM, tightening supply and driving up contract prices for conventional DRAM and NAND Flash. This price increase, coupled with a shift to higher-margin products, flows directly into near-term revenue and profitability, as evidenced in recent earnings reports. In contrast, other AI semiconductor segments like GPUs, ASICs, and optical modules, while central to the long-term AI infrastructure story, face longer and less certain paths to EPS validation. Their growth depends more on future product cycles, customer adoption timelines, and capital expenditure plans. The rebound in memory stocks highlights a market preference for assets with shorter, more transparent EPS conversion cycles following the recent de-risking phase. However, this does not negate the potential of other AI hardware segments should they provide clearer near-term order visibility. The episode has raised the validation bar for all AI-related investments.

marsbit16 dk önce

The AI Bear Market Lasting Two Days Is Over; Why Did Funds Buy Back Storage Stocks First?

marsbit16 dk önce

İşlemler

Spot
Futures
活动图片