
A $20 Million Loss Lesson: For Buying the Dip in U.S. Stocks, Just Remember These 'Three Dos and Three Don'ts'

marsbit2026-02-14 tarihinde yayınlandı2026-02-14 tarihinde güncellendi

Özet

"Losing 20 Million: A Painful Lesson on Bottom-Fishing in the U.S. Stock Market — Remember the 'Three Dos and Three Don'ts'" The author shares hard-earned insights after significant losses, concluding that while timing the peak is crucial for A-shares, bottom-fishing is key for U.S. stocks. The U.S. market's long-term upward trend makes buying the dip a core strategy, though it is psychologically challenging for many investors accustomed to A-shares' volatility. The article defines market corrections into three levels based on decline magnitude and duration: daily (5%+ drop or 2+ weeks), weekly (10%+ or 4+ weeks), and monthly (15%+ or 4+ months). Only 7 monthly corrections occurred in the S&P 500 over 20 years, each driven by macro events like rate hikes or crises. The core of U.S. stock bottom-fishing is a disciplined, batched approach. The "Three Dos and Three Don'ts" are: 1. Do plan batched entries; don’t make impulsive trades. 2. Prioritize "buying enough" over "buying cheap." 3. Use time-based batches (e.g., buying every few weeks) over price-based batches. For weekly corrections, a three-batch plan over ~10 weeks is suggested. For rarer monthly corrections, a 6-month plan with decreasing batch sizes (1/2, 1/3, 1/6) is advised. The strategy assumes the market’s long-term growth and relatively low volatility. The article also categorizes downturns: natural pullbacks, valuation-driven adjustments, and systemic crises (e.g., 2008, 2020). While black swan events are unp...

Author: SOL, the Unfathomable

After losing $20 million, I finally understood the probabilities of investing: for A-shares, the most important thing is to exit at the top; for U.S. stocks, the most important thing is to buy the dip.

Exiting the top in A-shares, especially a major top, is both the easiest and the most difficult. It's easy because the top of A-shares is typically a peak of euphoria; in hindsight, the word "major top" is almost written on the chart.

It's difficult because A-shares only make money when going long, and the stock market generally rises over the long term. Exiting the top locks in profits but doesn't make money by itself, and human nature is inherently greedy.

In contrast, the most important thing for U.S. stocks is to buy the dip. Looking at the market over the past 20 years, buying on every dip has been the most important investment rule.

One could say that for money already invested, it's simply a matter of holding on; the key is when to buy the dip with new money? And for investing in U.S. stocks, the easiest and most difficult thing is also buying the dip.

It's easy because buying the dip in U.S. stocks means "buy a little on small dips, buy a lot on big dips, don't buy when there's no dip."
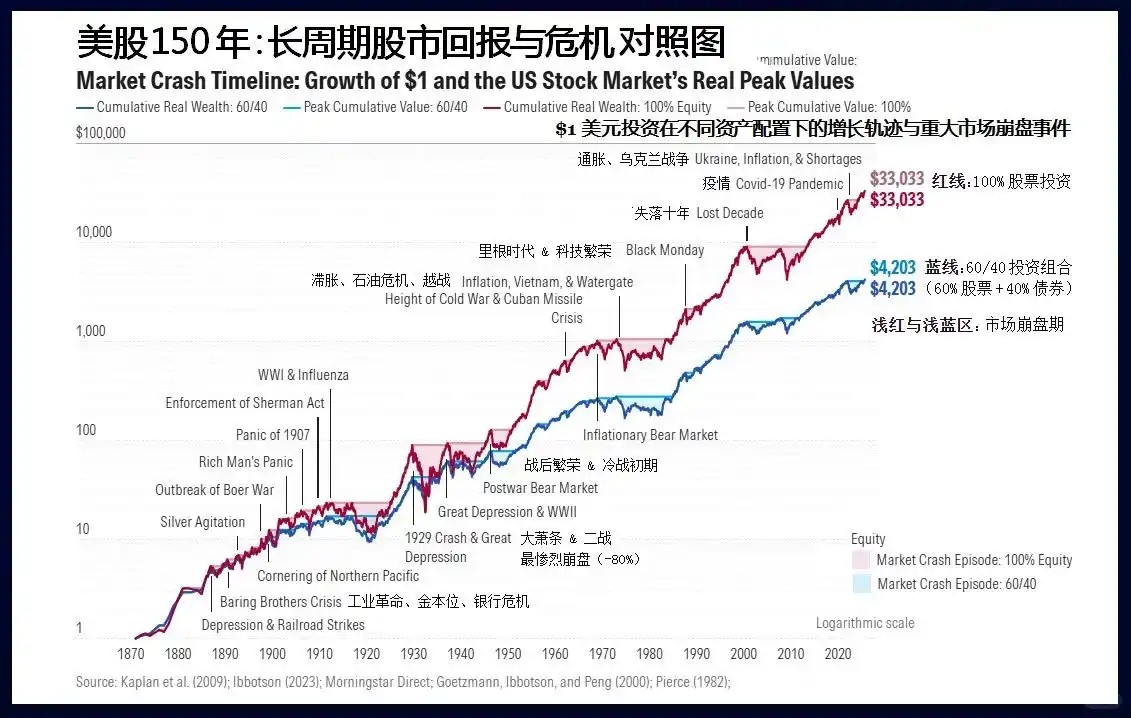
Since 1776, everyone who has bet against America has ultimately ended in their own miserable failure.

It's most difficult because most people come from A-shares, where they've experienced "buying the dip halfway down the mountain," suffering from "dip-buying PTSD syndrome." They always want to buy lower to give themselves some safety cushion, resulting in not daring to buy during the dip and then chasing the rebound.

Therefore, when a dip-buying opportunity arises in U.S. stocks, everyone must clarify two questions:

1. Under normal circumstances, how much does a typical U.S. stock correction fall?

2. If a black swan event occurs and the fall seems endless, what should be done?

1. How deep are U.S. stock corrections? First, let's define what a "correction" is.

Corrections are usually divided into three levels: daily, weekly, and monthly. A round of decline must meet one of two conditions: magnitude or duration (everyone's definition may differ; this article only represents my standard).

  • Daily level: A drop of 5% or more from the highest point, or a duration of more than two weeks (referring to the time span from the highest to the lowest point);
  • Weekly level: A drop of 10% or more from the highest point, or a duration of more than 4 weeks;
  • Monthly level: A drop of 15% or more from the highest point, or a duration of more than 4 months.

Meeting one of the two conditions is sufficient. Some corrections are not deep in magnitude but drag on for a long time; others are the opposite. After clarifying the definition, buying the dip essentially has two goals:

  • Goal one: Buy all the positions you want
  • Goal two: Buy as cheaply as possible

Market trends are always clear in hindsight but confusing in real-time. When a correction is happening, we can only be sure of two things—how much it has fallen from the previous high to today, and how many days it has been falling?

It could continue to fall, consolidate, or start rising again.

So these two goals conflict. Buying too quickly might achieve goal one but at a higher price;

But if you only focus on buying cheap, you might miss out and the price could rise without you.

This requires us to have a probabilistic understanding of the magnitude of corrections in the historical trends of U.S. stocks to set a reasonable goal.
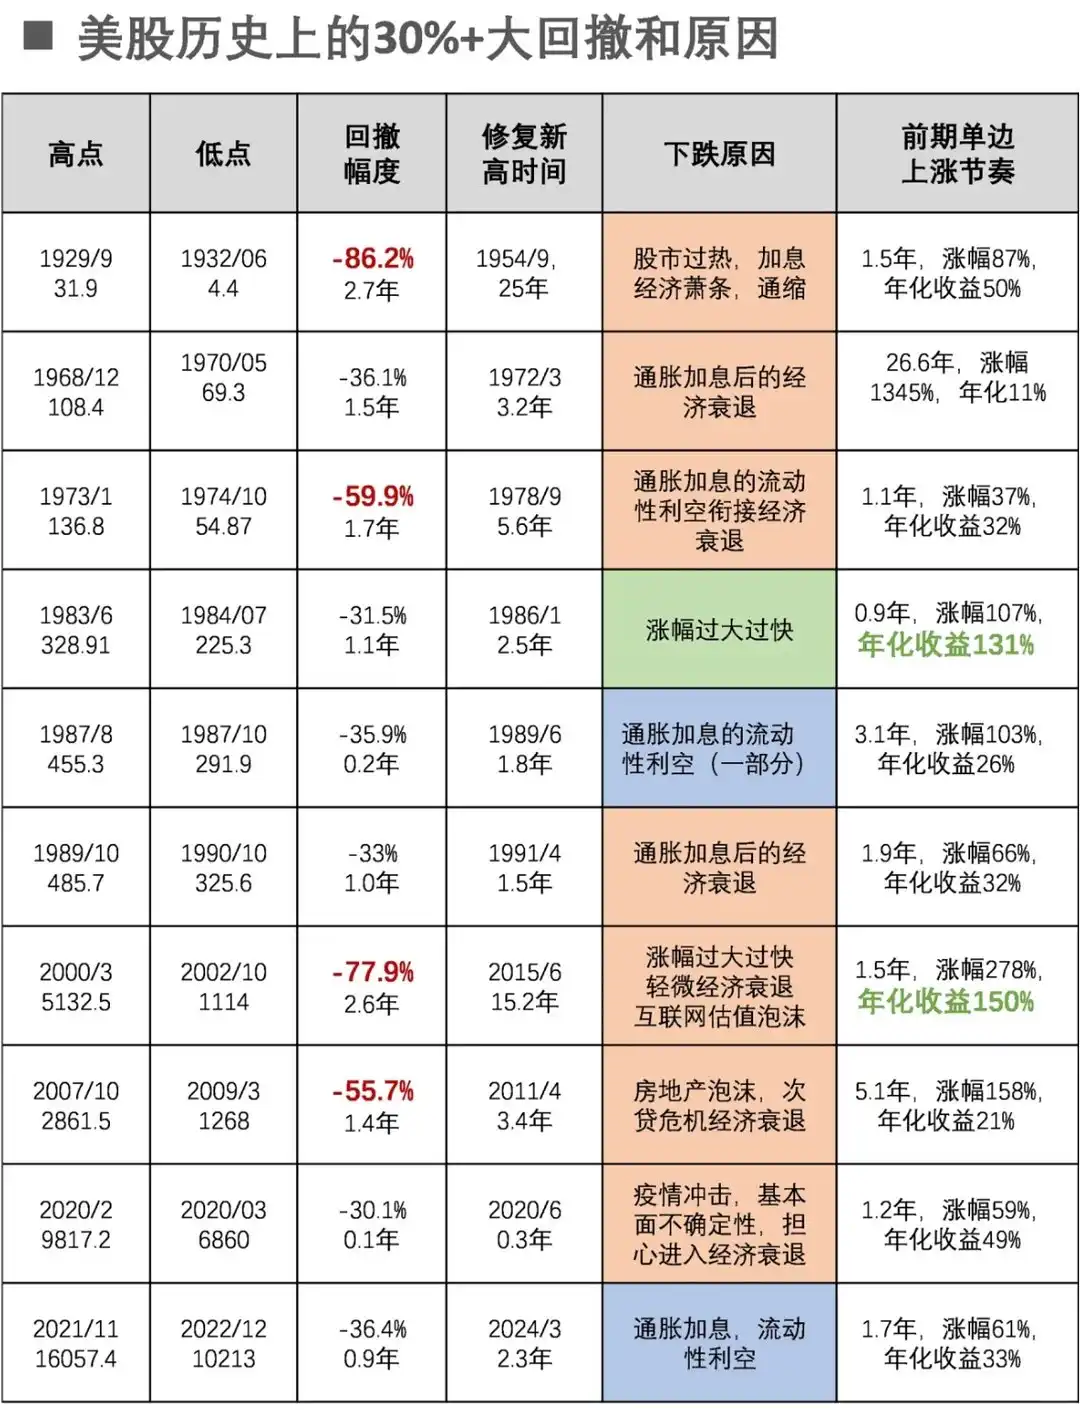
Major Drawdowns of 30%+ in U.S. Stock History and Their Causes

Taking the S&P 500 Index as an example, there have been only 7 monthly-level corrections in the past 20 years since 2004, with reasons分别为:

  • Jan-Oct 2022: The most aggressive interest rate hike cycle in 40 years
  • Feb-Mar 2020: Global public health event
  • Sep-Dec 2018: Trade war combined with interest rate hikes
  • Jul 2015 - Feb 2016: Chinese economic slowdown combined with interest rate hike expectations
  • Apr-Sep 2011: Deepening European debt crisis
  • Apr-Jun 2010: European debt crisis and Goldman Sachs fraud scandal
  • Oct 2007 - Mar 2009: Subprime mortgage crisis

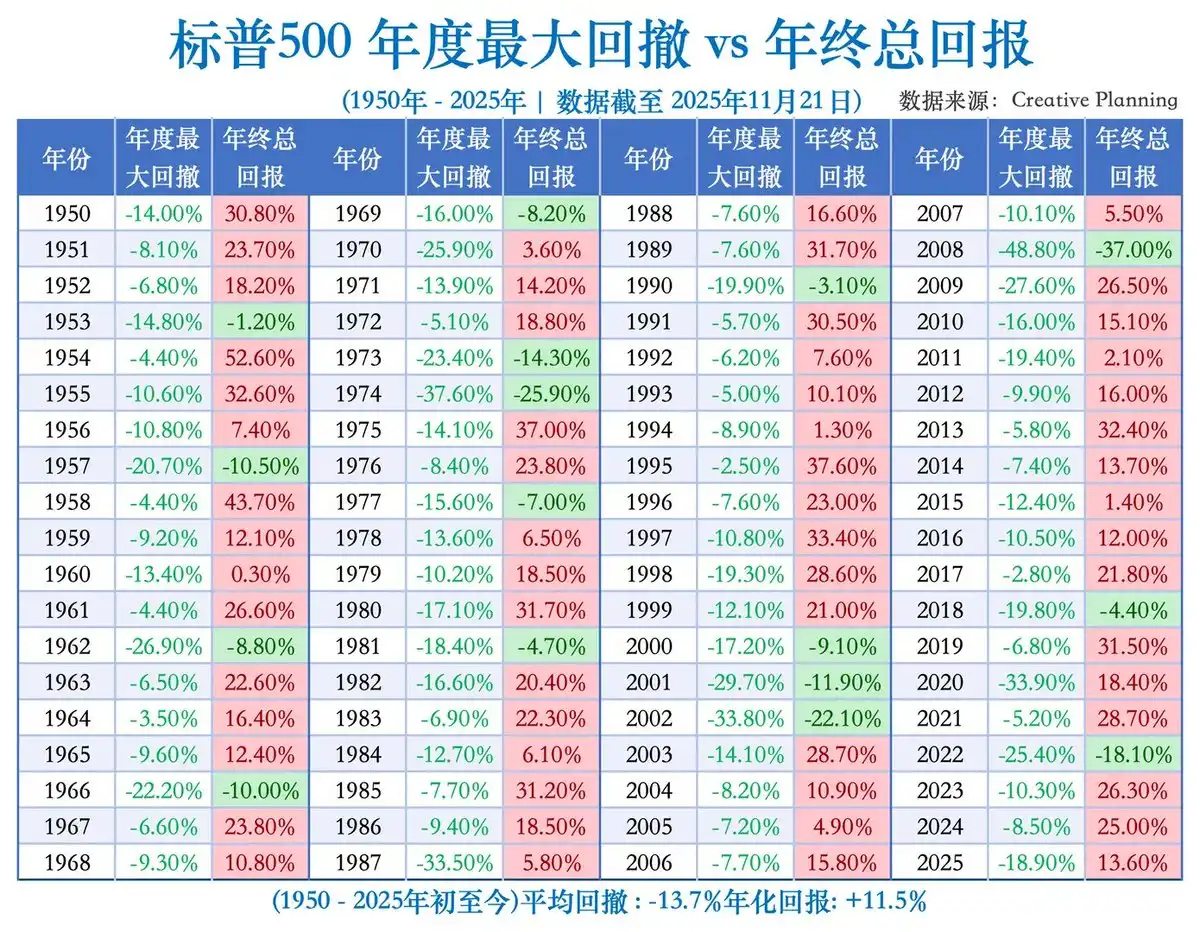
So monthly-level corrections in U.S. stocks are still very rare, occurring on average once every three years, each with macro-fundamental reasons. From September 2011 to July 2015, there was a 44-month period without one, a proper long bull market.

Weekly-level corrections are more frequent, happening 2-3 times a year, and don't necessarily require fundamental reasons; just rising too much can lead to a correction.

Therefore, when buying the dip, the first thing to judge is whether this is a weekly-level or a monthly-level correction?

But stock movements are influenced by various new pieces of information, making accurate prediction difficult. The Fed isn't your family's business; negative and positive news won't arrive according to your plan—fortunately, you can still decide your own goal.

You need to think about a question, imagine it's haggling with a vendor: if you can only choose one goal between "buying" and "buying cheaply," which do you choose?

If it's the former, you should assume the correction is weekly-level and plan accordingly. This way, even if it turns out to be a monthly-level correction, you can still complete your first goal. Similarly, if your goal is "buying cheaply," you should prepare a dip-buying plan for a monthly-level correction.

However, generally, I recommend making "buying" the primary goal, especially when you have idle cash. First, because monthly-level corrections occur only every three years, the probability is indeed low. Second, with idle cash, if you don't buy U.S. stocks, you might end up buying other high-risk products.

With a goal, the plan becomes much simpler.

2. Time Plan vs. Price Plan: The First Question in Buying U.S. Stock Dips—When to Start the Plan?

Taking a weekly-level correction's dip-buying as an example, as long as it doesn't hit a new high for two weeks, a daily-level correction is already happening, and you should prepare a dip-buying plan for a weekly-level correction.

The core of buying U.S. stock dips is two words—scale in.
There are two types of scaling-in plans: one is time-based scaling, buying at fixed time intervals; the other is price-based scaling, buying when the price falls to certain levels. Based on the trends of the past 20 years, for weekly-level corrections (excluding monthly-level ones), the average time from high to bottom is 10 weeks. Thus, time-based scaling can be divided into three batches: starting from the high, buy the dip every three weeks afterward, with a longer interval between the second and first batches.

Price-based scaling can also be divided into three batches, buying one batch at a 3% drop from the high. If the maximum drop is 10%, the entire dip-buying plan can be completed.

The completion probabilities of these two plans differ. The time plan can generally be completed unless it's only a daily-level correction that quickly hits new highs—which isn't regrettable, as you've at least seized a daily-level correction opportunity to add positions.

But the price-based plan might not be completed. Many weekly-level corrections in U.S. stocks only last longer without reaching a 10% drop.

For weekly-level corrections, with "completing the dip buy" as the primary goal, "time-based scaling" should be prioritized. Even if the drop hasn't reached the target, once the correction time arrives, execute the scaling-in plan.

Now, considering a dip-buying plan targeting monthly-level corrections: the average time to bottom is 6.5 months, but it varies greatly. So, adopt the mindset of "probably won't complete the buy" and buy as much as possible.

Don't average the position sizes; instead, use a front-heavy approach: three batches at 1/2, 1/3, and 1/6 of the total plan.

The time plan can be batched as: first month, third month, sixth month. The price plan can be batched as: 3% drop, 8% drop, 15% drop. Often, when you target a "monthly-level" correction, you end up completing a weekly-level correction's dip-buying plan but with insufficient volume. Hence, I initially suggest focusing on the weekly-level correction plan as much as possible.

Buying U.S. stock dips can be simply summarized as three dos and three don'ts:

1. Do make a scaling-in plan; don't make random decisions or trade impulsively during the session;

2. Prioritize "buying enough" over "buying cheaply";

3. Prioritize "time-based scaling" over "price-based scaling." Buying U.S. stock dips is a very mechanical plan, and the premise of this plan is the long-term upward and relatively low-volatility trend of U.S. stocks.

But the stock market is ultimately a place of human博弈, and economic operations themselves are unpredictable. Black swan events can happen at any time and will inevitably happen.

If the correction's duration or depth exceeds the plan, how should you respond? If a black swan event occurs, what should be done?

3. Black Swan Events

The above corrections are divided into monthly and weekly levels, which has the advantage of clear standards. But even among monthly-level corrections, differences are significant. For instance, 2008 and 2020 were actually economic crises, not mere stock market corrections.

Thus, market adjustments can also be categorized into three types based on causes:
1. Natural correction due to excessive cumulative gains, but macro fundamentals are generally positive—Most daily and weekly-level corrections fall into this category.

2. Correction due to overvaluation combined with economic recession or a shift to hawkish monetary policy—A minority of weekly and most monthly-level corrections belong here.

3. Economic crisis or major recession caused by systemic risk—A minority of monthly-level corrections or long-term bear markets fall into this category.

In the past 20 years, the 2008 subprime crisis and the 2020 public health event belong to the third type. The former fell 58% in over a year; the latter fell 35% in two months. So the third situation exceeds our dip-buying plan and requires separate analysis.

However, crises and corrections are indistinguishable at the beginning. When U.S. stocks started falling in 2007, the market thought it was an economic recession. After the Fed began cutting rates, the market rebounded. By early 2008, investors were already buying the dip aggressively.

Therefore, during the dip-buying process, continuously observe whether new events have occurred initially or whether the initial causes of the decline have worsened.

Taking recent deep declines as examples: A standard bear market like the 27% drop in 2022 is actually the easiest to judge. It's driven by standard macro logic; everyone is discussing rate hikes; all prices are soaring; every month, data tells you it's worse than the last. At most, you might have losses at the initial confirmation of the dip buy; later, you'll naturally know it's a protracted battle, requiring an extended dip-buying timeline.

A "once-in-a-lifetime" crash like the 36% drop in one month during the 2020 public health event, triggered by non-economic black swan factors, is indeed panic-inducing short-term, but once it's over, it's over. In this case, you can only endure.

The most difficult was the 58% drop during the 2008 financial crisis, which was a mix of the above two situations. A crisis event during an ordinary recession triggered a deep recessionary bear market. It couldn't be predicted, only responded to.

Going further back, the 2000 dot-com bubble burst was a rare暴跌 caused by excessive valuation, which in turn dragged down the economy. But the valuation levels then were much, much higher than now. It was a discernible gray rhino event, but no one wanted to "get off first."

Synthesizing these types of U.S. stock declines, you'll find that it's best not to predict U.S. stock declines in advance. The most important thing is to face reality and respond after it happens; the sky won't fall.

Of course, having no expectations and making timely and correct responses after the fact requires you to pay attention to the market. You can't just allocate like wealth management without management. You still need to assess, after a certain stage of decline, whether it might evolve into a crisis.


Trend Kriptolar

İlgili Sorular

QWhat are the 'three dos and three don'ts' for bottom-fishing in the U.S. stock market as summarized in the article?

AThe three dos and three don'ts are: 1. Do make a batch plan; don't make random decisions or emotional trades during the session. 2. Prioritize 'buying enough' over 'buying cheap'. 3. Prioritize 'time-based batching' over 'price-based batching'.

QAccording to the author, what is the most important rule for investing in U.S. stocks over the past 20 years?

AThe most important investment rule for U.S. stocks over the past 20 years is to buy on every dip.

QHow does the article define a monthly-level correction for the U.S. stock market?

AA monthly-level correction is defined as a drop of 15% or more from the highest point, or a time span lasting 4 months or more from the peak to the trough.

QWhat are the only two things one can be sure of during a market correction, as stated in the article?

ADuring a market correction, the only two things one can be sure of are how much it has fallen from the previous high to the present day and how many days it has been falling.

QWhat are the three types of market adjustments classified by cause in the article?

AThe three types are: 1. Natural adjustments due to excessive cumulative gains, with macro fundamentals generally sound. 2. Adjustments caused by overvaluation combined with an economic recession or a shift to hawkish monetary policy. 3. Economic crises or major recessions caused by systemic risks.

İlgili Okumalar

After Three Consecutive Quarters of Decline, Can the Crypto Market Find a Window for Stabilization in Q3?

The cryptocurrency market has just concluded its worst-performing quarter since 2022, with total capitalization dropping 12.6% to $2.1 trillion. All core metrics indicate capital is leaving the sector, not just rotating within it. Bitcoin fell 14.2% and Ethereum dropped 25.4% in Q2, breaking their previous correlation with US tech stocks. A key driver is the reversal in US spot Bitcoin ETF flows, which saw a net outflow of approximately $4.67 billion in Q2, including a record monthly outflow near $4.5 billion in June. While recent data suggests long-term holders are accumulating again, sustained ETF outflows mean continued selling pressure. Market focus is now singularly on the Federal Reserve. The upcoming July FOMC meeting is seen as the most critical event for Q3. A dovish signal could support Bitcoin reclaiming a $68,000-$84,000 range, while a hawkish stance might establish a new trading band around $50,000-$56,000. Additionally, regulatory uncertainty persists, with the progress of the crucial *CLARITY Act* stalling in the Senate, reducing its perceived 2026 passage probability to 40-45%. Despite the broad downturn, a few sectors showed growth. Prediction markets saw nominal volume surge 48.7% year-over-year to $113.8 billion, and tokenized collectibles transaction volume rose 143% quarterly to $1.4 billion. The Real-World Asset (RWA) tokenization sector also continued steady growth, now representing ~$28.1 billion in on-chain value. The market's foundation for an extreme crash appears limited, with Bitcoin price hovering near its 200-week moving average. However, the trading paradigm has shifted from narrative-driven speculation to decisions based on price action, policy developments, and interest rate expectations, making a broad sentiment-driven rally unlikely in the near term.

marsbit14 saat önce

After Three Consecutive Quarters of Decline, Can the Crypto Market Find a Window for Stabilization in Q3?

marsbit14 saat önce

BIT Trading Moment: BTC Still Suppressed by Weekly 200 EMA, Rejection May Restart Decline; Storage and Semiconductors that Surged Last Night Begin Falling in Evening Trading

**Crypto & Stock Market Wrap: Bitcoin Tests Resistance, Stocks Retreat After AI Surge** Bitcoin consolidates around $66,000, facing key resistance near $68,000—an area seen as a major psychological and technical hurdle where previous rallies have failed. Analysts note the cryptocurrency is caught between its 200-week moving average (~$63,333) and 200-week EMA (~$68,328). A clear break above $68k is needed to signal a stronger bullish trend, while a rejection could lead to a retest of $63k support. Market sentiment remains cautious, with low futures open interest pointing to a low-liquidity rebound rather than a full bull market. Bitcoin spot ETFs saw another $203 million inflow. US stock futures pointed lower after a strong Tuesday session led by a massive rebound in semiconductors and memory stocks. The rally was fueled by renewed optimism about AI-driven hardware demand, with Micron, SanDisk, and SK Hynix surging. However, those gains reversed in pre-market trading. Super Micro Computer (SMCI) soared over 20% after hours on strong guidance and a record backlog. Other standouts included Rocket Lab and nuclear energy plays Oklo and X-Energy. Rising oil prices (Brent above $91) and climbing Treasury yields (10-year near 4.64%), however, are reigniting inflation concerns and acting as a headwind for equities. In Asia, markets were mixed. South Korea's KOSPI pared early gains to close slightly higher as semiconductor stocks like SK Hynix gave back initial surges. Japan's Nikkei edged lower as the yen hit a fresh 38-year low against the dollar, raising fears of potential market intervention. Key events to watch include the Samsung Galaxy launch, AMD's AI event, and a slew of major tech earnings from Alphabet, Tesla, and IBM after the close on Wednesday, followed by the ECB meeting and Intel's earnings on Thursday.

marsbit14 saat önce

BIT Trading Moment: BTC Still Suppressed by Weekly 200 EMA, Rejection May Restart Decline; Storage and Semiconductors that Surged Last Night Begin Falling in Evening Trading

marsbit14 saat önce

Former CFTC Chairman, Circle President Tarbert: Preaching Long-Termism While Cashing Out $30 Million Himself

Former CFTC Chairman and Circle President Heath Tarbert has consistently advocated for a long-term vision in public, urging patience from investors as Circle’s stock price has fallen significantly from its peak. However, it has been revealed that since Circle’s IPO, Tarbert has continuously sold his CRCL shares through pre-arranged trading plans, cashing out approximately $30 million, without making any public market purchases. This contrast between his public messaging and personal actions has drawn criticism. Tarbert joined Circle in July 2023 as Chief Legal Officer, leveraging his regulatory experience to help guide the company through its IPO and expansion. Despite promoting stablecoins as long-term infrastructure, he established a 10b5-1 trading plan just before Circle went public, leading to substantial stock sales over the following year. In March 2026, he initiated another plan to sell more shares. His career trajectory highlights a pattern of moving between high-level regulatory roles and influential positions in the financial sector. After resigning as CFTC Chairman in early 2021, he joined Citadel Securities as Chief Legal Officer just 27 days later, during a period of intense regulatory scrutiny for the firm. He later joined Circle, aiding its efforts to navigate regulatory challenges for its public listing. While Tarbert's expertise in policy and compliance is valuable to companies like Circle, his actions—advocating long-term confidence while personally divesting—raise questions about the alignment between his public statements and his private financial decisions, leaving investors who followed his advice to bear the market risks.

marsbit14 saat önce

Former CFTC Chairman, Circle President Tarbert: Preaching Long-Termism While Cashing Out $30 Million Himself

marsbit14 saat önce

Gate Research Institute: The 'Wall Street-ization' Wave of Crypto Financial Products – Competition or Integration?

The article titled "Gate Research Institute: Are Crypto Financial Products Sparking a 'Wall Street' Wave—Competition or Convergence?" explores the evolving relationship between the crypto ecosystem and traditional finance (TradFi). The piece begins by reflecting on Bitcoin's original 2009 vision of decentralization, disintermediation, and moving away from banks. It then contrasts this with the 2024 landscape, where key crypto assets like Bitcoin are increasingly held through Wall Street products like ETFs issued by giants like BlackRock. The article questions whether this signifies that TradFi is systematically taking over the rights to issue, price, custody, and distribute crypto financial assets. The core argument is that this is not a zero-sum takeover but rather a bidirectional convergence where each side addresses the other's weaknesses. Crypto offers 24/7 global markets, programmable settlement, and open access but lacks compliant channels, institutional-grade custody, deep fiat liquidity, and mainstream distribution. TradFi possesses these but is constrained by legacy systems, limited operating hours, and slow settlement. Two primary convergence paths are highlighted: * **Path A (CEX to TradFi):** Exemplified by Gate, which has progressed from offering tokenized stocks and CFDs to providing direct, real stock trading (US, Hong Kong, South Korea) within its platform, using USDT. * **Path B (TradFi to Crypto):** Exemplified by Robinhood, which has integrated crypto trading, acquired exchanges like Bitstamp, and is moving traditional assets like stocks onto the blockchain via tokenization and its own Layer 2. Both paths are ultimately competing to become the next-generation, unified financial account—a "super account" where users can seamlessly trade cryptocurrencies, stocks, ETFs, RWA (Real World Assets), and tokenized treasury products in one interface. The growth of RWA and tokenized treasuries (e.g., BlackRock's BUIDL) is presented as the asset-layer fusion, providing stable, yield-bearing assets on-chain and acting as a bridge between the two worlds. In conclusion, the "Wall Street-ization" of crypto is framed as a mutual transformation. Decentralized ideals persist in the protocol layer, while at the application layer, a more efficient, global, and accessible unified capital market is emerging from this convergence. The future competition lies not between crypto exchanges and stockbrokers, but between platforms vying to offer the most comprehensive asset coverage, liquidity, and user experience within a single account.

marsbit14 saat önce

Gate Research Institute: The 'Wall Street-ization' Wave of Crypto Financial Products – Competition or Integration?

marsbit14 saat önce

İşlemler

Spot

Popüler Makaleler

SOLANA Nedir

HarryPotterWifHatMyroWynn10Inu,$solana: Trendy Meme Coin Projesine Bir Giriş Giriş Kripto para birimlerinin sürekli gelişen dünyasında, yenilikçi projeler sürekli olarak ortaya çıkmakta ve yatırımcıların ve meraklıların hayal gücünü yakalamaktadır. Bu projelerden biri, kripto topluluğunda kendine bir yer edinmeye başlayan bir meme coin olan HarryPotterWifHatMyroWynn10Inu,$solana'dır. Bu makale, projenin amacını, mimarisini, yaratıcısını, yatırımcılarını ve yolculuğu boyunca kaydedilen dikkate değer kilometre taşlarını kapsamlı bir şekilde sunmayı hedeflemektedir. HarryPotterWifHatMyroWynn10Inu,$solana nedir? Genel Bakış HarryPotterWifHatMyroWynn10Inu,$solana, ölçeklenebilirliği ve hızı ile tanınan Solana blok zinciri üzerinde yapılandırılmış bir meme coin projesidir. Kripto alanına neşe ve yaratıcılık getirmeyi amaçlayan bu proje, sadece bir ticaret token’ı olarak değil, aynı zamanda meme içeriğinin üretilmesi ve paylaşılması için bir katalizör olarak da hizmet etmektedir. Temelindeki topluluk, aktif olarak katılım göstermeye teşvik edilmekte ve yaratıcılığın ve iş birliğinin geliştiği dinamik bir ekosistem sunulmaktadır. Hedefler ve Amaçlar Projenin özünde, meme meraklılarının bir araya gelip, paylaşabileceği ve yeni meme içerikleri oluşturabileceği bir ortam geliştirmek hedeflenmektedir. Bu anlatı odaklı yaklaşım, topluluk içerisinde heyecan yaratmakta, katılımı teşvik etmekte ve aynı zamanda Solana blok zincirinin yerel sağlam işlevselliğini öne çıkarmaktadır. HarryPotterWifHatMyroWynn10Inu,$solana, topluluk odaklı bir proje oluşturarak dijital para birimlerinin ifade biçimi olarak sosyal etkisini keşfetmeyi de amaçlamaktadır. HarryPotterWifHatMyroWynn10Inu,$solana'nın yaratıcısı kimdir? HarryPotterWifHatMyroWynn10Inu,$solana'nın arkasındaki yaratıcının kimliği gizemini korumaktadır. Proje, mülkiyetin feragat edildiği şekilde yapılandırılmıştır; bu nedenle, topluluk liderliğindeki bir girişim olarak gelişmektedir. Bu merkeziyetsizlik, tüm paydaşlar arasında şeffaflığı ve demokratik katılımı teşvik etmektedir. Topluluk katılımının en üst düzeyde olduğu meme coin dünyasında bu tür bir yaklaşım giderek daha popüler hale gelmektedir. HarryPotterWifHatMyroWynn10Inu,$solana'nın yatırımcıları kimlerdir? Şu anda, HarryPotterWifHatMyroWynn10Inu,$solana'yı destekleyen belirli yatırımcılar veya fonlar hakkında kamuya açık bilgi bulunmamaktadır. Tanınmış yatırımcıların yokluğu, projenin topluluk odaklı etik anlayışını daha da pekiştirerek geleneksel finansal çerçevelerden bağımsız olarak durmasına olanak tanımaktadır. Bu bağımsızlık, projenin, kullanıcı tabanından gelen toplu ilgiye dayanarak dış baskılardan bağımsız bir kimlik geliştirmesine olanak tanımaktadır. HarryPotterWifHatMyroWynn10Inu,$solana nasıl çalışır? Ekonomik Model Proje, işlevselliğini ve kullanıcı katılımını destekleyen benzersiz bir ekonomik model kullanmaktadır. HarryPotterWifHatMyroWynn10Inu,$solana içindeki işlemler, tüm taraflar için faydalı olacak şekilde tasarlanmıştır. Her ticaret, ücret almakta ve bu ücret mevcut token sahipleri arasında yeniden dağıtılmakta, aynı zamanda likidite havuzunu artırmaktadır. Bu modelin temel bileşenleri şunlardır: Yansıtma Mekanizması: İşlem ücretlerinin bir kısmı sahiplerine geri verilmektedir, bu da token'a uzun vadeli yatırım yapmayı teşvik etmektedir. Likidite Havuzu Edinimi: Likiditeyi artırmak için fonlar tahsis edilmektedir, böylece alım satım işlemleri sorunsuz bir şekilde gerçekleştirilebilmektedir. Yanma Mekanizmaları: Token'ların bir kısmı, talep arttıkça değeri potansiyel olarak artırmak için yanılabilir. Bu tasarım, topluluk etkileşimleri ve yatırımlar üzerinde gelişen kendine yeten bir ekosistemi teşvik etmektedir. Topluluk Katılımı HarryPotterWifHatMyroWynn10Inu,$solana'nın kalbinde, topluluk katılımına atfedilen değer yatmaktadır. Kullanıcıların, meme oluşturma ve tanıtımlar gibi çeşitli etkinlikler aracılığıyla projenin gelişimine katılmalarına olanak tanıyarak, yaratıcılığın gelişebileceği canlı bir ekosistem oluşturmaktadır. HarryPotterWifHatMyroWynn10Inu,$solana'nın Zaman Çizelgesi HarryPotterWifHatMyroWynn10Inu,$solana'nın yolculuğu, kripto topluluğundaki mevcut durumunu şekillendiren birkaç önemli olayı içermektedir: Yaratılış: Yaratılışın belirli tarihi açıklanmamış olmakla birlikte, projenin başlangıcı, dijital çağın içine işleyen meme kültüründe kök salmaktadır. Topluluk Devralması: Yaratıcının mülkiyetten feragat etmesinin ardından, proje topluluk liderliğine geçerek tüm katılımcılara başarısında bir pay vermiştir. Denetim ve NFT Koleksiyonu: Güvenilirliği artırmak için proje kapsamlı bir denetim gerçekleştirirken, aynı zamanda meme merkezli etik anlayışını yansıtacak bir NFT koleksiyonu başlatmıştır. Ortaklıklar ve Gelişim: Proje, mevcut durumda diğer token'larla potansiyel ortaklıklar keşfetmekte ve efsanevi meme'lerine dayanarak benzersiz bir web sitesi ve ürün seçeneklerinin geliştirilmesini organize etmektedir. Önemli Noktalar Özetle, HarryPotterWifHatMyroWynn10Inu,$solana, kripto para birimi meme coin sektörü içinde dikkate değer bir oyuncu durumundadır. İşte anahtar çıkarımlar: Topluluk Liderliğindeki Girişim: Proje, mülkiyet taleplerinden bağımsız olarak topluluk üyelerinin aktif katkılarını teşvik ederek iş birliği çabası içinde gelişmektedir. Yenilikçi Ekonomik Model: Yansıtma, likidite edinimi ve yanma mekanizmalarını kullanarak, kullanıcılar için sağlam ve ilgi çekici bir finansal ortam yaratmaktadır. NFT ve Ürün Etkileşimi: NFT koleksiyonunun lansmanı ile proje, topluluğu ile etkileşimi derinleştirmeyi hedeflemekte, meme kültürü ile dijital para birimi arasındaki bağı pekiştirmektedir. Ortaklıkların Keşfi: Girişim duraksamıyor – sürdürülebilir büyüme hedefleyen devam eden gelişmeler ve potansiyel ortaklıklar, ileri görüşlü bir yaklaşım olduğunu göstermektedir. Sonuç HarryPotterWifHatMyroWynn10Inu,$solana, kripto para birimi alanında itibar kazandıkça, topluluk katılımı, yenilikçi ekonomik yapılar ve meme kültürünün entegrasyonu ile potansiyel yolunu çizmektedir. Kökenleri ve yatırımcı bağlantıları etrafında gizem olmasına rağmen, proje merkeziyetçi inovasyonun özünü yansıtan ilginç bir hikaye sunmaktadır. Kripto para birimleri genellikle tamamen finansal bir bakış açısıyla değerlendirildiği bir dünyada, HarryPotterWifHatMyroWynn10Inu,$solana, kripto hareketinin yaratıcılığı, topluluğu ve iş birliğini içerebildiğini göstermektedir. İster deneyimli bir yatırımcı olsun, ister yeni bir katılımcı, bu meme coin projesinin gelişen yolculuğu kesinlikle dikkat etmeyi gerektiren ilgi çekici bir vaka çalışmasıdır.

556 Toplam GörüntülenmeYayınlanma 2024.04.04Güncellenme 2024.12.03

SOLANA Nedir

SOLANA 2.0 Nedir

BarbieCrashBandicootRFK777Inu, $SOLANA 2.0: Kripto Manzarasında Yeni Bir Oyuncu BarbieCrashBandicootRFK777Inu, $SOLANA 2.0'a Giriş Kripto para birimlerinin sürekli evrilen manzarasında, yeni girişimler sürekli olarak yatırımcıların ve meraklıların dikkatini çekiyor. Bu yeni projeler arasında, kripto para simgesi $SOLANA 2.0 ile temsil edilen BarbieCrashBandicootRFK777Inu bulunmaktadır. Bu benzersiz girişim, gizem, macera ve meme kültürü unsurlarını birleştirerek, son derece rekabetçi bir arenada beklentileri aşmayı hedefliyor. Büyüme ve yenilik arzularıyla, bu proje, yerleşik devlerle savaşa hazırlanan bir alt yapının ruhunu yakalıyor. BarbieCrashBandicootRFK777Inu, $SOLANA 2.0 Nedir? BarbieCrashBandicootRFK777Inu, temelinde çeşitli ikonik kültürel referanslardan ilham alan bir kripto para projesidir. Barbie ile ilişkilendirilen zarafet ve çekicilik, Crash Bandicoot'ın dinamik enerjisi ve RFK'nın temsil ettiği amansız azim ile harmanlanan bu proje, kripto para dünyasında çok yönlü bir deneyim sunmayı amaçlamaktadır. BarbieCrashBandicootRFK777Inu projesinin ana hedefi, bu farklı unsurları geniş bir izleyici kitlesine hitap eden uyumlu bir ekosisteme birleştirmektir. Meme kültürünün eğlenceli yanlarını kucaklarken, merkeziyetsizlik ve finansal güçlendirme ilkeleriyle köklü bir bağ kurarak, proje kendisini hem deneyimli yatırımcılar hem de kripto dünyasına yeni katılanlar için cazip bir seçenek olarak konumlandırmıştır. BarbieCrashBandicootRFK777Inu, $SOLANA 2.0'nın Yaratıcısı Kimdir? BarbieCrashBandicootRFK777Inu'ya olan ilginin artmasına rağmen, yaratıcısı hakkında bilgiler büyük ölçüde bilinmemektedir. Kurucusunun veya geliştirme ekibinin anonimliği, projenin yapısı ve yönetişimi hakkında soru işaretleri oluşturuyor. Kripto para dünyasında, projelerin kamuya açık bir şekilde yaratıcıları olmadan faaliyet göstermesi sık rastlanan bir durumdur. Bu bilgi eksikliği bazı potansiyel yatırımcıları caydırabilirken, diğerleri bunu birçok kripto para girişimini destekleyen merkeziyetsizlik ruhunu benimseme fırsatı olarak görebilir. BarbieCrashBandicootRFK777Inu, $SOLANA 2.0'in Yatırımcıları Kimlerdir? Şu anda, BarbieCrashBandicootRFK777Inu'yu destekleyen yatırım temelleri veya kuruluşları hakkında sınırlı bilgi bulunmaktadır. Projenin detaylı bir yatırım desteğinden yoksun olması, birçok kripto paranın bağımsız doğasını vurguluyor. Bu durumda, projenin finansmanının yerel topluluk desteğinden mi yoksa daha büyük finansal varlıkların desteğinden mi geleceği henüz belirsizliğini koruyor. BarbieCrashBandicootRFK777Inu, $SOLANA 2.0 Nasıl Çalışıyor? BarbieCrashBandicootRFK777Inu, kalabalık kripto alanında kendine özgü olmasına katkıda bulunan birçok özellikle tasarlanmıştır. Belirli teknik detaylar gizli tutulsa da, proje kullanıcı etkileşimini artırmayı ve topluluk büyümesini teşvik etmeyi amaçlayan işlevsellikler içermesi beklenmektedir. Modadan maceraya ve oyun dünyasına kadar çeşitli etkilerin birleşimi, farklı ilgi alanlarına hitap eden kapsayıcı bir atmosferi teşvik ediyor. Ek olarak, projenin $SOLANA 2.0 ekosistemi ile olan bağı, potansiyel teknolojik avantajları önermektedir. Bu, yenilikçi işlem hızlarını, ölçeklenebilirliği ve maliyet etkinliğini içerebilir ve bu da Solana blok zincirinin teknik kapasitesiyle uyumlu hale getirmektedir. Projenin kurucuları, kalıcı bir topluluk deneyimi ve önemli bir ürün sunumu oluşturmak için bu teknolojik temeli benimseyecek gibi gözüküyor. BarbieCrashBandicootRFK777Inu, $SOLANA 2.0'ın Zaman Çizelgesi BarbieCrashBandicootRFK777Inu'nun yolculuğu, projenin şimdiye kadarki gelişimini aydınlatan birkaç önemli dönüm noktası içermektedir: Proje Kavramsallaştırması: Gizem, macera ve meme kültürünün birleştirilmesine dair ilk fikirler ortaya çıktı ve projenin benzersiz konsepti için bir çerçeve sağladı. Token Oluşturma: Projenin beklentilerini temsil etmek ve potansiyel yatırımcıların ilgisini çekmek üzere tasarlanmış sembolik $SOLANA 2.0 tokeni oluşturuldu. Proje Gelişimi: Şu anda, proje daha fazla geliştirme aşamasındadır ve kripto alanındaki yerleşik oyunculara meydan okumaya ve yenilikçi tekliflerde bulunmaya odaklanmaktadır. Bu dönüm noktaları, projenin büyüme eğilimini yansıtırken, öncü bir kripto para deneyimi geliştirme konusundaki kararlığını da vurgulamaktadır. BarbieCrashBandicootRFK777Inu, $SOLANA 2.0 Hakkında Ana Noktalar Benzersiz Konsept: BarbieCrashBandicootRFK777Inu, gizem, macera ve meme kültürünü birleştirerek tek bir kripto para projesi olarak öne çıkmaktadır. Alt Yapı Ruhu: Proje, yerleşik kripto para projelerine meydan okumak ve sektörde bir niş oluşturma amacı taşıyan bir alt yapı kişiliğini benimsemektedir. Gelişim Aşaması: Aktif geliştirme çabaları devam etmektedir ve topluluğun ve yatırımcıların beklentileriyle uyumlu yenilikçi teklifler sunma niyeti bulunmaktadır. Sonuç $SOLANA 2.0 sembolü ile temsil edilen BarbieCrashBandicootRFK777Inu, kripto para piyasasında ilginç bir yeni girişimdir. Kültürel referansların benzersiz karışımı ve iddialı vizyonu, kripto manzarasında alternatif proje değerleri arayanlarla yankı bulabilir. Yaratıcısının ve yatırımcılarının bilinmeyen durumu bazılarına tuhaf gelebilir, ancak projenin çekicilik ve maceraya olan vurgusu, kripto paraların neyi temsil edebileceğinin sınırlarını genişleten etkileyici bir anlatı sunuyor. Proje geliştikçe, daha geniş kripto dünyasında nasıl evrileceğini ve rakipleri arasında nasıl bir yer edineceğini gözlemlemek ilginç olacaktır. BarbieCrashBandicootRFK777Inu, dijital varlıklarla etkileşimi yeniden tanımlayacak sürpriz deneyimlerin kapısını aralayabilir. Şu anda, proje ilerledikçe, yolculuğu kripto alanında yeniliğin sınır tanımadığını, heyecan ve eğlenceden finansal güçlendirme potansiyeline kadar her şeyi sunduğunu hatırlatıyor.

211 Toplam GörüntülenmeYayınlanma 2024.04.05Güncellenme 2024.12.03

SOLANA 2.0 Nedir

SOL Nasıl Satın Alınır

HTX.com’a hoş geldiniz! Solana (SOL) satın alma işlemlerini basit ve kullanışlı bir hâle getirdik. Adım adım açıkladığımız rehberimizi takip ederek kripto yolculuğunuza başlayın. 1. Adım: HTX Hesabınızı OluşturunHTX'te ücretsiz bir hesap açmak için e-posta adresinizi veya telefon numaranızı kullanın. Sorunsuzca kaydolun ve tüm özelliklerin kilidini açın. Hesabımı Aç2. Adım: Kripto Satın Al Bölümüne Gidin ve Ödeme Yönteminizi SeçinKredi/Banka Kartı: Visa veya Mastercard'ınızı kullanarak anında Solana (SOL) satın alın.Bakiye: Sorunsuz bir şekilde işlem yapmak için HTX hesap bakiyenizdeki fonları kullanın.Üçüncü Taraflar: Kullanımı kolaylaştırmak için Google Pay ve Apple Pay gibi popüler ödeme yöntemlerini ekledik.P2P: HTX'teki diğer kullanıcılarla doğrudan işlem yapın.Borsa Dışı (OTC): Yatırımcılar için kişiye özel hizmetler ve rekabetçi döviz kurları sunuyoruz.3. Adım: Solana (SOL) Varlıklarınızı SaklayınSolana (SOL) satın aldıktan sonra HTX hesabınızda saklayın. Alternatif olarak, blok zinciri transferi yoluyla başka bir yere gönderebilir veya diğer kripto para birimlerini takas etmek için kullanabilirsiniz.4. Adım: Solana (SOL) Varlıklarınızla İşlem YapınHTX'in spot piyasasında Solana (SOL) ile kolayca işlemler yapın.Hesabınıza erişin, işlem çiftinizi seçin, işlemlerinizi gerçekleştirin ve gerçek zamanlı olarak izleyin. Hem yeni başlayanlar hem de deneyimli yatırımcılar için kullanıcı dostu bir deneyim sunuyoruz.

2.0k Toplam GörüntülenmeYayınlanma 2024.12.12Güncellenme 2026.06.02

SOL Nasıl Satın Alınır

Tartışmalar

HTX Topluluğuna hoş geldiniz. Burada, en son platform gelişmeleri hakkında bilgi sahibi olabilir ve profesyonel piyasa görüşlerine erişebilirsiniz. Kullanıcıların SOL (SOL) fiyatı hakkındaki görüşleri aşağıda sunulmaktadır.

活动图片