Hello, I'm your old friend, Cody, Odaily's invited market analyst. Today is the seventh day of the Lunar New Year, and the Spring Festival holiday is basically coming to an end.
From a market performance perspective, this week's行情 has been similar to the state we analyzed in our last article—the pace is slow, mainly震荡, with no significant directional波动.
Bitcoin has mainly traded in the range of $65,500~$70,000 over the past week, with the overall price structure maintaining a震荡 consolidation. It has neither effectively broken through the上方 pressure nor shown further signs of放量 weakness below.
Therefore, against this backdrop, what is more suitable this week is not急于 judging the trend direction, but observing the structural changes within the震荡 range.
It is precisely during this phase of "slowed pace in mainstream assets" that we can extend our视线 to some assets with relatively independent structures.
So, in this week's article, we will首次 introduce analysis of a new coin—HYPE. Combining the results of a completed short-term practical operation, we will拆解 its current position and potential subsequent trading opportunities from the perspective of daily structure and波段.

Trading Weekly Report Core Summary:
• Strategy Execution (Short-term) Effectiveness Verification: Based on strategy discipline, we did not perform any short-term operations last week as Bitcoin's price did not reach the预判 pressure zone.
• Strategy Execution (Mid-term) Effectiveness Verification: Bitcoin followed the既定 mid-term strategy last week, continuing to hold the short position built at $89,000 (1x leverage). As of last week's close, the profit was approximately 24.01%, with a maximum profit during the period of about 32.58%.
• Core View (Short-term) Verification: Last week, Bitcoin震荡 between $65,500~$70,000. The current trend aligns with our previous prediction of a range-bound震荡格局.
• HYPE: Analysis of the price structure and short-term trading opportunities. (Detailed explanation see Figure 1)
The following will详细回顾 the行情预判, strategy execution, and specific trading process.
I. HYPE Price Structure Interpretation and Short-term Operation Review:
HYPE Daily K-line Chart
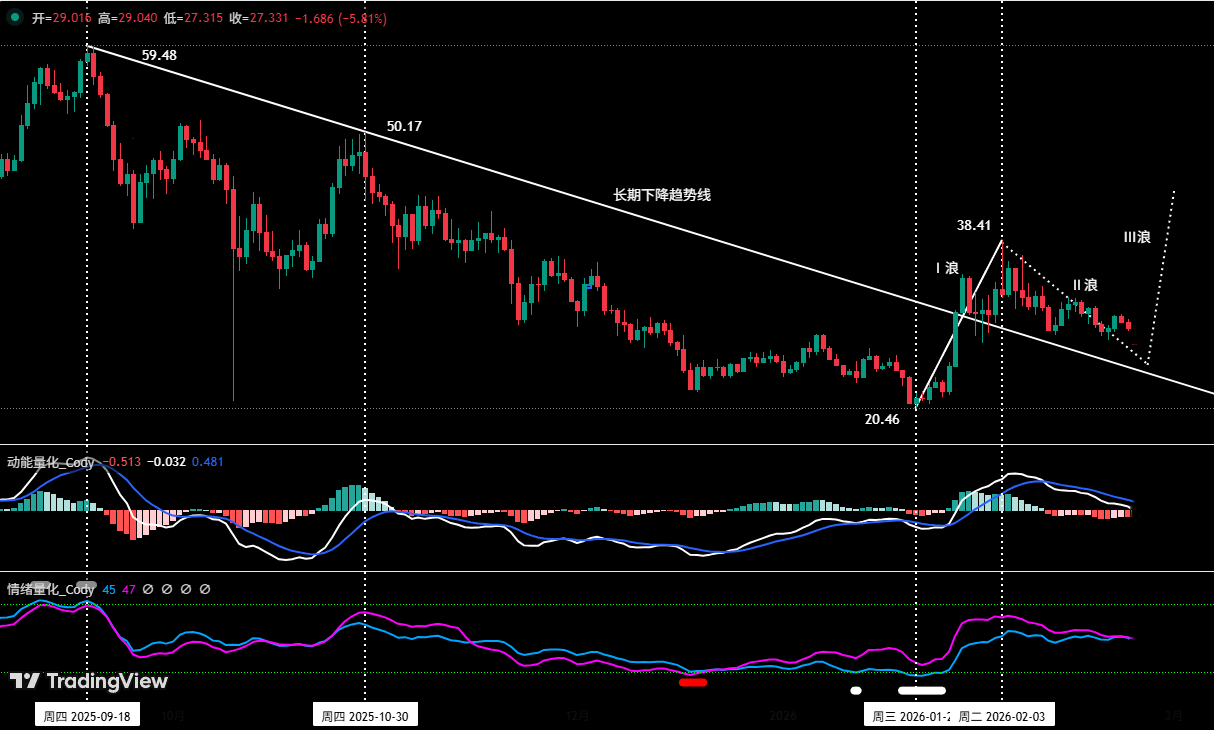
Figure 1
1. Daily Level Framework (See Figure 1)
HYPE started an independent震荡上行 trend after stabilizing around $20.46 on January 21, 2026. Currently, the price has confirmed a breakthrough of the long-term下降趋势线 connecting the September 2025 high (approx. $59.48) and the October 2025 high (approx. $50.17), signaling a potential shift in the previous bearish structure.
Its daily price structure can be初步划分 as follows: (Based on行情 after January 21)
• Wave I (Impulse Wave): From January 21 ($20.46) to February 3 ($38.41), completing a rising wave.
• Wave I Bottom Prediction Signal: Through analysis using a self-built quantitative model, the following appeared simultaneously near the end of Wave I (around January 21):
• Momentum Quantitative Model: Showed a momentum divergence signal.
• Sentiment Quantitative Model: Triggered a bottom预警 signal (white horizontal bar in the chart).
The叠加 of the above signals strengthened the prediction that Wave I formed a significant low on January 21 ($20.46).
• Wave II (Corrective Wave): From February 3 ($38.41) to present,表现为 a correction of Wave I.
• Key Confirmation Conditions for Wave III:
• Signal to Confirm Wave III Start:
a, If the subsequent price does not break below the February 19 low of $27.73, this point can be confirmed as the end of Wave II and the start of Wave III.
b, If the subsequent price breaks below $27.73 but remains above the January 21 low of $20.46, then the current行情 is considered merely a continuation of the Wave II move. Wave III might not have started yet, requiring waiting for the next bottoming signal.
• Signal to Confirm Wave III End:
The high point of Wave III must exceed the Wave I peak of $38.41. Only when the price clearly breaks above the previous high can the continuation of the uptrend be confirmed; otherwise, it might still be part of a wide-range震荡 or a rebound within a下跌 structure.
2. HYPE Short-term Operation (1x Long)
• Entry Decision: Based on the adjustment after the first段上涨 trend on the 1-hour level, the first pullback after the momentum line in the Momentum Quantitative Model broke above the zero axis, and the price being above a key support area.
• Exit Decision: Exited near the short-term technical resistance around $30.97.
• Trade Summary: This operation successfully captured the hourly-level反弹波段, achieving a profit of approximately 4.71%.
II. Bitcoin's震荡行情 Continues: (02.16~02.22)
1. Short-term Strategy Review:
As Bitcoin's price action did not reach the key pressure zone预设 last week, and the self-built Momentum Quantitative Model and Spread Trading Model did not trigger top signals, we strictly followed the既定 short-term strategy and did not open any positions last week.
2. Mid-term Strategy Review:
Mid-term Strategy: Continued holding the 60% short position built around $89,000 as planned. As of last week's close, the profit was 24.01%.
3. Last Week's Core Levels Review:
Resistance: $72,000~$74,500 area
Support: Around $65,000
III. Bitcoin Technical Indicator Analysis: Comprehensive Judgment Based on Multiple Models and Dimensions
Combining market movements, the author conducts an in-depth analysis of多项 technical indicators for Bitcoin from the perspectives of multiple models and multiple dimensions, based on a self-built trading system.
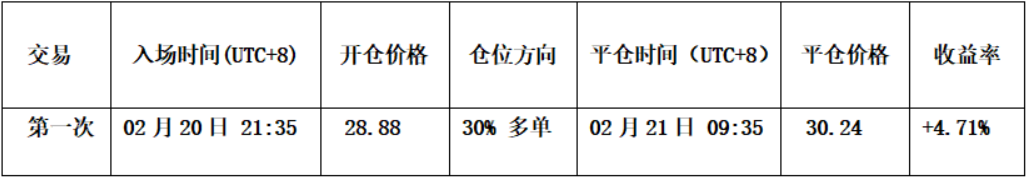
1. As shown in (Figure 2), analysis from the Weekly Chart:
Bitcoin Weekly K-line Chart: (Momentum Quantitative Model + Sentiment Quantitative Model)
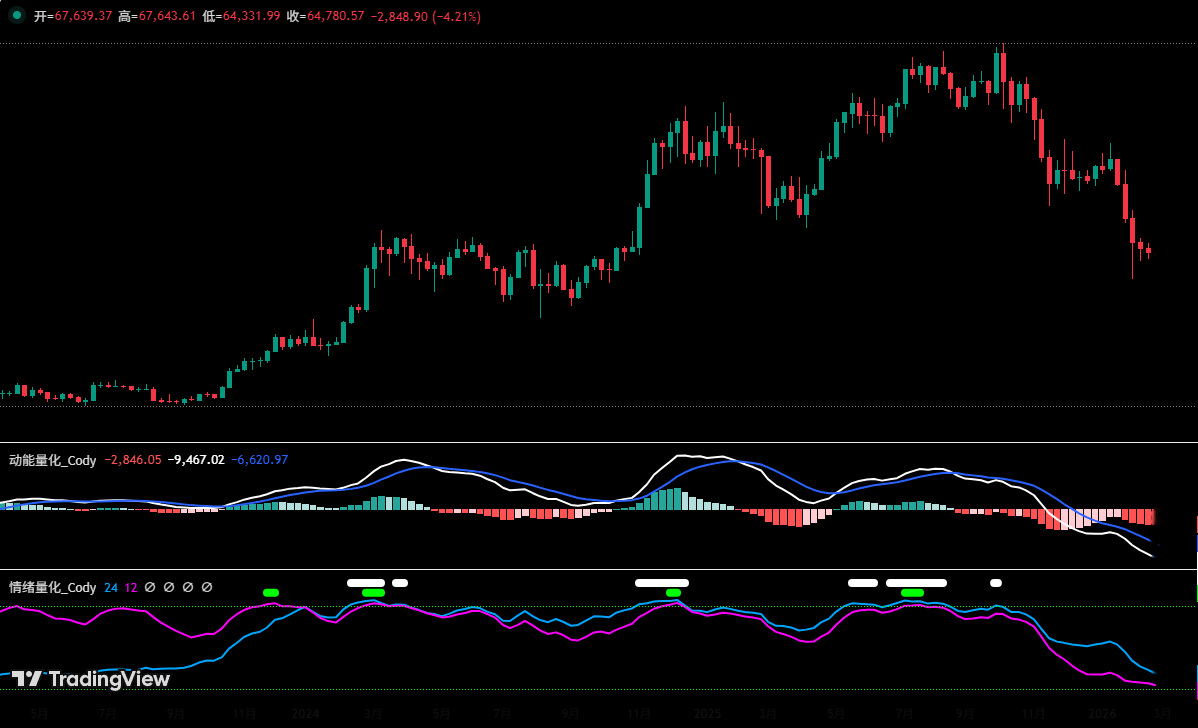
Figure 2
• Momentum Quantitative Model: Technical indicators show the momentum line declining synchronously, with negative energy bars gradually放大 for 4 consecutive weeks, showing no momentum divergence signal.
Momentum Quantitative Model Indicates: Probability of price decline: High
• Sentiment Quantitative Model: Blue sentiment line value 27, intensity zero; Purple sentiment line value 10, intensity zero; peak value is 0. This means market oversold panic sentiment has not yet appeared.
Sentiment Quantitative Model Indicates: Bottom support index: Neutral
• Digital Monitoring Model: Bottom digital monitoring signal has not appeared.
Digital Monitoring Model Indicates: Digital bottom signal not present; Last week's K-line closed as a small阴线 with a decline of about 1.73%. The chart shows the price has presented a "lower highs, higher lows" pattern for three consecutive weeks, overall forming a收敛形态.
The above data预示:Bitcoin's weekly trend is bearish, with narrowing declines. It is highly likely a下跌中继形态.
2. As shown in (Figure 3), analysis from the Daily Chart:
Bitcoin Daily K-line Chart: (Momentum Quantitative Model + Sentiment Quantitative Model)
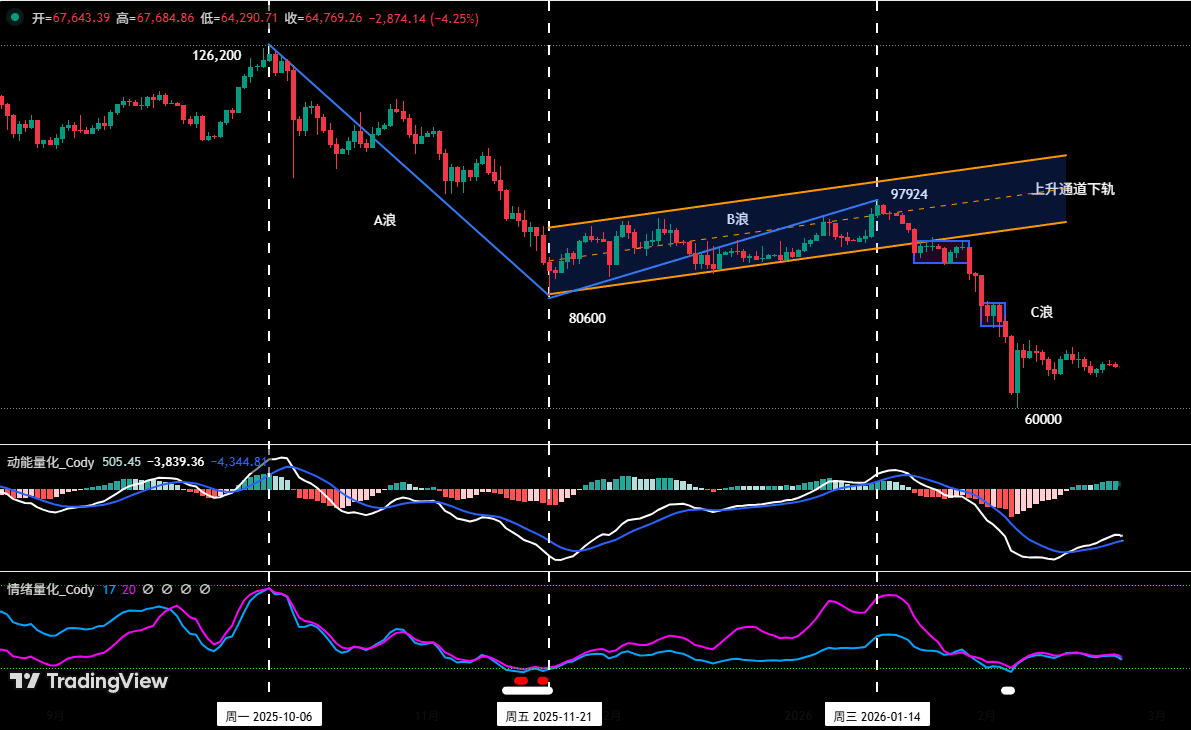
Figure 3
• Momentum Quantitative Model: Last week's行情 overall showed a "narrow-range横盘震荡" pattern. The momentum line formed a "golden cross" below the zero axis and moved up synchronously, with positive energy bars gradually放大.
Momentum Quantitative Model Indicates: Bullish反弹 momentum is being released, need to observe volume changes.
• Sentiment Quantitative Model: After the previous Sentiment Quantitative Model triggered a bottom预警 signal (white dot), the sentiment line direction拐头 upward. Currently, the blue sentiment line value is 20, intensity zero; the purple sentiment line value is 22, intensity zero. The two lines are almost粘合 together,脱离 the oversold area slowly.
Sentiment Quantitative Model Indicates: The sentiment line拐头 upward, the timeliness of the bottom预警 signal has been verified by the market; but the粘合 state of the two sentiment lines indicates that mid-term and short-term buying funds are not active, and the price反弹力度 is weak.
The above data提示:The daily bearish trend has not changed. Short-term, the超跌反弹 trend is continuing.
IV. This Week's行情 Prediction: (02.23~03.01)
1. Bitcoin Rising中枢 Construction (Based on行情 after the February 6 low):
Bitcoin 4-hour K-line Chart
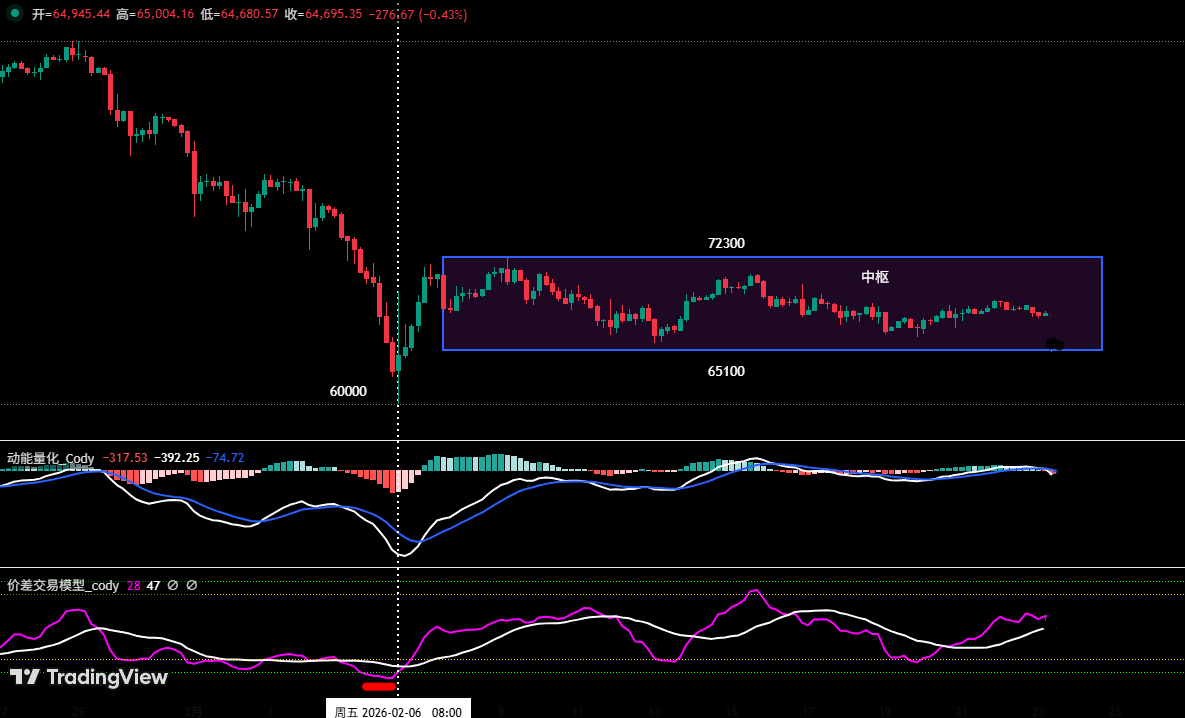
Figure 4
Using Bitcoin's 4-hour chart as the operation cycle:
• Central Pivot Determination: From the 4-hour chart: The probability of currently constructing a "rising中枢" structure is high. Its upper resistance is around $72,300, and the lower support is around $65,100.
• Core推演 and Operation Plan:
• Scenario One (Breakout Failure): If the subsequent price反弹 cannot effectively站稳 above the中枢上轨 (approx. $72,300), it will continue to maintain the中枢震荡格局. Operation: Long positions should consider reducing on rallies.
• Scenario Two (Successful Breakout): If the subsequent price反弹 effectively stabilizes above the中枢, the breakout is confirmed. Operation: The uptrend may continue, long positions can be held temporarily, waiting for exit signals.
• Scenario Three: If the subsequent price adjustment effectively breaks below the中枢下轨 (approx. $65,100), it will test the support effect of the February 6 low again.
2. This Week's Core View: Focus on the battle between bulls and bears around the中枢上下轨. Strategically, firmly implement the operation principle of "Reduce positions (longs) on rallies, control risk".
3. Core Resistance Levels:
• First Resistance Area: $72,300-$74,500 area (Near the April 2025 low)
• Second Resistance Area: $79,500-$80,600 area (Near the Wave B starting point)
4. Core Support Levels:
• First Support: Around $65,000 (Previous K-line bottom分型 low)
• Second Support: $60,000-$62,500 area (Near the February 6 low)
• Third Support: Around $57,400 (Near the 210-week moving average)
V. This Week's Operation Strategy (Excluding Sudden News Impact): (02.23~03.01)
1. Mid-term Strategy: Maintain the 60% short position. If the反弹 effectively breaks above $74,500, reduce the position to 40%.
2. Short-term Strategy: Use 30% of the capital, set stop-loss points, and look for "spread" opportunities based on support and resistance levels. (Use 30-minute/60-minute as the operation cycle).
3. As the market's mid-term direction is bearish, short-term operations should follow the principle of "Follow the trend, go short on rallies". To dynamically respond to the market's complex evolution and combined with signals from the self-built trading model, we have formulated A/B two sets of short-term operation plans:
• Plan A: If the price反弹 to near the中枢上轨 $72,300:
• Entry: When the反弹 reaches this resistance level and triggers a resistance signal combined with a model top signal, establish a 15% short position.
• Risk Control: Initial stop-loss for the short position set above $75,500.
• Exit: When falling to near important support levels combined with model signals, gradually close the position to take profits.
• Plan B: If the price反弹 to near $74,500:
• Add Position: When the反弹 reaches this area and encounters resistance combined with a model top signal, add a 15% short position.
• Risk Control: Initial stop-loss for the short position set above $75,500.
• Exit: When falling to support levels combined with model signals, gradually close the position to take profits.
VI. Special Notes:
1. When opening a position: Immediately set the initial stop-loss level.
2. When profit reaches 1%: Move the stop-loss to the entry price (break-even point) to ensure capital safety.
3. When profit reaches 2%: Move the stop-loss to the 1% profit level.
4. Continuous Tracking: Thereafter, for every additional 1% profit, move the stop-loss同步 by 1%, dynamically protecting and locking in profits.
Financial markets change rapidly. All行情 analysis and trading strategies require dynamic adjustment. All views, analytical models, and operation strategies involved in this article originate from personal technical analysis and are solely for personal trading log purposes. They do not constitute any investment advice or basis for operation. The market involves risks, investment requires caution. Please do not make decisions based on this.