Author: Nancy, PANews
Since hitting its all-time high of approximately $126,000 in October last year, Bitcoin has been stuck in a correction, failing to regain its upward momentum. Recently, traditional assets like US stocks and gold have led the recovery, with market risk appetite gradually warming up. However, Bitcoin has continued its sideways movement, missing out on a synchronous rebound.
Now, with ETF funds flowing back in and some long-term indicators hitting historical lows, why hasn't Bitcoin started its recovery? Is the current adjustment nearing the bottom of the cycle?
US Stocks and Gold Rise Together, Why is Bitcoin Falling Behind?
After the severe volatility and sharp correction in the US stock market in late July, capital has returned to risk assets, and US stocks have quickly embarked on a rebound. Both the S&P 500 and the Dow Jones Industrial Average have substantially recovered their previous losses, reaching new all-time highs this week. Tech stocks have been the core driver of this rebound, with semiconductor and AI-related sectors surging, significantly boosting market sentiment.
Meanwhile, the precious metals sector has regained favor. Spot gold has risen for several consecutive days, once breaking through the $4,400 per ounce mark to hit a near two-month high; silver prices have also climbed, with spot silver once reaching the $66 per ounce range, setting a new seven-week high.
However, Bitcoin has not enjoyed a synchronous recovery. During the recent period of pressure on risk assets, Bitcoin also performed weakly. And now, with US stocks and gold strengthening again, Bitcoin continues to move independently in a sideways pattern.
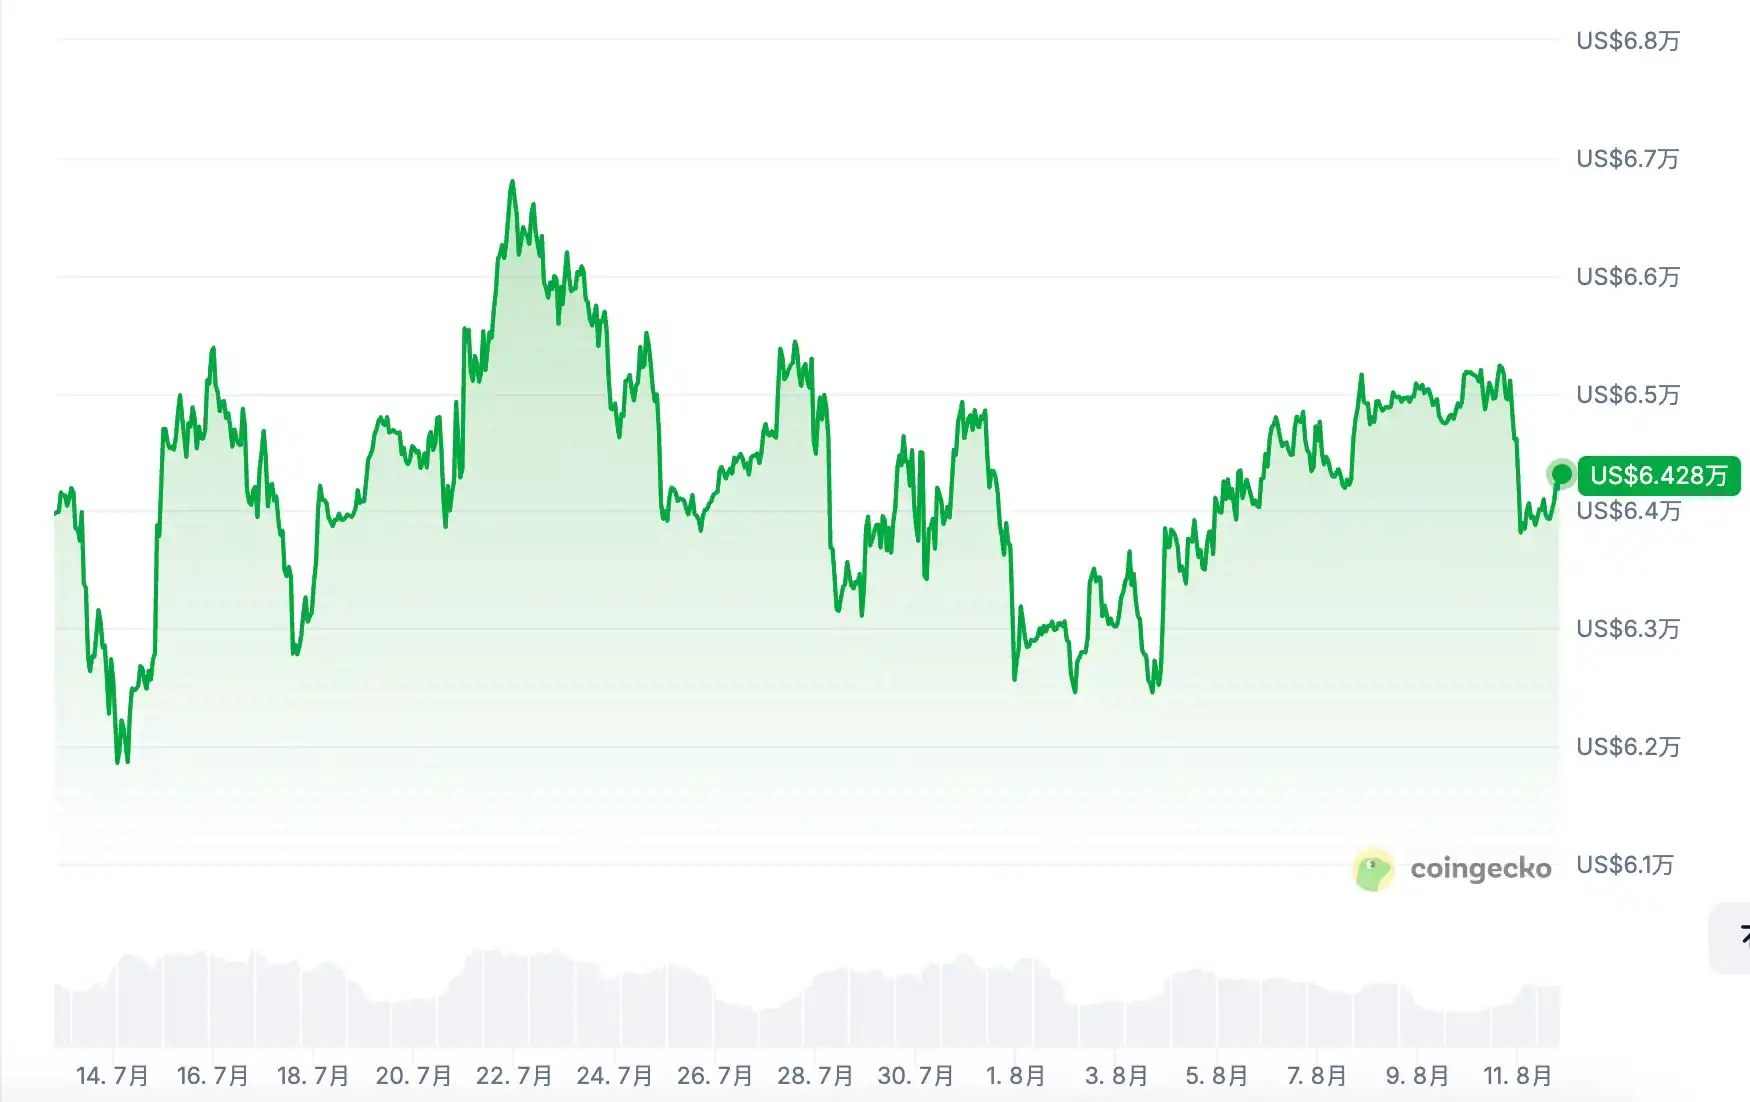
According to CoinGecko data, Bitcoin's price has been range-bound over the past 30 days, fluctuating repeatedly between $62,000 and $66,000.
Glassnode points out that over the past 90 days, the S&P 500 has risen about 5%, while Bitcoin has fallen 20%, showing diverging trends even in the past week. Until Bitcoin reestablishes its relative strength against US stocks, the market will remain dominated by US stock movements.
Although on-chain transaction volume has surged recently, and spot ETF fund flows have noticeably improved, the capital inflows have not yet effectively fueled price increases.
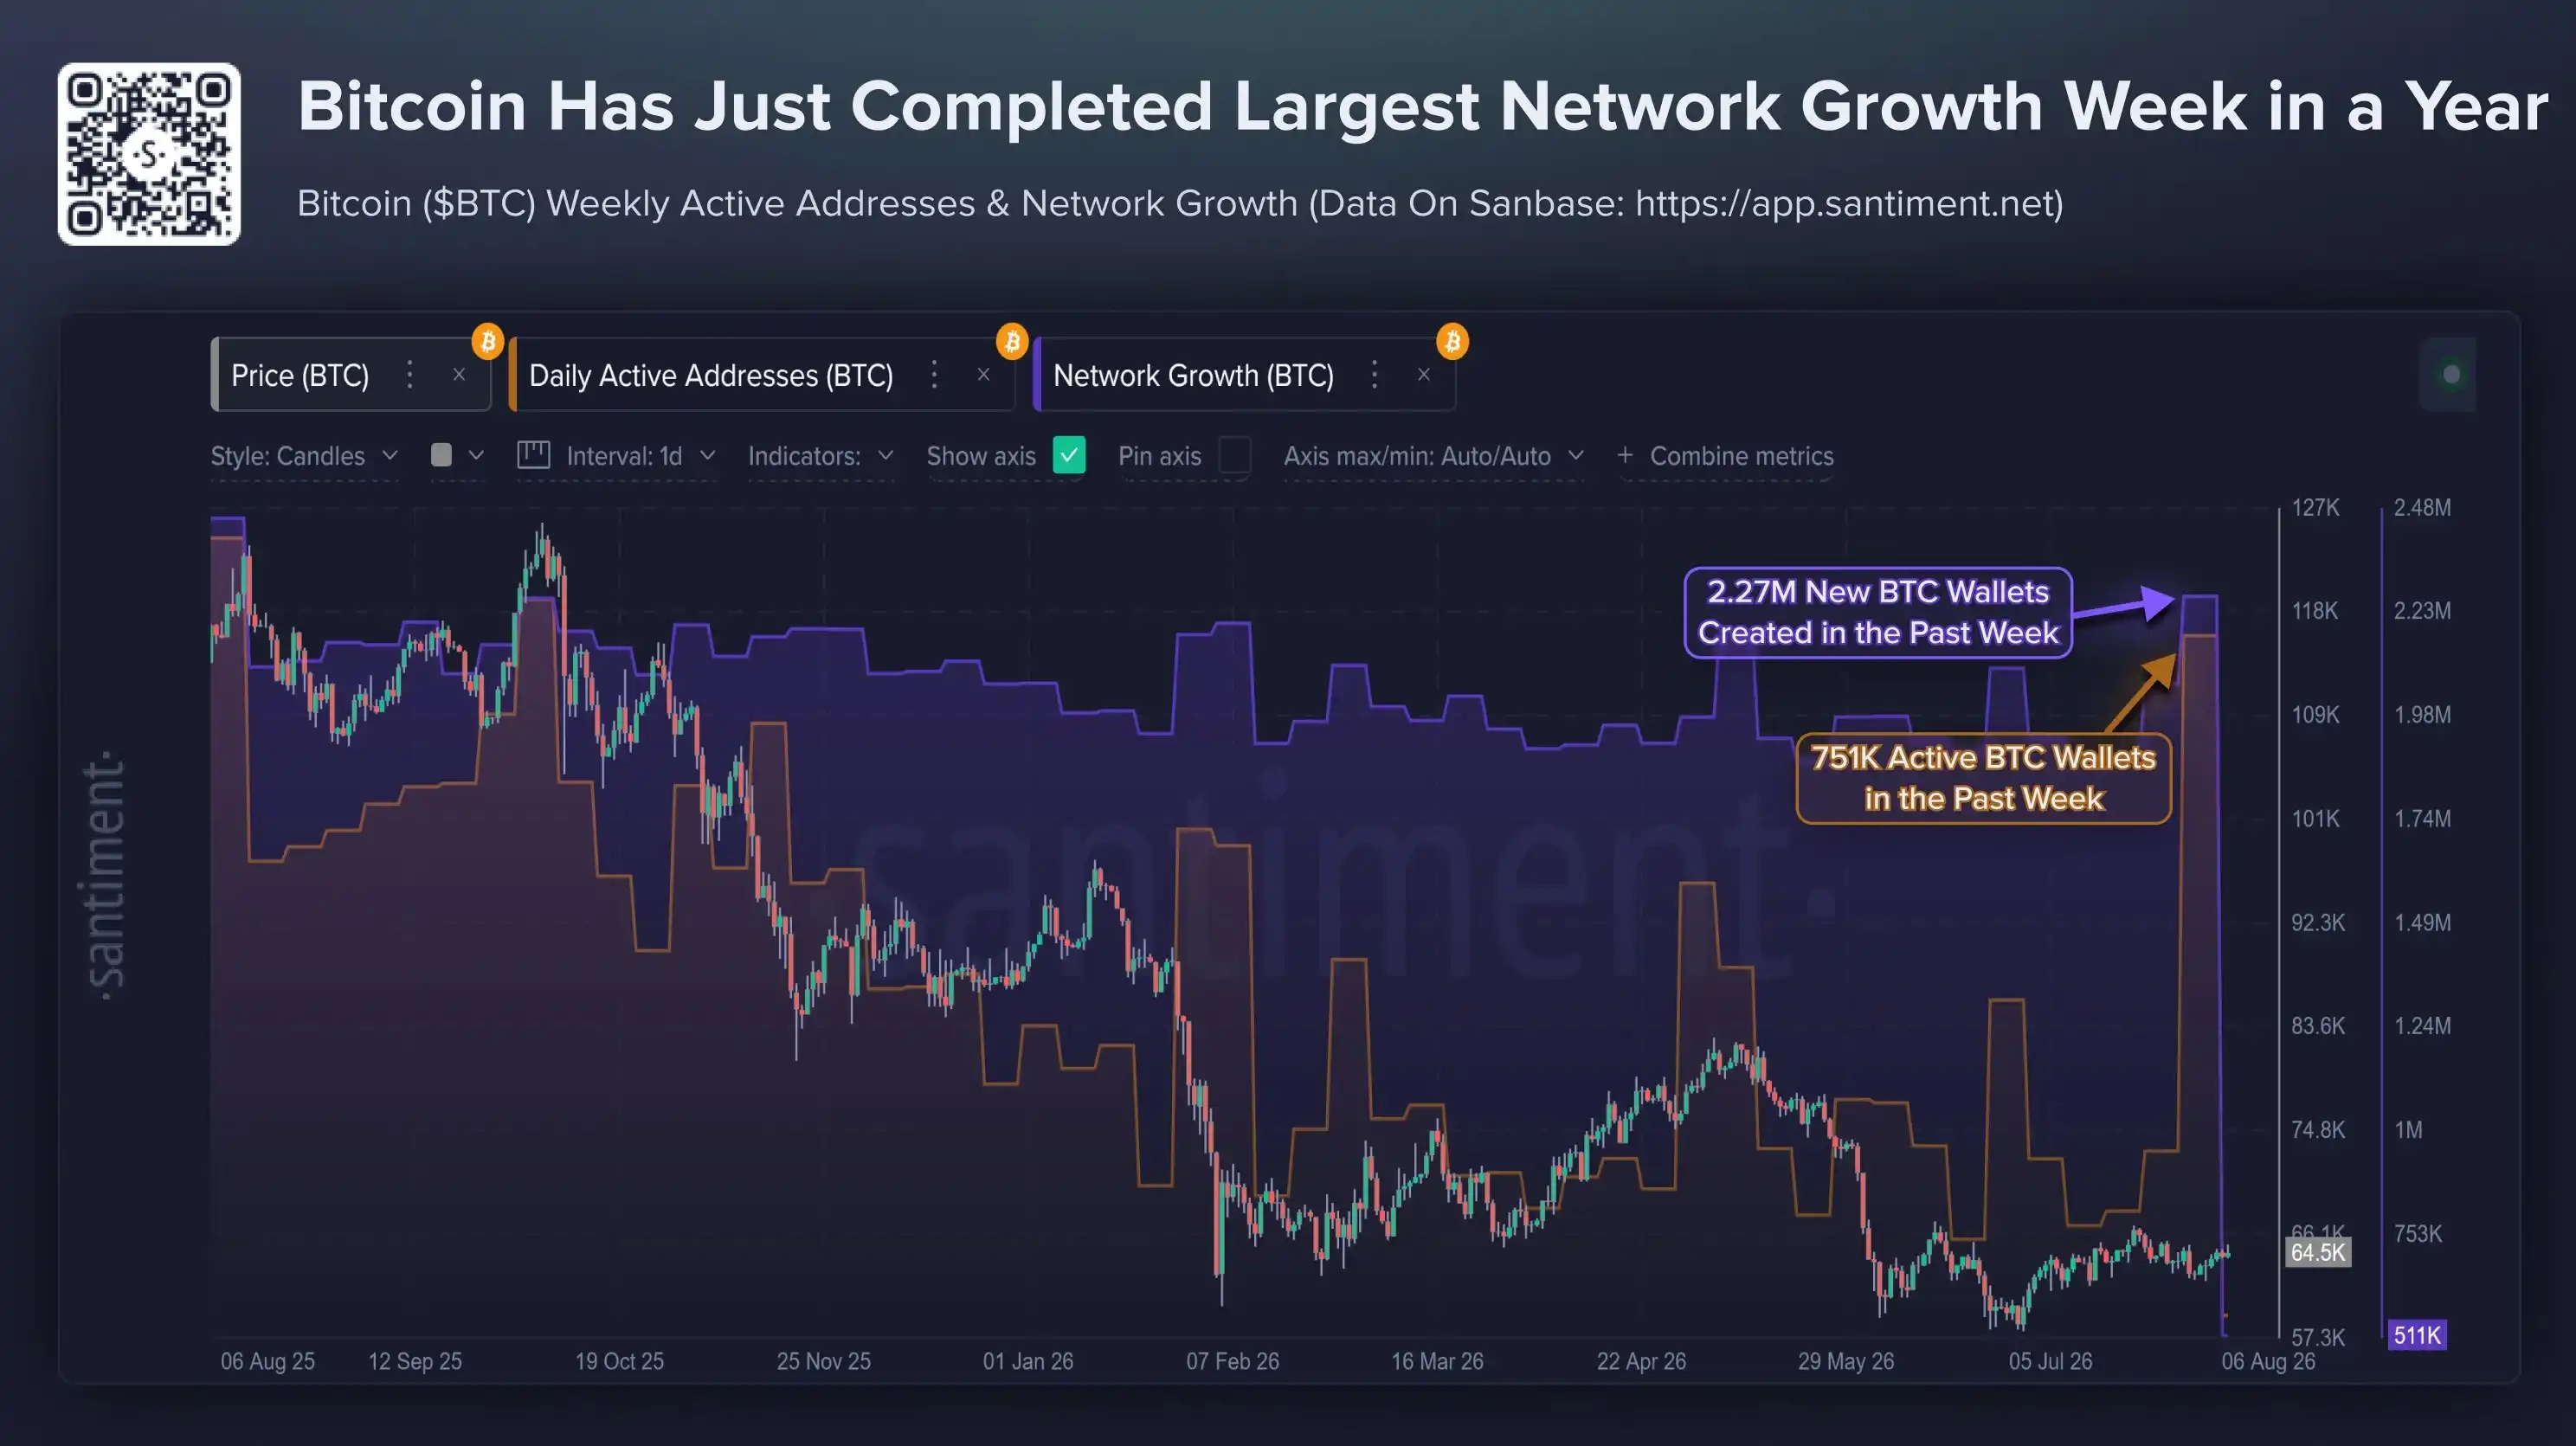
Looking at on-chain activity, Santiment Intelligence data shows that over the past week, new BTC wallet creations reached 2.27 million, the highest level in nearly a year; active wallet numbers hit 751,000, a 10-month record. However, a significant catalyst for this on-chain activity growth was security concerns triggered by the Coldcard wallet incident. This event prompted some users to transfer funds, create new wallets, adjust custody solutions, and reassess asset security risks, thereby driving a notable increase in wallet creation and on-chain interactions.
Regarding ETF inflows, SoSoValue data shows that last trading week, US Bitcoin spot ETFs recorded net inflows for five consecutive trading days, with a cumulative net inflow of $854 million, marking the best weekly performance since April 17th. So far in August, the cumulative net inflow for Bitcoin spot ETFs has already exceeded four times the total for the entire month of July. This change has reversed the previous sustained outflow pressure. From May to July, US Bitcoin spot ETFs saw a cumulative net outflow of over $6.59 billion, enduring eight consecutive weeks of capital withdrawal. However, the scale of the recent ETF fund recovery remains insufficient to drive a Bitcoin price rebound. Market analysis suggests recent inflows are mainly driven by changes in custody demand and weaker employment data improving expectations for rate cuts. The current buying scale is difficult to fully offset the ongoing market selling pressure.
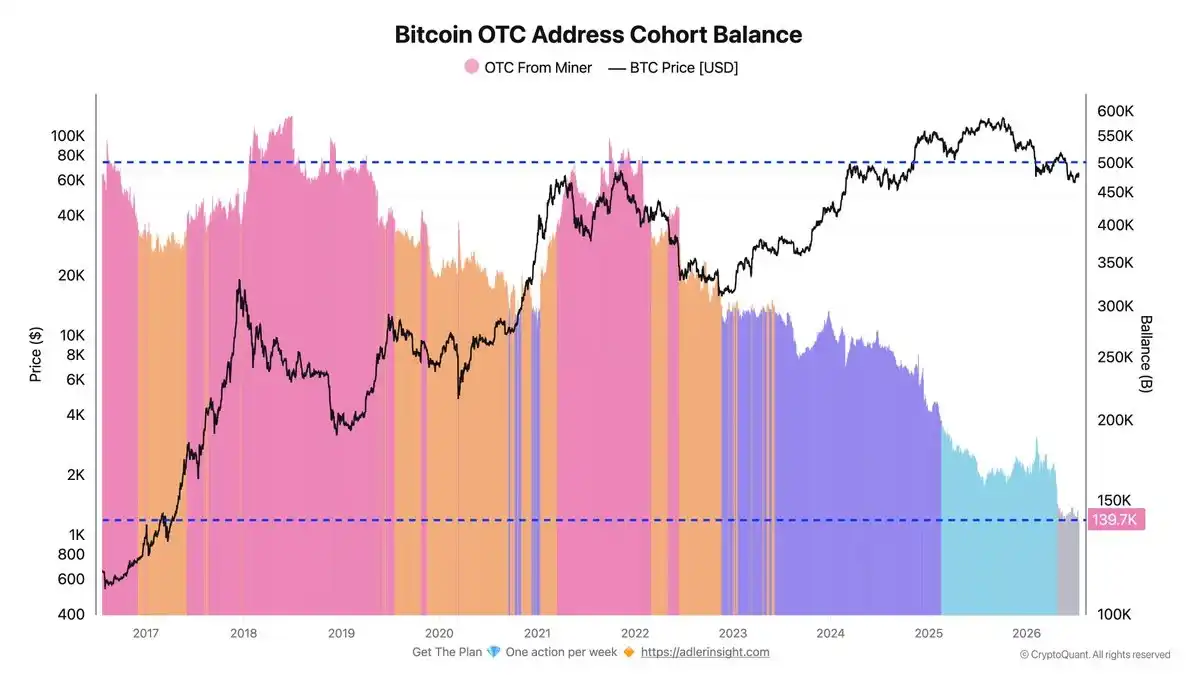
Currently, the Bitcoin market faces persistent selling pressure from miners and crypto asset management companies. As profit margins shrink, operational costs rise, and the demand for AI data center transformation grows, some mining companies have begun selling Bitcoin assets to cover cash flow needs, repay debt, or adjust business direction. CryptoQuant data shows that since November 2021, the BTC balance held in miner-related OTC addresses has dropped from about 500,000 BTC to 139,700 BTC, a decline of nearly 72%.
Meanwhile, crypto asset management companies are also adjusting their Bitcoin holdings, selling portions of their assets to supplement liquidity, repurchase shares, or pay shareholder returns, with some even liquidating to survive. For example, since late June, MicroStrategy has sold a cumulative 6,948 BTC, cashing out approximately $432 million.
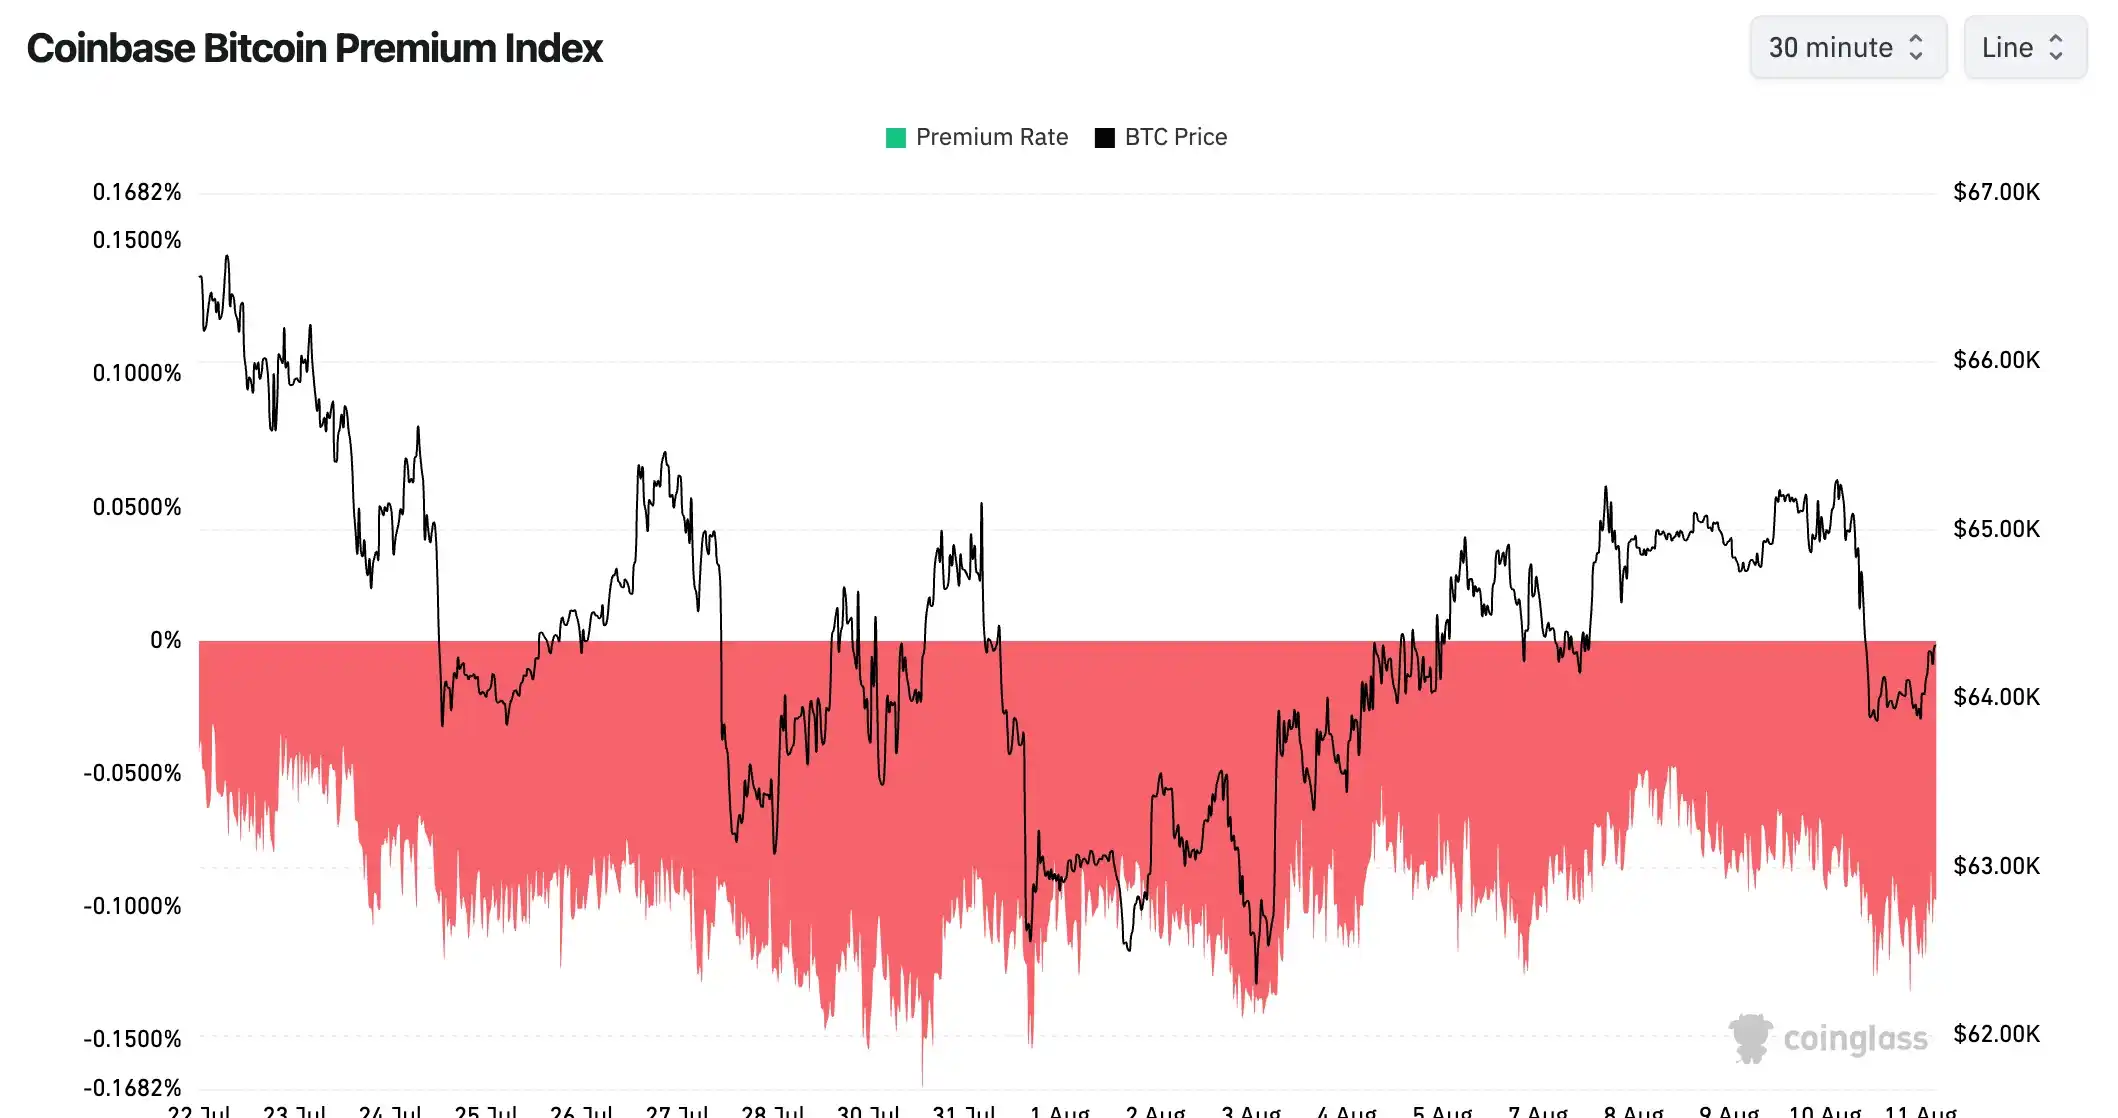
Furthermore, buying power in the US spot market remains weak. Coinglass data shows that the Coinbase Bitcoin Premium Index has remained negative for 80 consecutive days (since May 19th), with the latest figure at -0.0868%, marking the longest negative premium cycle in history—twice the previous 40-day record. Historical data indicates that a sustained negative premium on Coinbase typically signals weak buying demand from US investors or persistent strong selling pressure in the market.
Bottom-Fishing Signals Appear Locally, Cycle Bottom Still Awaiting Confirmation
Historically, after reaching a cycle top, Bitcoin typically takes about 12 to 13 months to reach its final bottom. If this cycle follows the historical rhythm, the market cycle low might not occur until the fourth quarter of 2026. Currently, have any bottom-fishing signals appeared for Bitcoin?
The bottom-fishing indicator list tracked by PANews's crypto market data and cycle indicator platform, PAData, shows that only some bottoming signals have appeared for Bitcoin so far.
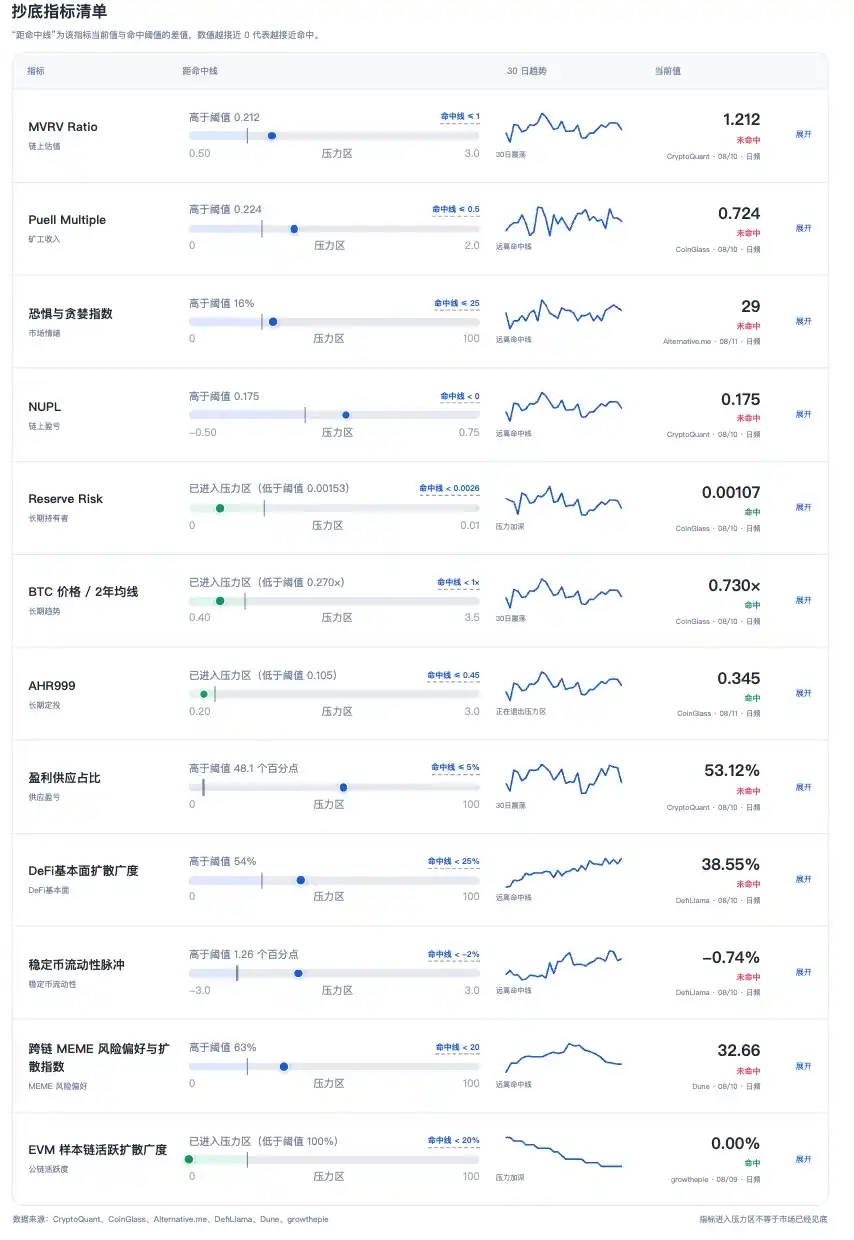
This indicator list covers multiple data sources including CryptoQuant, CoinGlass, Alternative.me, DefiLlama, Dune, and growthepie. Among them, the "Distance to Hit Line" measures the gap between the current indicator value and the historical bottom-fishing threshold; the closer the value is to 0, the closer it is to triggering a historical bottom-fishing signal.
Among the 12 core bottom-fishing indicators, four have currently entered the "hit zone": Reserve Risk (Long-Term Holders), BTC Price / 2-Year Moving Average, AHR999 (Long-Term DCA), and EVM Sample Chain Active Diffusion Breadth.
Specifically, Reserve Risk has dropped to 0.00108, the BTC Price / 2-Year MA indicator has fallen to 0.73x, AHR999 has reached 0.345, and the EVM Sample Chain Active Diffusion Breadth has dropped to 0. These indicators primarily reflect long-term holder confidence, price cycle position, and on-chain ecosystem activity levels. They have now entered historical stress zones, indicating that Bitcoin's current price shows a significant discount compared to its long-term trend, and its long-term allocation value is increasing.
However, an indicator entering a stress zone does not equate to the market having bottomed. Historical cycles show that Bitcoin bottoms are usually not triggered by a single indicator but emerge when multiple dimensions reach extreme levels simultaneously.
Currently, judging by indicators related to valuation, market sentiment, capital liquidity, and on-chain profit status, the market still has some distance from historical extreme bottoms.
In terms of valuation, the MVRV Ratio (on-chain valuation) is currently 1.212, having not yet broken below the historical undervaluation line of 1. MVRV compares the relationship between Bitcoin's market value and realized value to gauge the overall profit state of the market. Historical data shows that when this indicator falls below 1, it typically signifies the market has entered a deep correction phase, often corresponding to accumulation zones in the late stages of a bear market.
Regarding on-chain profit status, NUPL is currently 0.175, still not negative. This indicator measures the net value of unrealized profits and losses in the market. When NUPL falls below 0, it means the entire network's holders are in an overall loss state. Meanwhile, the miner revenue indicator Puell Multiple is currently 0.755, still some distance from the historical stress region below 0.5. Historical data shows that significant macro bottoms have occurred when Puell Multiple was below 0.5.
In terms of market sentiment, the Fear & Greed Index is currently at 29, indicating the market is in a state of fear, but still some distance from extreme fear levels. This suggests investor risk appetite is declining but hasn't yet reached the level of large-scale panic selling often seen at cycle bottoms.
In terms of supply structure, the percentage of supply in profit remains at 53.12%, meaning over half of the Bitcoin supply is still profitable. In historical bottom phases, this indicator typically falls below 5%, indicating the market often needs more thorough loss realization and筹码 transfer.
In terms of liquidity, the Stablecoin Liquidity Pulse is currently -0.74%, indicating a contraction in stablecoin funding conditions. Historical observation shows that when this indicator falls below -2%, it usually corresponds to a significant reduction in the supply of fiat-backed stablecoins within 30 days, indicating intensified market liquidity pressure. Currently, this indicator still has some distance from the extreme contraction zone.
Additionally, some on-chain ecosystem indicators have not shown comprehensive bottom signals. Currently, the DeFi Fundamental Diffusion Breadth is 38.55%, still some distance from the deep contraction zone (0-25%). This indicator measures the diffusion degree of DeFi operational activities; entering low levels typically signifies widespread contraction in industry activity. The Cross-Chain MEME Risk Appetite Index is 32.66, above the "cooling zone" (0-20) hit boundary, indicating that although market risk appetite has clearly declined, capital has not yet fully entered an extremely quiet state.
In summary, Bitcoin is currently showing some market bottom signals, but the market still lacks sufficient confirmation for a cycle reversal. Whether Bitcoin can initiate a recovery going forward still depends on the sustainability of capital inflows, the release of selling pressure, and further changes in key on-chain indicators.