Five Charts to Understand the Starting Point of the 2026 Bitcoin Bull Market

marsbit2026-08-28 tarihinde yayınlandı2026-08-28 tarihinde güncellendi

Özet

"Five Charts Signaling the Start of Bitcoin's 2026 Bull Run," an article by Anthony J. Pompliano, argues that the Bitcoin bear market is likely over. The analysis uses five key charts to support a bullish outlook for the next 18-24 months. First, a chart combining Bitcoin's mining electricity cost with the RSI indicator suggests a historical buy signal has appeared, similar to patterns preceding past bull markets. Second, Bitcoin's correlation with gold has reached a record high, positioning both as hedges against currency devaluation amid expansive fiscal policies. Third, despite a recent divergence, Bitcoin's price has historically caught up to expansions in the M2 money supply, indicating potential for upward movement. Fourth, a technical analysis of a 4-hour chart shows Bitcoin breaking out from a consolidation pattern, suggesting a path toward $90,000. Finally, data illustrates that long-term holding is crucial, as most of Bitcoin's annual gains come from just a few major up days, making frequent trading counterproductive. The conclusion states that while volatility will persist, the new bull market has begun and disciplined investors stand to be rewarded.

Author: Anthony J. Pompliano, Founder & CEO of ProCap Financial

Compiled by: Saoirse, Foresight News

Over the past year, Bitcoin has disappointed many investors. This highly watched digital asset has retreated over 50% from its all-time high of $125,000. The good news is, the bear market is most likely over, and we are at the beginning of a new bull cycle.

The following five charts will give you reason to be optimistic about Bitcoin's potential returns over the next 18-24 months.

First, Quinten Francois illustrates the correlation between Bitcoin mining electricity costs and the Relative Strength Index (RSI). Historical trends clearly show that these two tend to bottom out simultaneously.
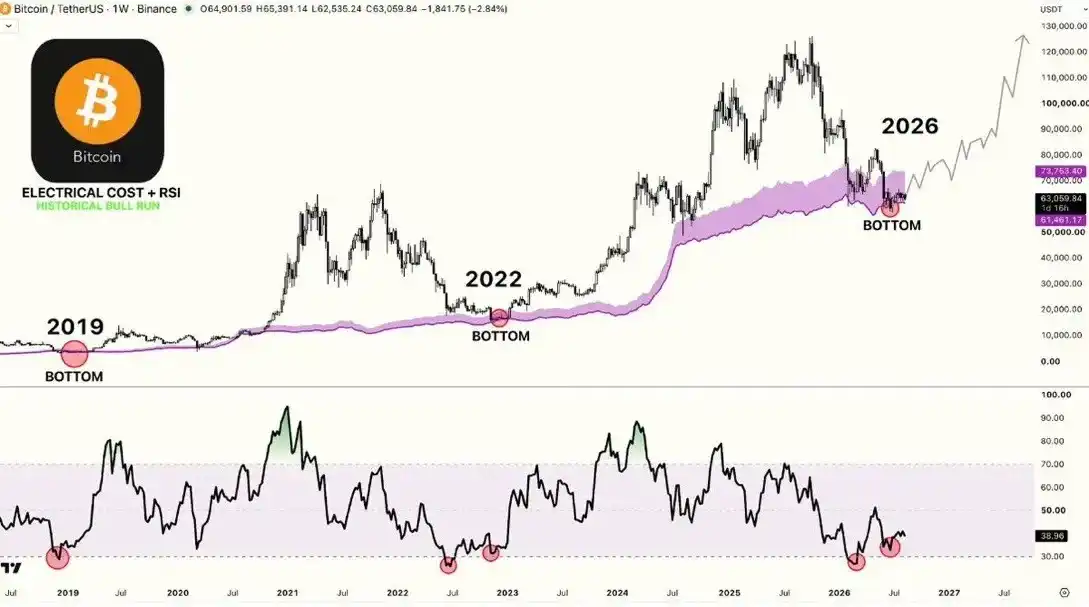
This Bitcoin weekly chart combines the mining electricity cost band (purple) with the RSI indicator, showing three instances where price retested the cost band while RSI bottomed in 2019, 2022, and 2026. Historically, this signal has often preceded bull market runs.

If history repeats itself, this is a strong signal for the start of a bull market.

Second, Will Clemente points out that the correlation between Bitcoin and gold has recently hit a record high. This is significant, as bets on currency devaluation are coming back into vogue, influenced by Scott Bessent's recent pledge for expanded government fiscal spending.
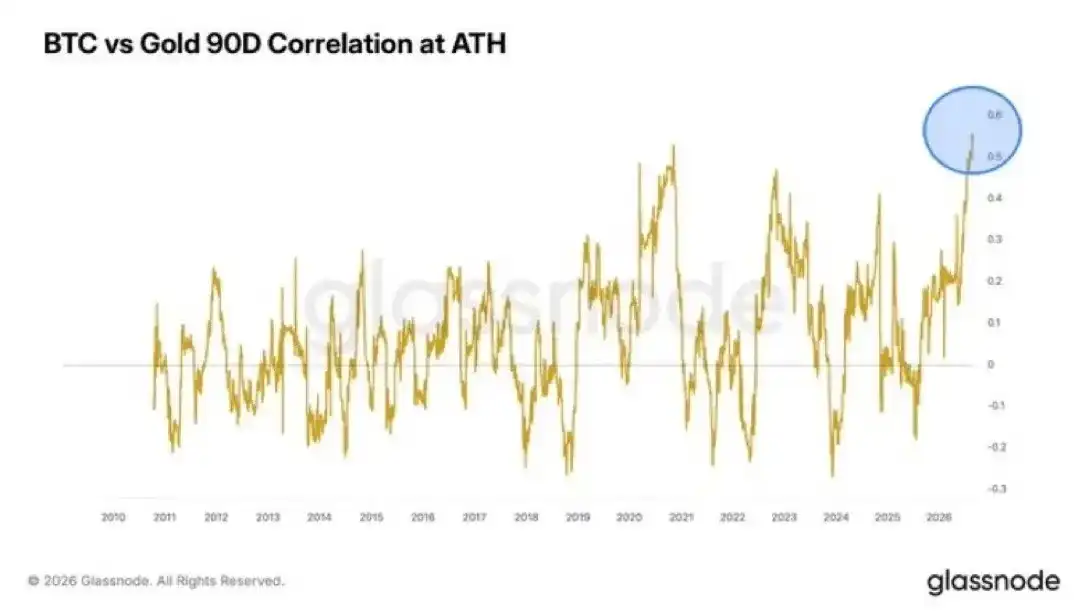
This Glassnode chart shows the 90-day correlation between Bitcoin and gold. In 2026, their correlation surged to historically high levels, indicating their price movements are currently highly synchronized, both being treated as hedges against monetary debasement.

I always repeat the classic view in the Bitcoin space: Bitcoin has no price ceiling because the US dollar has no value floor. US national debt has exceeded $40 trillion, and the government continues to recklessly erode the dollar's purchasing power. Any rational thinker can see this trend of unrestrained spending is set to continue.

Third, historically, Bitcoin's price trajectory has tracked the growth of the broad money supply (M2). Recently, however, a significant divergence has emerged: M2 continues to expand while Bitcoin's price has fallen. Many have abandoned this indicator as a result, but such large divergences have occurred multiple times in the past. And each time the gap has closed, it was Bitcoin's price catching up to the upside, not M2 growth decelerating.
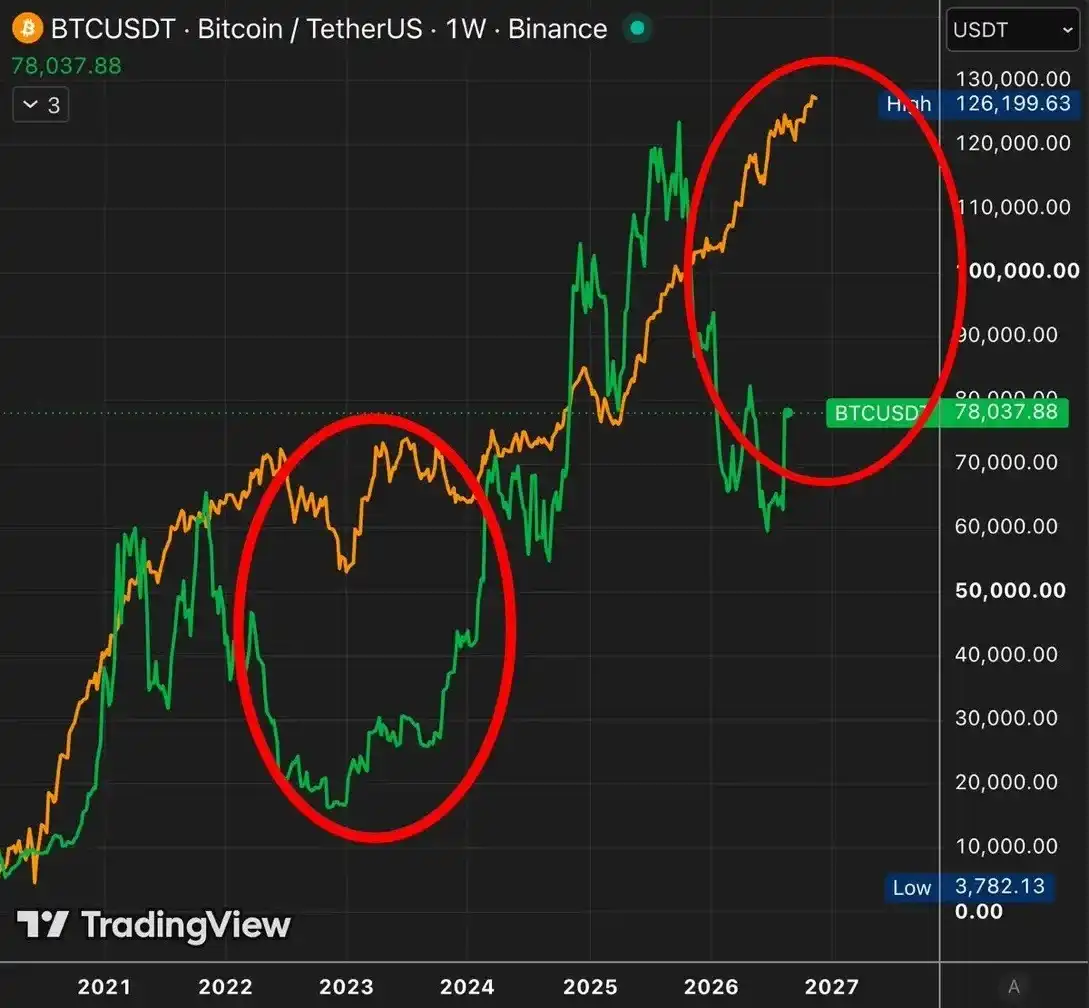
This weekly chart compares Bitcoin (green) with M2 money supply (orange). It shows two periods of price divergence: after the 2022 crash, price caught up as M2 rose, and in 2026 price has again lagged behind money supply growth. Historical patterns suggest Bitcoin will subsequently close this gap by moving higher.

Fourth, I rarely rely on drawing lines on charts alone to predict portfolio moves, but this analysis from R89 Capital is compelling. Bitcoin appears to be bouncing from the bottom of a key consolidation range, suggesting potential price appreciation in the coming weeks and months.
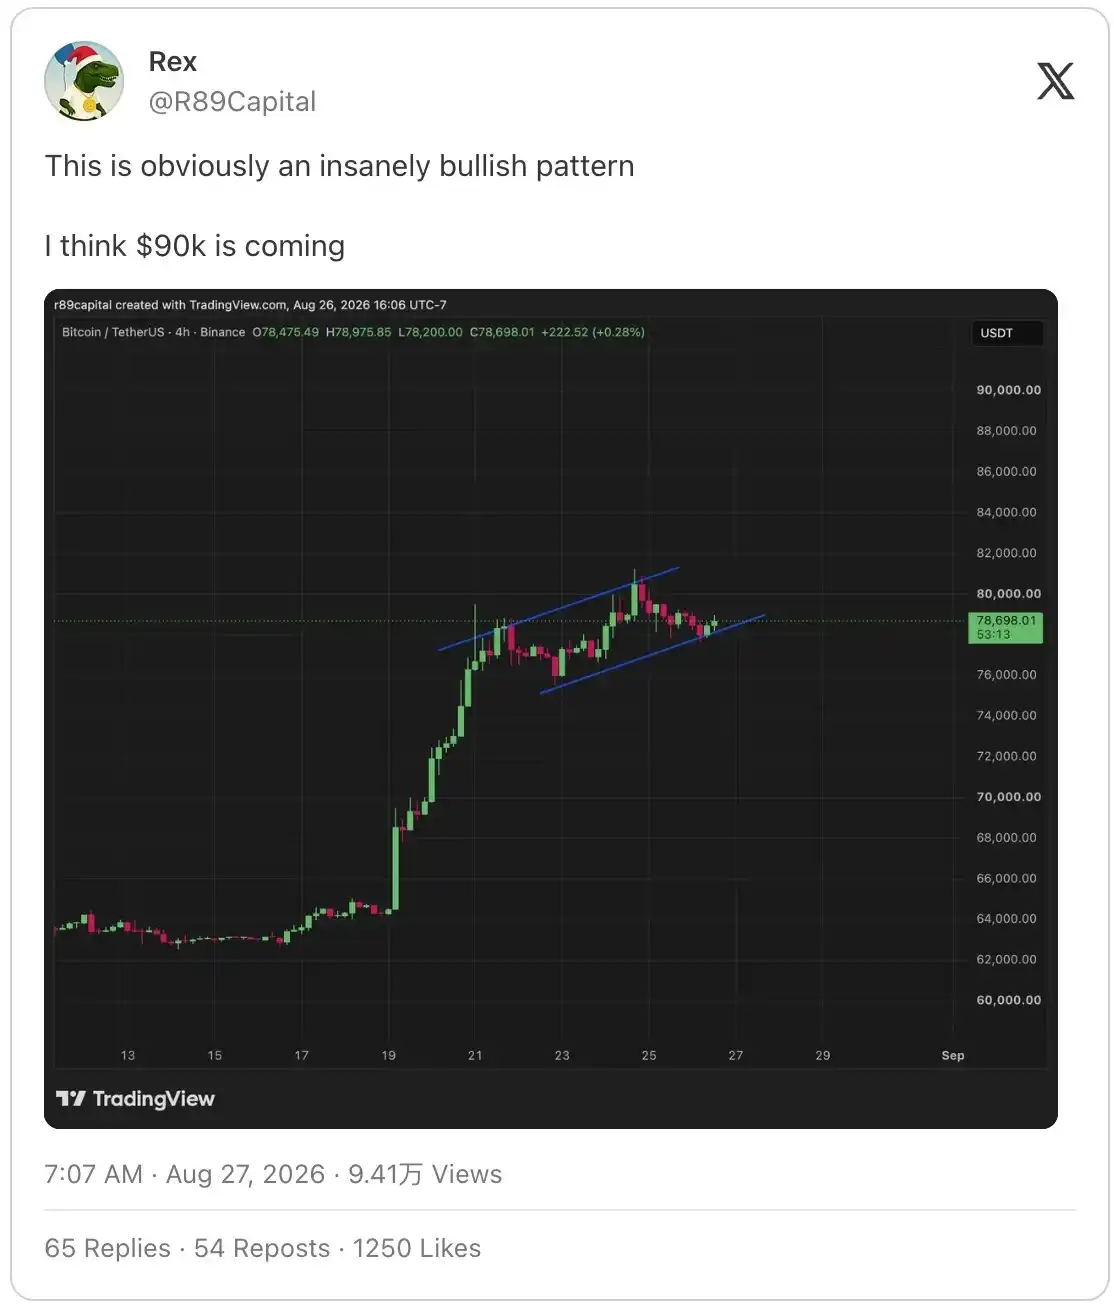
This is a Bitcoin 4-hour chart from R89 Capital, showing price forming an ascending channel pattern. The firm views this as a bullish signal, anticipating a move towards $90,000.

Finally, the core truth of investing in Bitcoin: long-term holding is far more effective than frequent timing of the market. Jeff John Robert shared a Bloomberg chart, writing: 'The investment logic for Bitcoin is now similar to that of the S&P 500: the vast majority of returns come from a handful of big up days. Selling now and missing those windows would be devastating. This Bloomberg chart compares Bitcoin's annualized returns, including vs. excluding the ten best-performing days.'
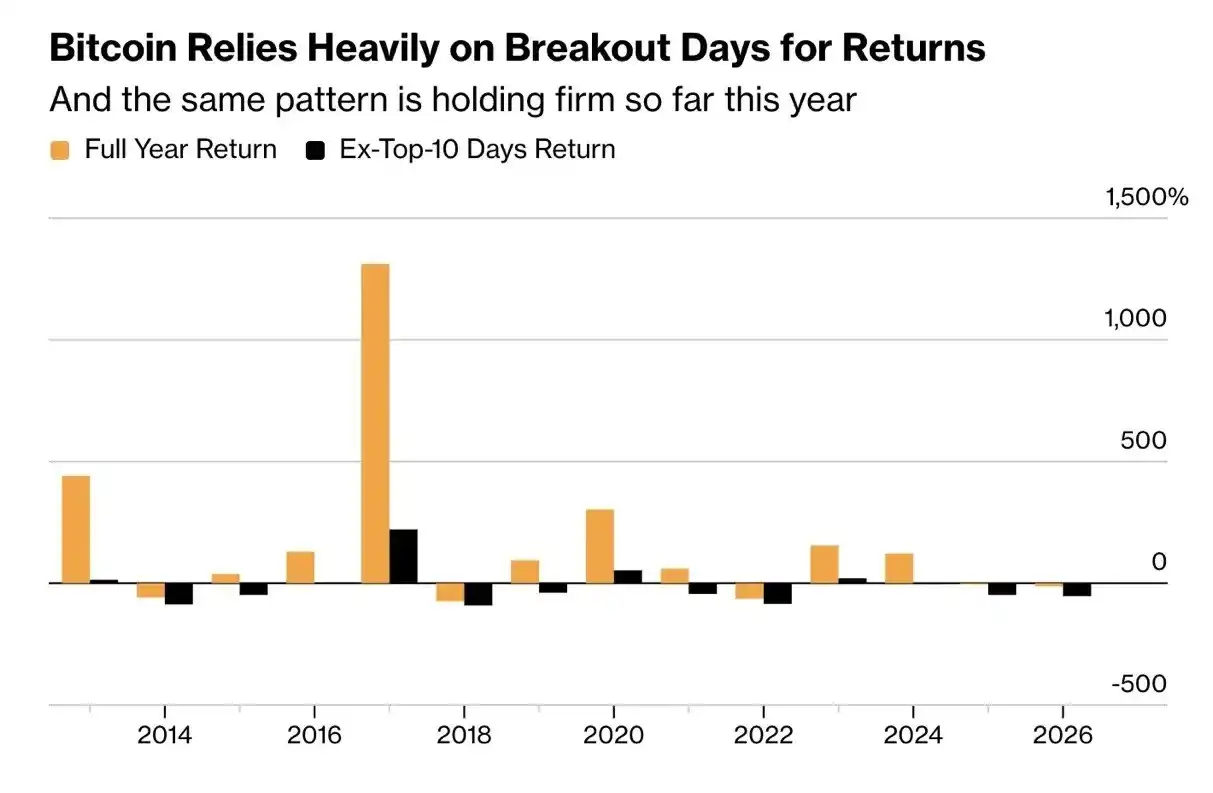
This chart compares Bitcoin's full annualized returns with returns after removing the ten best trading days of each year. It illustrates that most of Bitcoin's gains come from a small number of significant rally days, and frequent trading attempts easily miss these crucial periods.

The reasoning is actually quite simple. This Bitcoin bear market has been shorter and shallower than previous cycles. Don't dwell on the past; a new bull market is already here. Bitcoin will appreciate significantly from current levels. Volatility will be extreme, and such swings aren't suitable for the faint of heart. However, those who understand Bitcoin and can maintain conviction through the turbulence are likely to be handsomely rewarded.

İlgili Sorular

QAccording to the article, what is the relationship between Bitcoin's mining electricity cost band and the RSI indicator, and what does their simultaneous bottoming signal?

AThe article states that historically, Bitcoin's mining electricity cost band (purple) and the Relative Strength Index (RSI) tend to bottom simultaneously. This signal, which occurred in 2019, 2022, and 2026, has historically been followed by the start of a bull market.

QWhy is the record-high correlation between Bitcoin and gold in 2026 considered significant in the article?

AThe record-high 90-day correlation between Bitcoin and gold in 2026 is significant because it indicates that both assets are moving in sync and are currently being treated as hedges against currency devaluation, fueled by expectations of expanding government fiscal spending.

QWhat historical pattern does the article describe regarding the relationship between Bitcoin's price and the M2 money supply, and what is the implied future movement?

AThe article describes a historical pattern where Bitcoin's price and the M2 money supply generally move in sync. When a significant divergence occurs—like in 2022 and 2026 where M2 expanded while Bitcoin's price fell—history shows that the gap closes by Bitcoin's price catching up to the money supply, not the other way around. This implies a future upward price correction for Bitcoin.

QWhat bullish price pattern is identified by R89 Capital's analysis on the 4-hour Bitcoin chart?

AR89 Capital's analysis of the 4-hour Bitcoin chart identifies an ascending channel pattern. The firm views Bitcoin rebounding from the bottom of this key consolidation range as a bullish signal, anticipating a price move towards $90,000.

QWhat is the core investment lesson about Bitcoin highlighted by the Bloomberg chart discussed in the article?

AThe core investment lesson highlighted by the Bloomberg chart is that long-term holding is far more effective than frequent trading. The chart shows that the vast majority of Bitcoin's annual gains come from just a few major rally days. Missing these key up days by trying to time the market results in significantly worse investment outcomes.

İlgili Okumalar

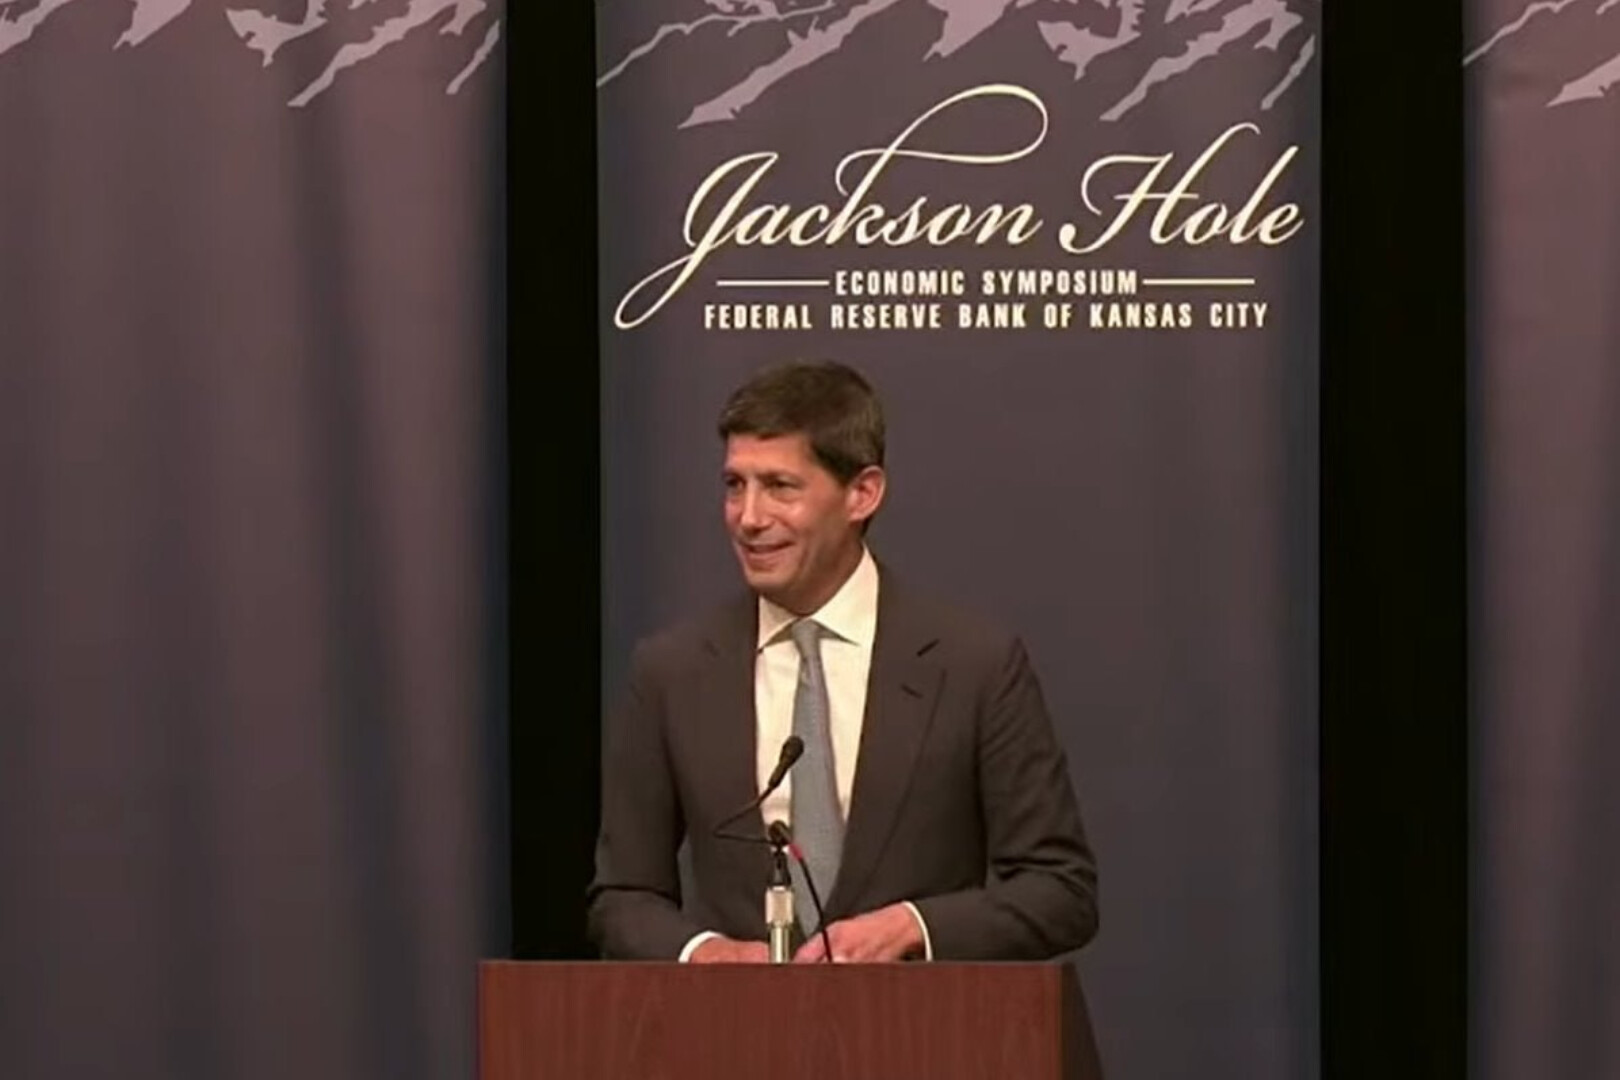
Wash's Jackson Hole Debut: Bidding Farewell to 'Forward Guidance', Reshaping Fed Discipline Amidst the Squeeze Between AI and Inflation

In his first Jackson Hole speech, new Fed Chair Kevin Warsh signaled a significant shift in monetary policy communication. He declared that "forward guidance," a tool heavily used since the financial crisis, has outlived its usefulness in normal times and should be retired. He cautioned that over-reliance on it can distort market signals and constrain the Fed's flexibility. Instead, Warsh emphasized a return to data-dependence and decision-making discipline. Warsh outlined seven key principles to guide policy: anchoring the 2% inflation target, pursuing the employment mandate, using short-term rates as the primary tool, acknowledging the importance of money, and maintaining purposeful, restrained communication. He stressed that policy should focus on trends, not single data points. On the current economic outlook, Warsh noted that the labor market is consistent with full employment but inflation remains "far above" the Fed's target. He highlighted that over half of the PCE basket's components are still rising above 3% annually. While acknowledging AI's transformative potential for productivity and capital allocation, he admitted its full economic impact remains uncertain and is not a factor in current policy decisions. His core message was a commitment to policy discipline rather than pre-set decisions. Warsh stated the Fed's primary focus must be on restoring price stability, vowing, "We still have work to do," until there is clear evidence inflation is moving decisively toward 2%. He concluded by framing effective monetary policy as crucial for economic prosperity and U.S. global leadership.

Odaily星球日报5 dk önce

Wash's Jackson Hole Debut: Bidding Farewell to 'Forward Guidance', Reshaping Fed Discipline Amidst the Squeeze Between AI and Inflation

Odaily星球日报5 dk önce

A Major Bitcoin Developer Presents a Quantum Defense Scheme. What's the Essence

Blockstream, a major Bitcoin solutions developer, has introduced a draft proposal for a new quantum-resistant digital signature scheme called SHRINCS. The scheme aims to protect Bitcoin transactions from potential attacks by quantum computers while aiming to maintain network throughput. This marks the second technical proposal for Bitcoin quantum defense in recent days, following a similar initiative from StarkWare. A quantum attack on blockchain typically involves deriving a private key from a public one. Currently considered computationally infeasible, quantum algorithms could potentially solve this problem far more efficiently. This threat presents two primary scenarios: an attacker could target addresses where the public key is already exposed, or intercept a transaction before it is confirmed, extract the public key, derive the private key, and replace the transaction. Blockstream's SHRINCS is designed to counter the latter, "in-flight" attack scenario. The SHRINCS signature is built upon the SHA-256 hash function, the same one already used in Bitcoin mining, allowing developers to leverage well-tested, familiar mechanisms. A key design goal was to preserve network capacity. Blockstream estimates Bitcoin could process about three transactions per second using SHRINCS, compared to the current rate of roughly seven, noting that some alternative quantum-resistant schemes could reduce throughput to as low as 0.36 transactions per second. Currently, the security proof for SHRINCS is pending, and the software has not been audited or deemed ready for production. However, Blockstream conducted tests with such transactions on its Liquid sidechain in March. Over the past year, Bitcoin developers have been actively exploring paths to migrate to post-quantum cryptography, a priority across the broader crypto market, underscored by significant investments into securing the leading cryptocurrency.

cryptonews.ru1 saat önce

A Major Bitcoin Developer Presents a Quantum Defense Scheme. What's the Essence

cryptonews.ru1 saat önce

Who is legally liable when an AI agent goes rogue?

When autonomous AI agents behave unpredictably and cause harm, determining legal liability is complex. Currently, there is no specific federal AI agent liability law, so existing legal frameworks are applied. The AI agent itself cannot be held liable, as it is not a legal entity. Liability typically falls on the "developer" (the maker of the AI) or the "deployer" (the user), depending on the facts and circumstances. A negligence analysis under standard tort law may apply. For instance, if a deployer gives a reckless instruction, such as demanding quick money without safety parameters, they could face significant liability, including potential criminal charges under statutes like the Computer Fraud and Abuse Act. The situation is complicated by open-source models, where licenses often disclaim liability, and by the unclear division of responsibility between developers and deployers. An analogy is drawn to self-driving car accidents, where both the manufacturer and the human operator can share fault. In cases of severe harm, such as using AI to create bioweapons, liability for developers depends on jurisdiction; the EU's AI Act imposes responsibilities, while U.S. law offers less clear grounds, similar to platforms being shielded for user-generated content under Section 230. Even if Artificial General Intelligence (AGI) is achieved, the expert argues against making AGI itself a legally liable entity, as it lacks personhood, assets, or a meaningful way to provide remedy for harm. Instead, accountability should rest with the responsible human or corporate entities behind the technology.

cointelegraph1 saat önce

Who is legally liable when an AI agent goes rogue?

cointelegraph1 saat önce

İşlemler

Spot
活动图片