A 25% Weekly Surge: Bitcoin Breaches $79,000 Amid Mass Short Liquidations

cryptonews.ru2026-08-21 tarihinde yayınlandı2026-08-21 tarihinde güncellendi

Özet

Bitcoin surged above $79,000 on August 21, marking a 25% weekly gain. The rally was fueled by massive short liquidations exceeding $1.2 billion in 24 hours, catching many bearish traders off guard. Analysts are monitoring key levels. The $70,000 zone is seen as crucial for maintaining the bullish trend, while $73,000-$74,000 is a significant resistance area. Breaking and holding above this zone could pave the way for moves toward $83,000. Several traders, including Crypto Candy and Roman, noted the rapid achievement of earlier targets ($70,700 and $75,000) and acknowledge the possibility of a short-term pullback, but the overall structure remains bullish. Daan Crypto Trades emphasized the importance of Bitcoin closing the weekly candle above the 200-period Exponential Moving Average (EMA) around the $73k-$74k range for increased confidence in a move toward May's highs. From a data perspective, comparisons are drawn to similar short-squeeze events in the past, like August of the previous year and summer 2021, where sharp rallies preceded significant corrections. Some analysis suggests such derivative-driven spikes may not always reflect genuine spot market demand, raising the question of whether the momentum will sustain or if a retest of the $73,000-$74,000 support is imminent.

Bitcoin climbed above $79,000 on August 21, with its gain for the week reaching 25%. This movement was accompanied by massive short position liquidations and became a topic of discussion among several analysts and traders on the social network X.
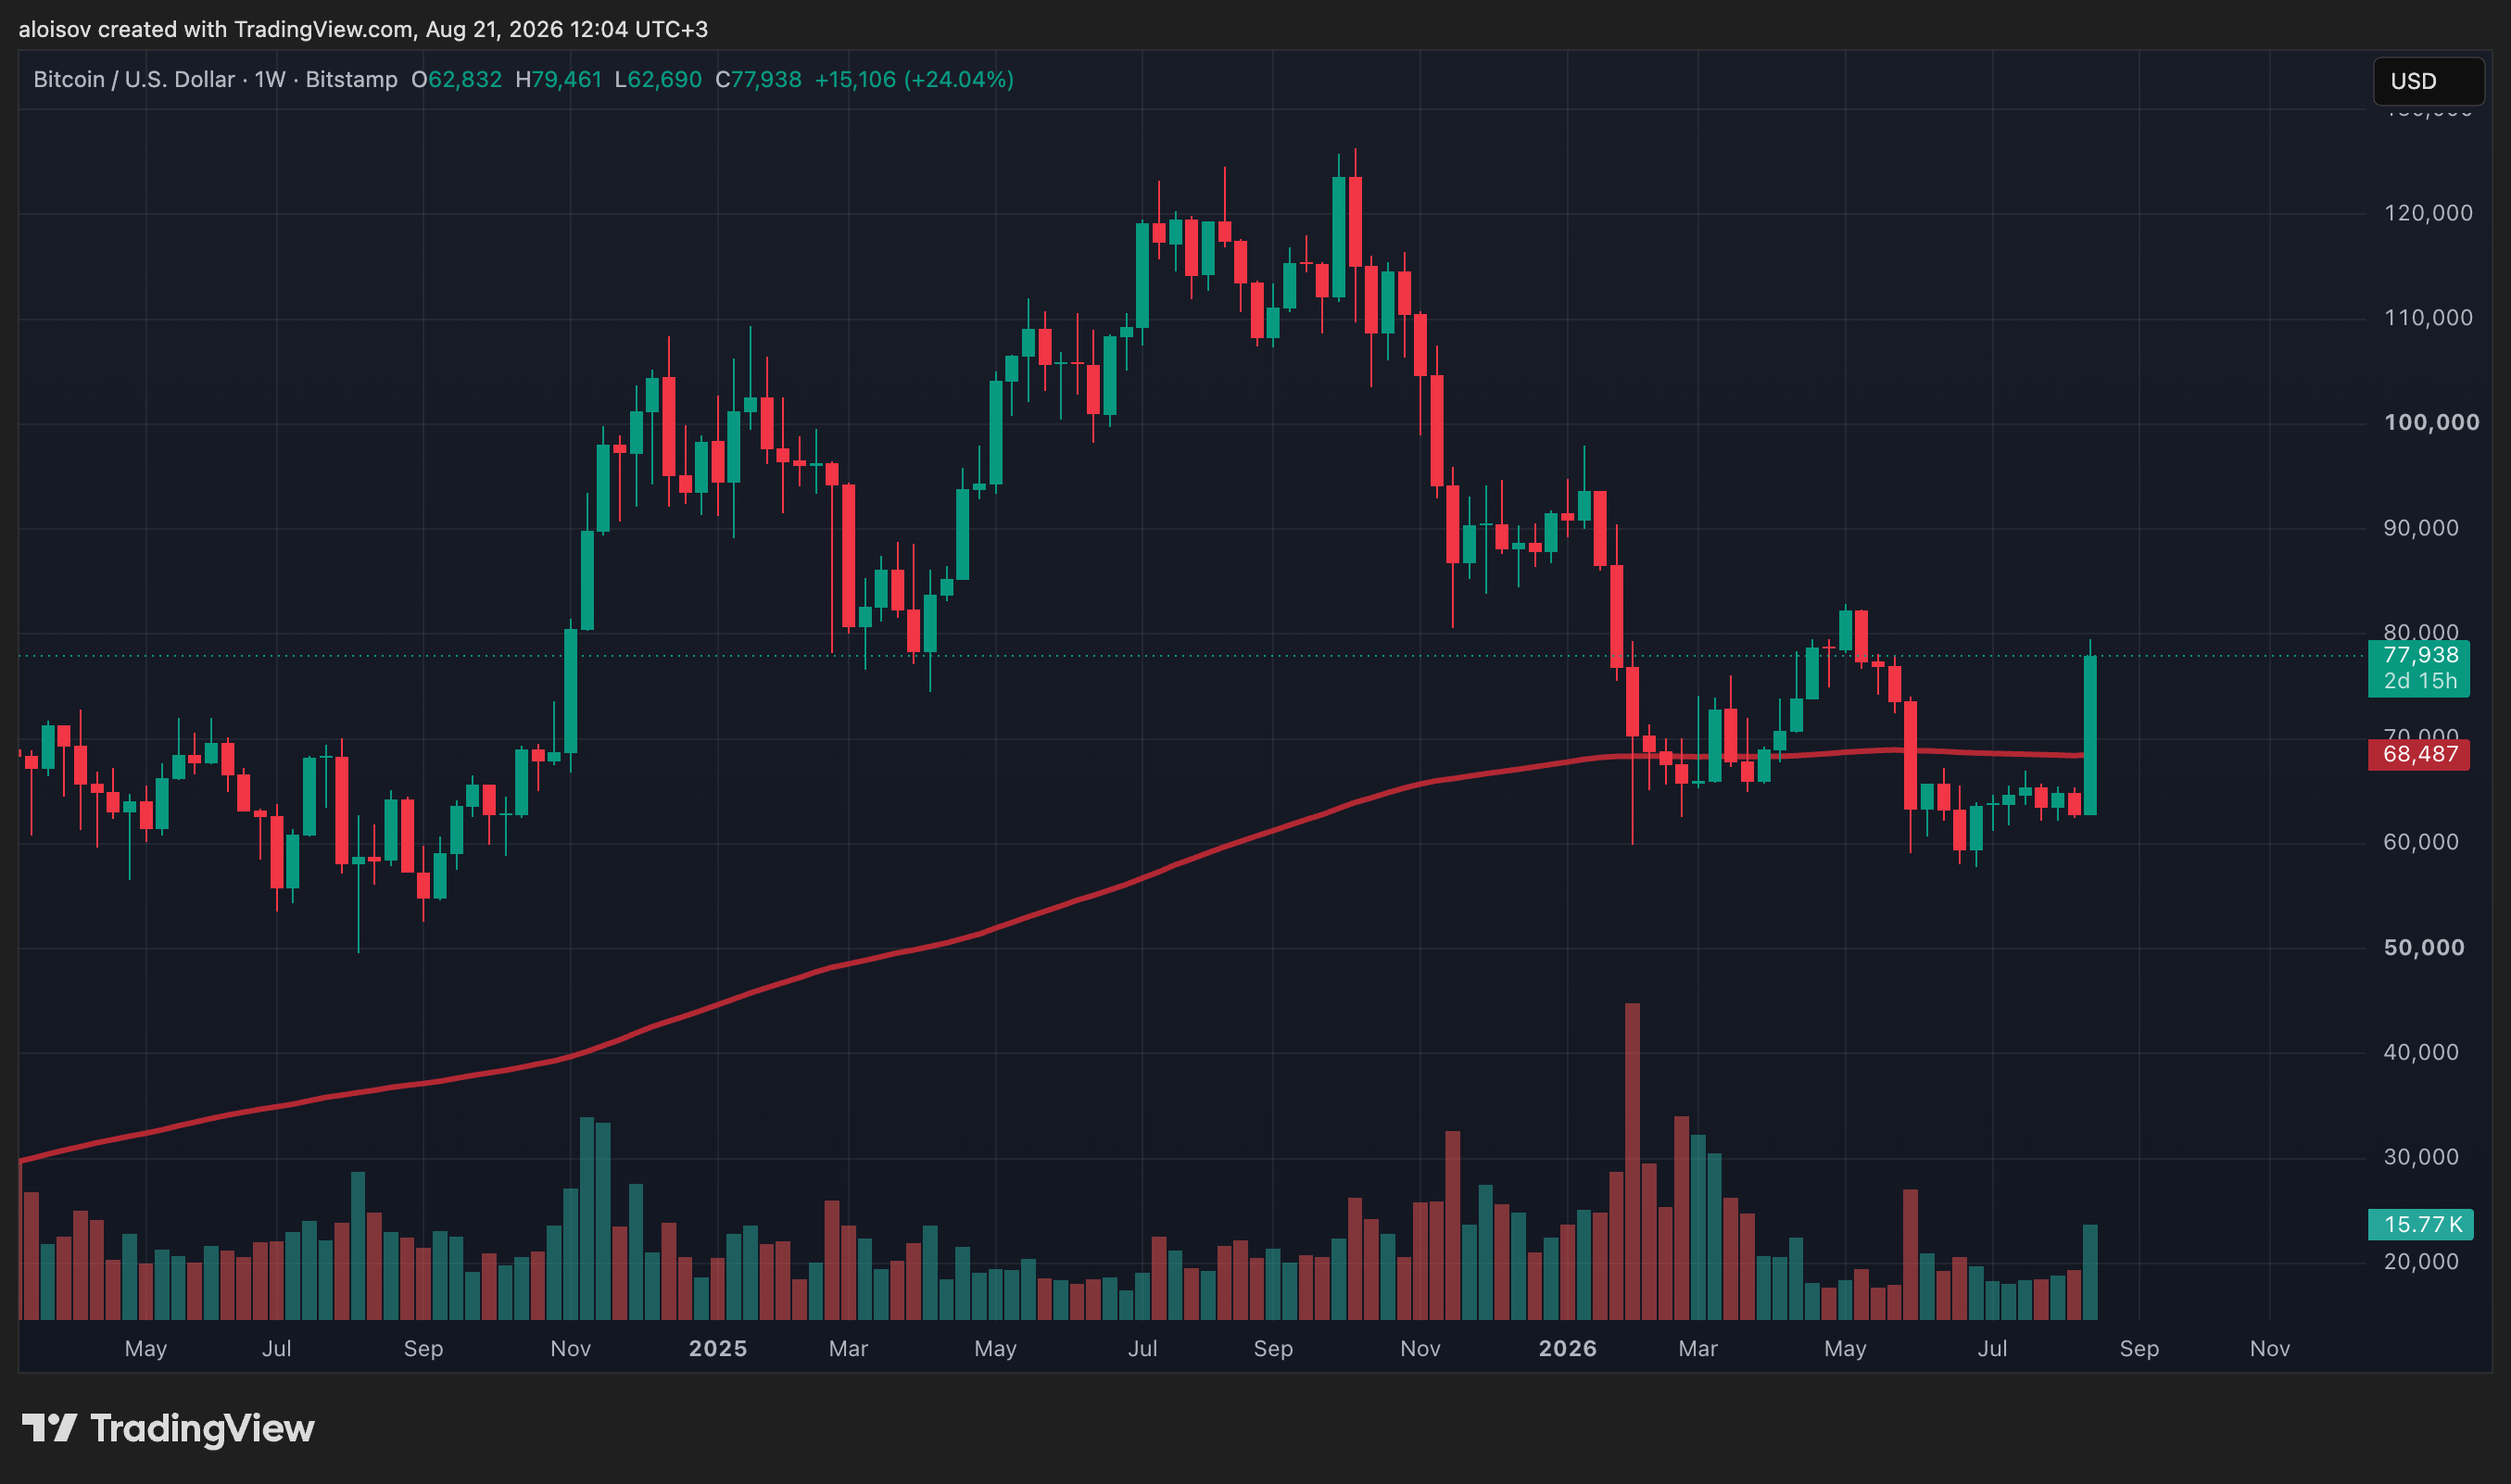
1-week chart of $BTC/USD and the 200EMA. Source: Bitstamp

Short Liquidations Amid the Rally

Crypto YouTuber Crypto Rover drew attention to the volume of forcibly closed positions: according to CoinGlass, over $1.2 billion worth of short positions were liquidated in the last 24 hours. He characterized the candles on Bitcoin's chart as extremely aggressive towards bears—the sharp upward move caught those betting on a price decline off guard.

Technical Targets and a Possible Correction

Trader and investor Crypto Candy noted that after breaking out of the consolidation zone, Bitcoin quickly reached both previously identified targets—$70,700 and $75,000—within a single day. In his assessment, a short-term pullback is possible, but if the current momentum persists, moves towards $77,000 and then $83,000 are not out of the question. He stated this scenario remains relevant as long as the price holds above the $70,000 level.
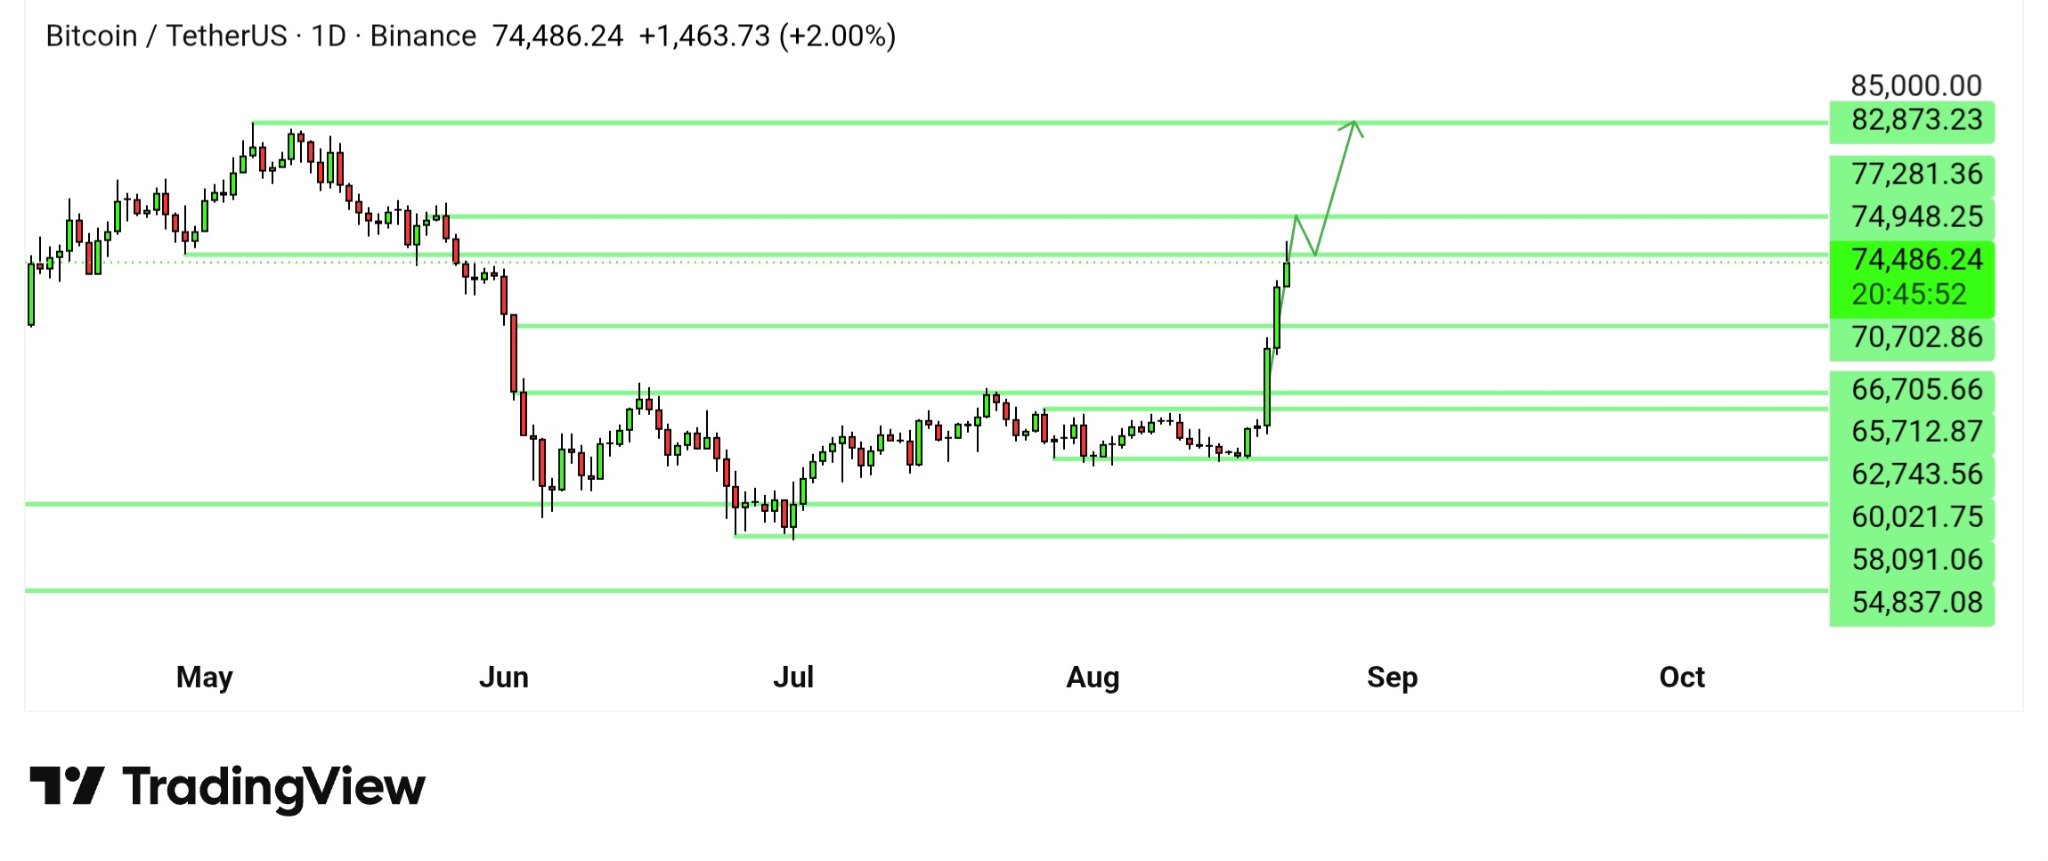
1-day chart of $BTC/USD. Analysis: Crypto Candy

Trader Roman shares a similar view. He reminded that as early as August 19, during a live broadcast, he spoke about the potential for a move to $75,000 in the coming days—a prediction that has now materialized. His assessment was based on a bullish deviation, a divergence indicator reversal, and the overall price action structure. According to him, a sustained uptrend has been observed for over ten months, and a small pullback at current levels is not ruled out.
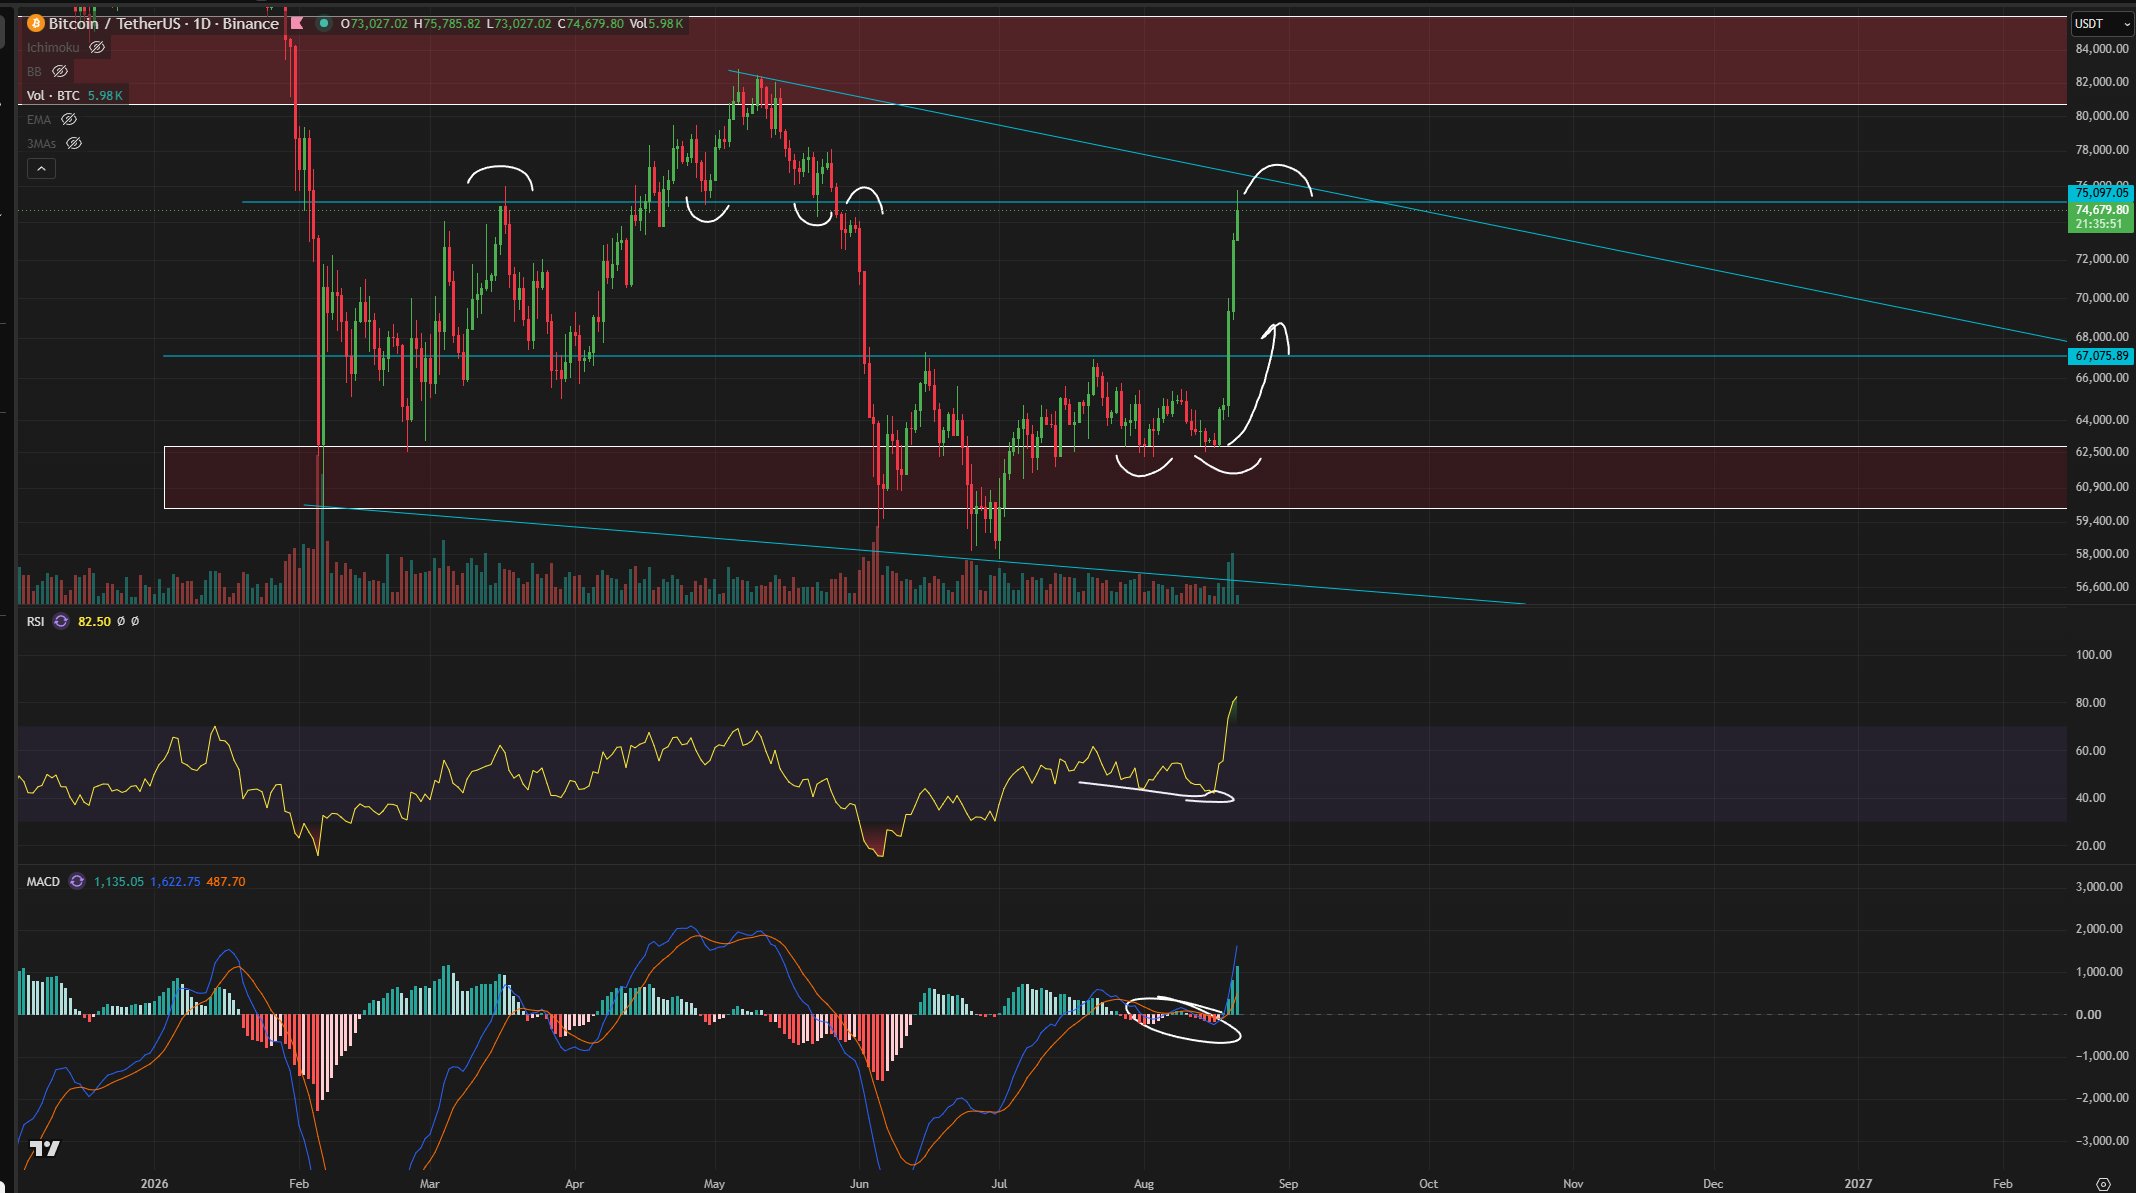
1-day chart of $BTC/USD. Analysis: Roman

Weekly Candle and Moving Averages

Trader Daan Crypto Trades noted Bitcoin's attempt to establish itself above the bull market support band and the weekly 200-period Exponential Moving Average (EMA). He emphasized the significance of the horizontal $73,000–$74,000 level: a sustained move above this zone, in his opinion, would increase confidence in a move towards the May highs. At the same time, he suggested waiting for the close of the current weekly candle at or above the reached levels—this alone would already be a positive signal.
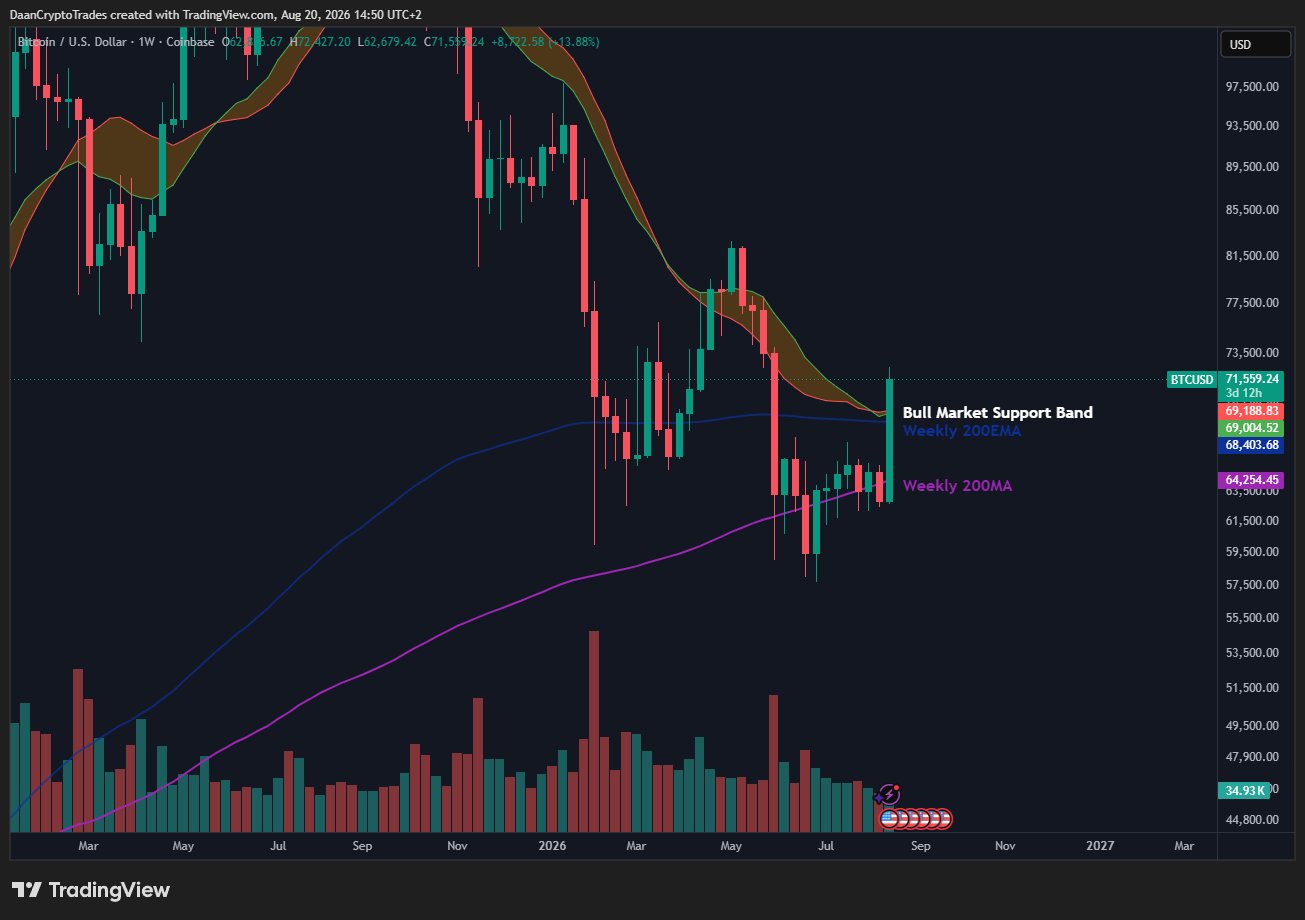
1-week chart of $BTC/USD. Analysis: Daan Crypto Trades

Key Levels

  • $70,000 — The level above which analysts believe the bullish scenario remains intact.

  • $73,000–$74,000 — The horizontal resistance level highlighted by Daan Crypto Trades.

  • $79,000 — The level reached on August 21.

  • $83,000 — The next potential target according to Crypto Candy's assessment.

Thus, several traders agree that the key reference point for further movement remains the $73,000–$74,000 zone, while further targets along the current trend lie in the $80,000–$83,000 range.

Analysts also acknowledge the possibility of a short-term correction following such a sharp move, while noting that the overall chart structure—from the weekly close above the 200 EMA to the bullish divergence—continues to point to the persistence of the uptrend.

AI Perspective

From the perspective of machine data analysis, Bitcoin's current jump to $79,000 resembles the structure of events from a year ago. The asset already broke through the $70,000 mark on a wave of a similar short squeeze on August 20, and a parallel with the summer of 2021 shows that short liquidations then also exceeded $1 billion per day, after which the price corrected by almost 20% from the local peak. Such episodes often turn out to be temporary impulses rather than definitive trend reversals.

A technical aspect that remained unaddressed in the article is the derivative nature of such rallies. Analysts at Hash Telegraph have previously noted that sharp spikes amid mass liquidations often reflect the effect of cascading position closures rather than a genuine breakout driven by spot market demand. Will the current momentum persist after the weekly candle closes, or will the market return to test the $73,000–$74,000 zone?

end-content

İlgili Sorular

QWhat was the main reason behind Bitcoin's surge above $79,000 on August 21st, according to the article?

AAccording to the article, Bitcoin's surge above $79,000 was accompanied by a large-scale liquidation of short positions. Analysts cited massive forced closures of bearish bets as a key driver behind the sharp price increase.

QWhich key price levels do analysts believe are crucial for Bitcoin's bullish scenario to remain valid?

AAnalysts believe that staying above the $70,000 level is crucial for the bullish scenario to remain valid. The horizontal resistance zone of $73,000–$74,000 is also noted as a critical area to hold for confidence in a move towards all-time highs.

QWhat potential future price targets for Bitcoin did analyst Crypto Candy mention?

AAnalyst Crypto Candy mentioned that if the current momentum is maintained, Bitcoin could move towards $77,000 and then potentially reach $83,000 as the next target.

QWhat cautionary perspective or potential risk does the article's 'AI Opinion' section raise about the current rally?

AThe 'AI Opinion' section raises caution by comparing the current surge to past events, noting that similar short squeezes have often resulted in temporary price spikes followed by significant corrections. It suggests that sharp rallies driven by mass liquidations might reflect a cascade effect in derivatives rather than genuine spot market demand, hinting at a potential pullback.

QWhat technical indicator on the weekly chart did trader Daan Crypto Trades emphasize as significant for Bitcoin's trend?

ATrader Daan Crypto Trades emphasized the significance of Bitcoin attempting to hold above the weekly 200-period Exponential Moving Average (EMA). He suggested waiting for the weekly candle to close at or above current levels for a more confident bullish signal.

İlgili Okumalar

The Bear Market Has Ended, A New Bull Cycle Has Begun

**Title: Bear Market Over, New Bull Cycle Begins** Bitcoin surged over 20% in just three days, from a low of $64,100 on August 19th to a high of $79,500 by August 21st, marking a dramatic shift in market sentiment. This rapid rise triggered massive liquidations exceeding $4 billion, with short positions accounting for $3.7 billion—the largest short squeeze since 2021. The rally was fueled by several key factors. Macroeconomic conditions improved as the US Treasury doubled its long-term bond buyback size, easing pressure. Significant regulatory developments included a White House meeting where former President Trump urged Senate action on the CLARITY Act and hinted at potential US Bitcoin reserves, followed by the CFTC Chairman stating the agency would establish crypto market rules if the bill stalls. On-chain data revealed a fierce battle: large whales faced substantial liquidations on short positions, while others took profits or doubled down on longs. Major altcoins like ETH and XRP also saw impressive gains. Analysts are divided but increasingly bullish. Many, including CryptoQuant's founder, declare the bear market over and a new bull cycle begun. Price targets range from $100k by year-end to ambitious long-term projections of $200k. However, some caution against immediate chasing, noting overbought conditions and viewing the move as a potential "trap" ahead of the crucial September 15th Senate vote on the CLARITY Act. The market's next test is sustaining the momentum with real buying pressure, holding above key resistance near $78k-$80k, and watching ETF inflows and the upcoming regulatory vote.

marsbit5 dk önce

The Bear Market Has Ended, A New Bull Cycle Has Begun

marsbit5 dk önce

Xiaomi Defended Its Smartphone Gross Margin, Yet to Find a Profit Successor

Xiaomi's Q2 2026 financial report reveals a company navigating a complex transition. While smartphone gross margin held steady at 8.5% through strategic product mix and a record-high average selling price (ASP), this came at the cost of a 26.5% year-over-year decline in global shipments, pressuring its core user acquisition engine. This illustrates Xiaomi's central challenge: managing the "timing gap" between its established and emerging growth engines. Its smartphone business is pivoting from scale to premiumization, but it's unclear if high-end models can fully offset the volume loss from more price-sensitive segments, especially in markets like India and Africa. Meanwhile, the electric vehicle segment has become a significant revenue contributor, delivering 104,200 units and generating ¥23.9 billion. However, its profit contribution remains unclear as it, along with AI investments, is still in a scaling and investment phase. The AI and humanoid robot initiatives, though strategically prioritized and tested in Xiaomi's own factories, are in early-stage validation with no near-term commercialization timeline. Financially, the company remains stable, supported by a robust cash position and its high-margin internet services business, which hit a new high in monthly active users. Management emphasized continued heavy investment in AI, chips, and robotics to fuel the next growth cycle. The key question is whether these new engines—cars, AI, robotics—can achieve commercial scale and profitability before the smartphone engine's growth slows further.

marsbit5 dk önce

Xiaomi Defended Its Smartphone Gross Margin, Yet to Find a Profit Successor

marsbit5 dk önce

Is RWA Still Meaningful Without DeFi?

The article "Would RWA Still Matter Without DeFi?" argues that tokenizing real-world assets (RWA) alone, like putting a barcode on a container, is not transformative. True value emerges when these tokenized assets are integrated into decentralized finance (DeFi) ecosystems, enabling valuation, financing, hedging, trading, and loss management in a programmable, automated manner. Tokenization provides digital representation, but DeFi provides utility through leverage, liquidity, and composability. The core challenge lies in aligning the different "time clocks" of blockchain (fast, 24/7), traditional markets (limited hours), and asset redemption (slow processes), which creates liquidation risks and gaps. Effective RWA integration requires more than a token; it needs a full stack: legally enforceable rights, reliable data oracles, clear transfer rules, executable secondary liquidity, appropriate collateral parameters, and credible loss resolution paths. Liquidity is defined not by total value locked (TVL) but by the ability to exit a position under stress within a required timeframe. Risk management for RWAs must be modeled as a dependency graph, monitoring interconnected nodes like issuers, custodians, oracles, and liquidity pools for early warning signs beyond just price data. While tokenized government bonds serve as an initial "ping test," the future lies in more complex assets like computing power and energy, which require bespoke risk models. Tokenized stocks paired with perpetual futures present a major test, combining global equity ownership with crypto-native leverage, necessitating robust architectural safeguards like isolation and dynamic collateral rules. The conclusion is that without DeFi, RWA tokenization offers limited value—improving distribution and transparency. The significant opportunity arises when tokenized assets become functional components within open, programmable capital markets, where they can be used as collateral and facilitate complex financial strategies. The token is merely the barcode; the market operating system is the real machine.

marsbit26 dk önce

Is RWA Still Meaningful Without DeFi?

marsbit26 dk önce

Government Intervention in the Bond Market: What Does It Mean?

On August 19, 2026, the U.S. Treasury unexpectedly announced it would at least double the size of its long-term Treasury buyback operations, starting September 9. The move triggered an immediate market reaction, with the 30-year yield falling 9 basis points. This intervention came against a backdrop of the 30-year yield hitting a 19-year high of 5.34% the previous day, driven by persistent inflation, high oil prices, deteriorating U.S. fiscal health with public debt surpassing $40 trillion, and a global "buyers' strike" for long-dated bonds. Treasury buybacks involve the government repurchasing older, less liquid bonds from the market via reverse auctions to improve market functioning, not to reduce overall debt. While the action provided tactical relief and signaled the Treasury's willingness to intervene, analysts caution it does not address core structural issues: massive fiscal deficits, high borrowing needs, and fading demand from traditional buyers like foreign central banks. For investors, the announcement offered short-term support for long-duration bond ETFs and boosted assets like gold, which rose 2.7%. However, it's unlikely to significantly lower mortgage rates or alter the challenging environment for long-term bonds. The key takeaway is the distinction between a tactical market operation and the unresolved structural pressures that continue to push yields higher, requiring close monitoring of upcoming economic data, Treasury auctions, and potential signals of more aggressive policy measures.

marsbit30 dk önce

Government Intervention in the Bond Market: What Does It Mean?

marsbit30 dk önce

After 'Bessent Put', How Far Is the U.S. from Restarting QE?

Following an unscheduled announcement from the U.S. Treasury Department on August 19th, investor discussions have intensified regarding the potential for future policy interventions in long-term bond markets. The Treasury increased the maximum size of its regular buyback operations for 10-to-30 year bonds from $2 billion to $4 billion, citing a desire to improve liquidity. This move came shortly after a surge in long-term yields, with the 30-year Treasury yield briefly touching 5.34%. Market analysts, rather than focusing on the modest operational size, have interpreted the timing—outside the normal quarterly communication window—as a significant signal. The move has been dubbed the "Bessent Put," implying the market's growing expectation that Treasury officials, led by Deputy Secretary Josh Bessent, may act to prevent a disorderly rise in long-term borrowing costs. This perception represents a potential shift in the market's view of the government's "policy reaction function." The underlying pressures on long-term bonds are multifaceted, including large fiscal deficits, increased Treasury supply, a rise in corporate debt issuance for AI infrastructure (creating a "crowding out" effect), and uncertainty around foreign holdings, particularly from Japan. Geopolitical risks in the Middle East further complicate the policy landscape, potentially creating conflicting pressures between fighting inflation and managing financing costs. However, the article clarifies that this Treasury buyback program is distinct from Quantitative Easing (QE). It is a debt management operation, not a Federal Reserve balance sheet expansion. While the announcement opens the door for market speculation about more forceful tools like Yield Curve Control (YCC) or a return to QE, analysts note that conditions would need to deteriorate significantly for such measures to be implemented. For now, the "Bessent Put" reflects a change in market expectations about possible policy boundaries, not an imminent launch of new monetary stimulus.

marsbit31 dk önce

After 'Bessent Put', How Far Is the U.S. from Restarting QE?

marsbit31 dk önce

İşlemler

Spot
活动图片