Gold Plunges 26%, No Queues for Gold Bars, Yet Central Banks Quietly Return to Buying

marsbit2026-08-13 tarihinde yayınlandı2026-08-13 tarihinde güncellendi

Özet

Gold Surges After 26% Drop as Central Banks Stealthily Return to Buying Following a significant 26% correction from its February 2026 peak of $5,300, gold has recently staged a sharp breakout. This rally is attributed to a key shift: major central banks, having paused purchases in Q1, have quietly resumed buying, providing fundamental support. The market backdrop is favorable. Retail speculative frenzy, evident in early-year queues at gold shops, has dissipated as attention turned to equities like semiconductor stocks. This has left sentiment cool and positioning light. Technically, the breakout is robust, with gold reclaiming its crucial 50-day and 200-day moving averages and breaking a clear downtrend line. The weekly RSI also exited near-oversold territory, a historically reliable bullish signal. Key macro drivers reinforcing the long-term bullish case include global de-dollarization trends post-Russia sanctions and concerns over U.S. debt sustainability. While a short-term pullback is possible (noted by a Bollinger Band sell signal), the article views the current setup as an asymmetric opportunity. The suggested strategy is to accumulate on dips toward the $4,341-$4,191 support zone, with a failure level below $4,170.

Author: 0xKyle

Compiled by: Deep Tide TechFlow

Deep Tide Introduction: After months of correction, gold has suddenly broken out, driven by central banks returning as buyers and speculative sentiment being cleared out. This article outlines asymmetric opportunities from both a macro-logic and technical perspective, offering valuable reference for investors focused on safe-haven assets and macro trading.

Note: This article was published to my subscribers on August 9th. Price information and other details may be outdated. Thanks to Cptlightyear and Riff for bringing it to attention—they're awesome. Also, thanks to basedpotato for the charts and some of the viewpoints below.

I spent the weekend doing some due diligence on the gold thesis. Gold bottomed out months ago and then broke out upwards. This article is simply a collection of what I've discovered about gold.

Qualitative Arguments
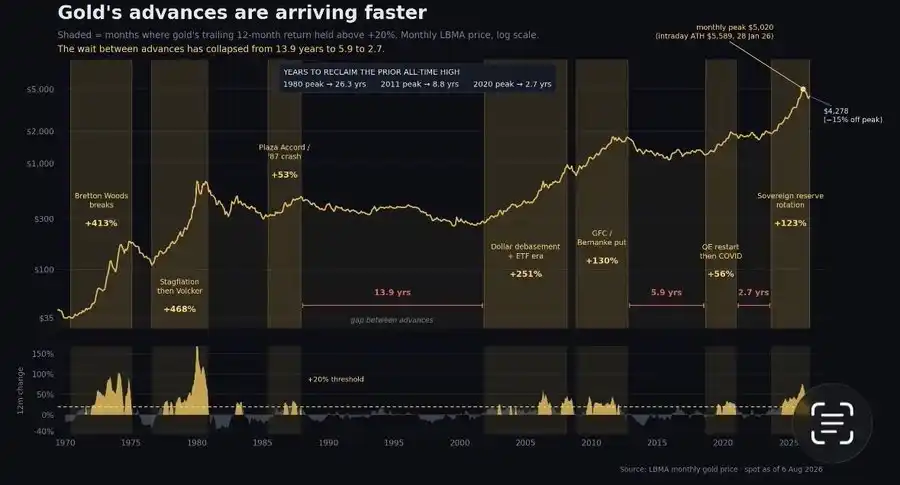
Cycles are increasingly compressed: 2000-2011: 10 years; 2011-2020: 9 years; 2020-2022: 2 years.

The initial bullish logic has only strengthened over time—after the West froze Russian reserves, countries had to diversify away from developed-market fixed-income securities (especially China). Combined with the US debt issue, no one wants to be a buyer for the country with the world's largest debt—everyone is looking for alternatives. This is a very long-term, broad macro bullish logic.

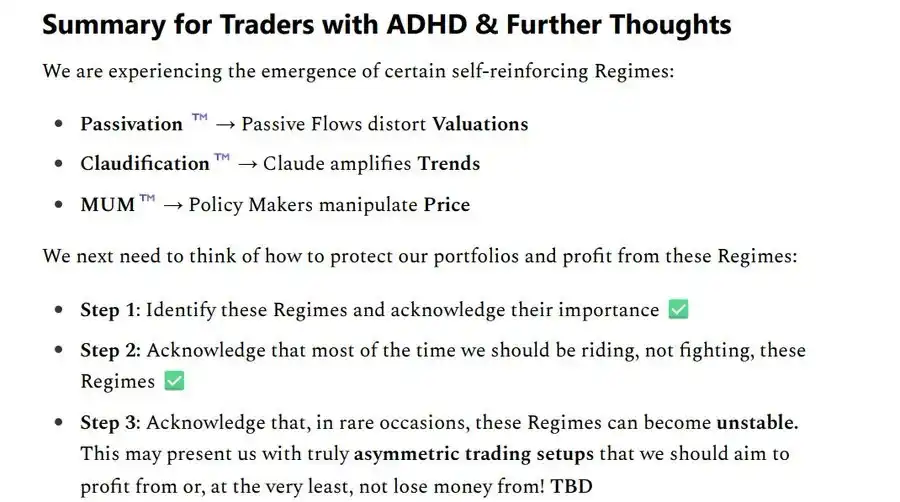
Add in the Trump corruption era—the Fed is slowly being eroded. Volatility is currently suppressed—Shrub's article aptly notes: Passive money flows plus Claude "Hey, what should I invest in?" plus policymakers manipulating prices (Bessent suppressing paper oil prices) -> Gold is the long-term safe haven.
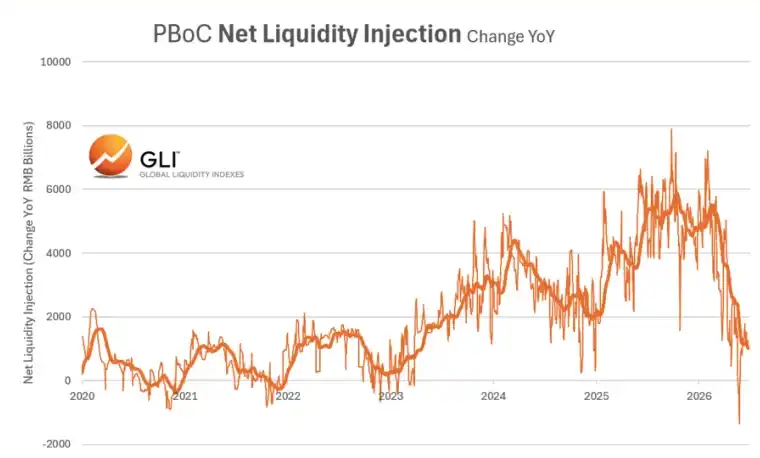
But why now? Gold peaked in February 2026 at $5300; it has since corrected by 26%, with traders looking for a bottom. Reasons for the correction are varied, but Chinese liquidity, the Iran war, and central banks halting purchases seemed to be the main culprits.

The chart below shows the year-over-year change in the Chinese central bank's net liquidity injections into the Chinese money market, measured daily and smoothed with a 50-day moving average. The key feature is a clear spike on March 2nd. Since then, liquidity acceleration stopped and then contracted.
Daily reverse repos have picked up recently, but it's not clear yet. What is clear is that central banks have started buying again after a Q1 quiet period! (This drop coincided exactly with that.)
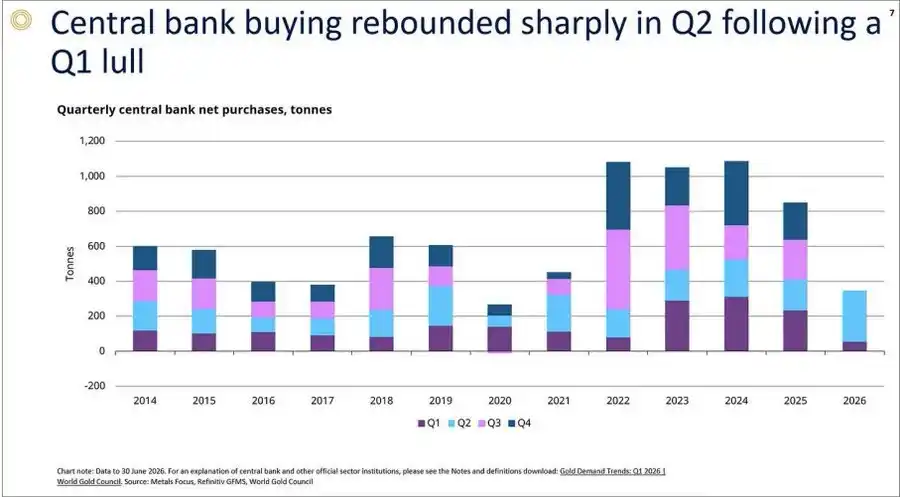
Beyond that, these countries (especially China, the big buyer) don't want speculative frenzy in the market. They want to accumulate as much as possible, at as low a price as possible. If the bull-market mania gets out of control, they step back—so that's what they did when sentiment turned extremely bullish. But over the past few months, that speculative sentiment has been crushed—which aligns with RSI readings (detailed in the technical section below).

Now, these guys are under-positioned. Everyone and their mom is buying semiconductor stocks. Remember all those photos in January of people queuing outside gold shops? As Citrini says—"When people worry about the future, they buy gold. When they worry about the present, they sell gold." People sold gold because of the war—they were worried about the present. Now, I don't know if people are worried about the future, but they certainly aren't worried about the present! The queues outside gold shops in my country are gone.

Now, gold sentiment has cooled. Today, few people care—again, everyone is buying semiconductor stocks and momentum plays. I think this is a great mix—asymmetry, timing, plus people aren't positioned yet. This is the kind of fat trade I love. Today, few people care.

On the macro front—theoretically, higher real rates and a stronger dollar should make gold fall. I'm no macro expert, but the logic is: higher real rates → gold pays no interest → investors prefer bonds; simultaneously, a stronger dollar → gold becomes more expensive for buyers in other currencies.

Despite this, gold hasn't broken below $4000. I've traded gold myself, going long multiple times—all unsuccessful. It did churn around in the $4000 price range—initially bearish. But over time, that price range became support—clearly, this was accumulation.

Seasonally: Early August is when the summer doldrums end and seasonal strength returns—hence the current breakout.

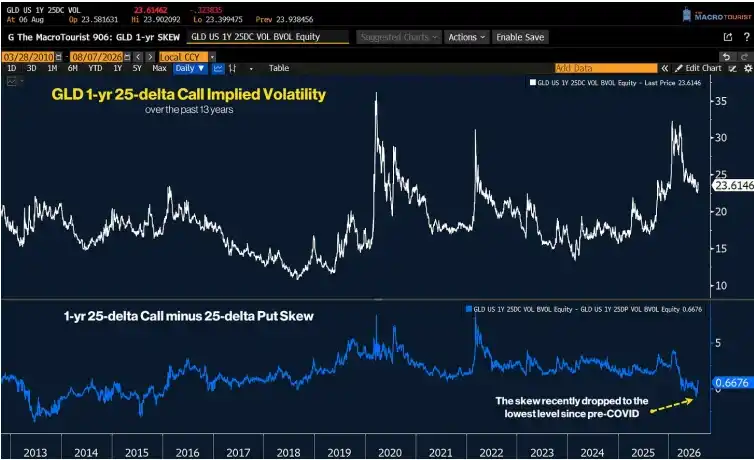
Finally, thanks to Macro Tourist: Gold's 1-year 25-delta call option skew is at its lowest level since pre-pandemic—no one is paying for right-tail risk.
Technical Arguments

Gold has triggered numerous technical signals:

In the bull market of the past few years, the 50-day moving average has been a key level that gold often stayed above. It would always test that level and then resume the uptrend.

January 26th—sharp pullback from $5500 to $4400; gold bounced off the 50-day MA. Bull market resumed. Iran war began—closed below the 50-day MA. It remained below since, with the 50-day MA acting as resistance.

Now, the price has reclaimed that line (blue line).
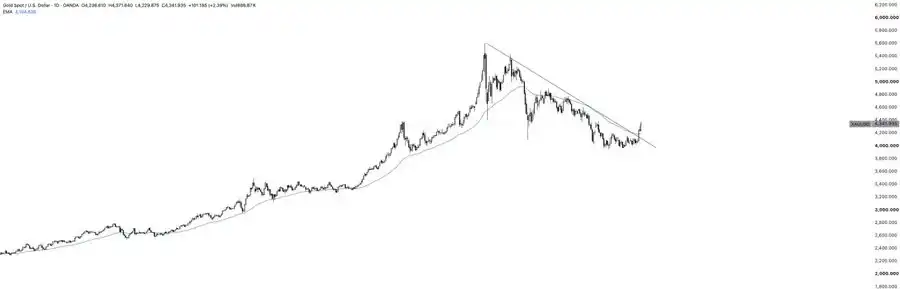
Furthermore, a simple downtrend line (black line in the chart) has been broken.
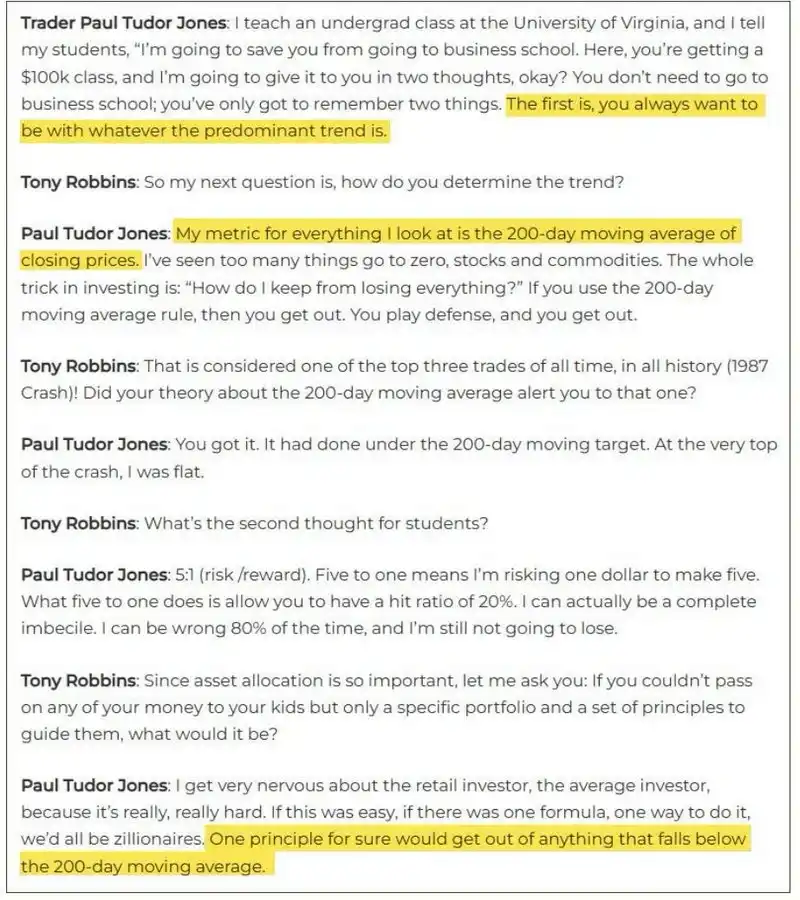
You might think technical analysis is male astrology. But PTJ said: "One sure rule is to get out of anything that breaks below the 200-day moving average." Guess what gold just did?
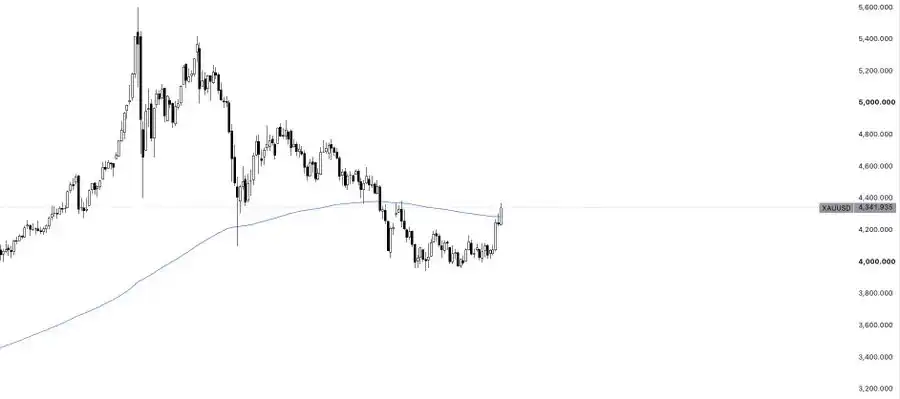
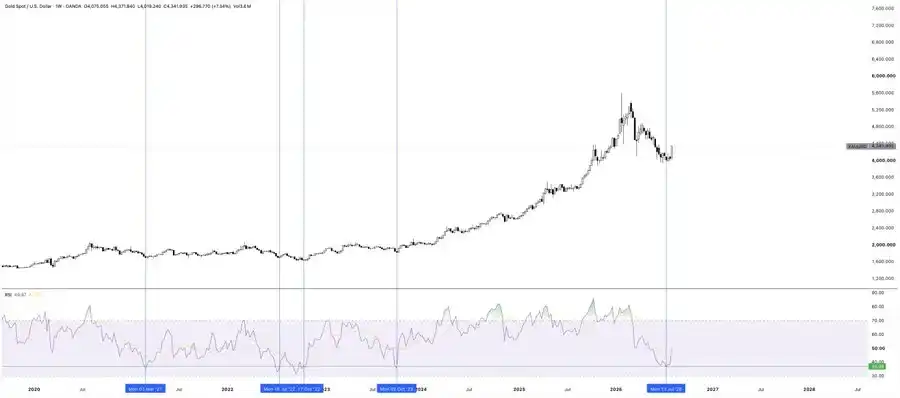
That's right, it has reclaimed the 200-day EMA. One last point is the RSI. I find RSI on higher timeframes like weekly, monthly, etc., to be strong signals. Gold's weekly RSI was near oversold for several weeks. Every time it touched that zone, it seemed to kick off a new uptrend.

Now, the price has rallied. The structure is very clean. It has broken through pretty much all the EMAs. Short-term EMAs are also crossing, which is a bullish indicator. EMA 10 crossing above EMA 21.
A note of caution. Gold triggered a sell signal on my (20/3) Bollinger Bands (20-day EMA, 3 standard deviations). This signal is almost always a sell. So, I expect a short-term pullback. I will aggressively build a position on that pullback. As I've said, gold can be traded with size because intraday volatility isn't huge (not like stocks moving 10% in a day).
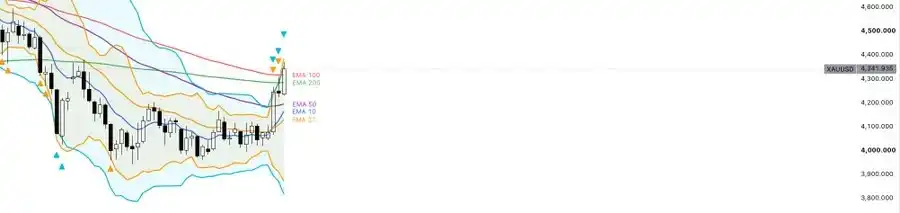
The range between $4341 and $4191 (daily EMA 50) could be a good area to set limit buy orders.

The invalidation level for the whole trade is around $4170. A close below that would essentially be the top of the range. A close below means it's back to range-bound.


İlgili Sorular

QWhat are the main qualitative arguments presented in the article for a bullish outlook on gold?

AThe article presents several qualitative arguments: 1) Central banks, particularly China's, have returned to buying gold after a quiet period in Q1, providing sustained demand. 2) A long-term macro logic where nations are diversifying away from Western debt securities (especially U.S. debt) post-Russia sanctions. 3) The speculative frenzy from retail investors has dissipated (e.g., no more lines at gold shops), clearing out 'weak hands'. 4) Seasonal patterns suggest strength beginning in August. 5) Market sentiment is indifferent, with attention focused on assets like semiconductor stocks, creating an asymmetric opportunity.

QWhat technical indicators does the article cite to support the view that gold has bottomed and is breaking out?

AThe article cites multiple technical indicators: 1) The price has reclaimed the 50-day and 200-day Exponential Moving Averages (EMAs), turning them from resistance back to support. 2) A simple downtrend line has been broken. 3) The 10-day EMA has crossed above the 21-day EMA, a bullish signal. 4) Weekly RSI had approached oversold levels and has now rebounded, a pattern that previously preceded new uptrends. 5) However, a short-term Bollinger Band (20/3) sell signal suggests a potential pullback for a better entry point.

QAccording to the article, why did gold experience a 26% correction from its peak in February 2026?

AThe article attributes the 26% correction from the February 2026 peak of $5300 to several factors: 1) A contraction in Chinese liquidity starting from a peak on March 2nd. 2) The Iran war, which caused investors to sell gold due to immediate concerns ('fear of the present'). 3) Central banks, major buyers, paused their purchases during Q1, coinciding with the price decline. The article suggests these buyers step back when speculative sentiment becomes too hot to accumulate at lower prices.

QWhat is the suggested trade setup and risk management level for buying gold based on the technical analysis?

AThe suggested trade setup is to build a large position on a pullback. The ideal buy zone is identified between $4341 and $4191, which aligns with the 50-day EMA. The key risk management level, or trade invalidation point, is set at $4170. A daily close below this level would indicate a failure of the breakout and a return to range-bound trading, suggesting one should exit the long position.

QHow does the article contrast the current market sentiment towards gold with the sentiment earlier in the year (e.g., January)?

AThe article contrasts the sentiment sharply. In January, there was public speculative frenzy with photos of people lining up at gold shops, indicating widespread 'fear of the future' and bullish excitement. Currently, that sentiment has completely reversed. The lines are gone, and few people care about gold as attention has shifted to assets like semiconductor and momentum stocks. This shift from extreme concern to indifference, while underlying fundamentals like central bank buying improve, is presented as a key component of the asymmetric opportunity.

İlgili Okumalar

Securitize's First Post-IPO Financial Report Bombshell: Is the 'Compliant Tokenization' Narrative Failing to Sell?

Securitize, a tokenization platform, released its first earnings report since going public in July 2026, revealing disappointing Q2 results. Revenue fell 5% year-over-year to $14.43 million, missing estimates, while the net loss widened significantly to $21.68 million. Despite achieving record tokenized assets under management of $4.3 billion and a 147% surge in platform trading volume, overall assets under administration declined by 20%. The company's stock (SECZ) dropped over 20% in after-hours trading following the report. The article highlights a key concern: Securitize's revenue declined despite substantial trading growth, suggesting either compressed fees or an unclear business model. While Securitize maintains its focus on regulatory compliance—securing key partnerships with entities like Computershare and NYSE, and obtaining an SEC investment advisor registration—its tangible progress in the new tokenized stock business has been slow. Apart from tokenizing its own stock (SECZ) upon listing, it has not launched other tokenized equities. Analysts note that SECZ's high on-chain market capitalization is misleading, as it resulted from a one-time distribution to shareholders rather than organic investor demand. The market's patience is waning as investors prioritize real business metrics like market share and user adoption over the "compliant tokenization" narrative. Securitize's market value has fallen 36% from its debut, reflecting growing concerns over its shrinking revenue and the delayed execution of its tokenized stock initiatives.

Odaily星球日报4 dk önce

Securitize's First Post-IPO Financial Report Bombshell: Is the 'Compliant Tokenization' Narrative Failing to Sell?

Odaily星球日报4 dk önce

Why Every Investor Needs to Pay Attention to the Federal Reserve

Why Every Investor Should Follow the Federal Reserve Key developments on August 12, 2026, demonstrate how crucial the Fed is. Following the CPI report that matched expectations, markets instantly repriced stocks, bonds, and currencies, adjusting the probability of a September Fed rate hike. The Federal Reserve controls the federal funds rate, the anchor for all borrowing costs. Its "dual mandate" is to maintain stable prices and maximum employment. The current policy rate is 3.50%-3.75% after a series of cuts from 2024-2025. Understanding Fed actions is vital for your portfolio: - **Rate Hikes:** Slow the economy to fight inflation. They pressure growth/tech stocks (due to higher discount rates) and lower bond prices but can initially benefit banks. - **Rate Cuts:** Stimulate the economy. They typically boost growth stocks and bond prices while lowering borrowing costs for consumers and businesses. - **Holding Steady:** Still impactful. Current restrictive policy, with positive real interest rates, continues to weigh on the economy. Market-moving signals now come more from economic data than official guidance. A key change is new Fed Chair Kevin Warsh, who has reduced forward guidance, making each data release (CPI, PCE, jobs reports, GDP) more critical for predicting Fed moves. In this environment, investors should track key reports, compare data to market expectations, and understand what is already "priced in." The focus now is on the September 15-16 FOMC meeting. The August CPI (due Sep 11) and jobs report (Sep 5) will be decisive. Ultimately, interest rates are a powerful, continuous force on all assets. Learning to interpret the data that drives Fed policy is an essential skill for navigating today's markets.

marsbit8 dk önce

Why Every Investor Needs to Pay Attention to the Federal Reserve

marsbit8 dk önce

MicroStrategy Sells BTC Without a Price Drop, Is STRC's Rebound Truly Good News?

The cryptocurrency market is currently experiencing extreme quiet, with BTC weekly trading volume at its lowest since 2023 and implied volatility hitting bottom. Liquidity is thin, as evidenced by a muted price reaction to CPI data. The market's primary issue is a lack of active participants, not just news. Options data shows traders are pricing in higher short-term downside risks. Market makers' gamma positioning suggests a critical support zone between $61,000 and $60,000; a break below could accelerate a downturn. Two developments are being interpreted bullishly: MicroStrategy (MSTR) selling a small portion of its BTC without causing a price crash, and the rebound of its preferred shares (STRC) from lows near $73 to over $95. However, an alternative bearish interpretation exists. The low liquidity means large entities cannot exit sizable positions easily. A STRK recovery towards $100 could provide the buying pressure these sellers need to finally offload BTC, making the apparent利好 (positive news) actually improve selling conditions. STRC faces a structural ceiling at $100 because MSTR has signaled it will issue new shares around that price, capping upside and inviting short sellers. While recent buybacks boosted the price, they haven't solved this core problem. If STRK cannot sustainably break $100, concerns will grow about MSTR needing to sell BTC for funding. Finally, the Bitfinex Long positions indicator, which typically moves inversely to BTC price, has become ineffective and flat-lined near multi-year lows, offering no directional signal. Large traders are not accumulating on dips as they once did.

marsbit9 dk önce

MicroStrategy Sells BTC Without a Price Drop, Is STRC's Rebound Truly Good News?

marsbit9 dk önce

Silicon Valley Tech Giants No Longer Need Ethicists

Silicon Valley tech giants are once again sidelining ethicists. Chloé Bakalar, OpenAI's dedicated AI Ethics Lead, left the company in July, a departure emblematic of a broader trend where ethics teams are being disbanded or marginalized in the race for AI dominance. Bakalar's career highlights the tensions between ethical governance and commercial speed. She first made her mark at Meta (formerly Facebook), where she pioneered "embedded ethics," developing tools like checklists to translate abstract principles like fairness and transparency into concrete engineering steps. Her framework aimed to embed ethical considerations throughout a product’s lifecycle—from initial design and data handling to user interaction and deployment. However, this approach faced significant internal resistance. At Meta, her Responsible AI team was eventually disbanded as the company prioritized rapid development, especially in the generative AI race with OpenAI. Bakalar then joined OpenAI in 2025, hoping to influence cutting-edge model development directly. Yet, as the company's sole dedicated ethicist, she reportedly struggled with limited influence and resources amidst intense commercial pressures, leading to her departure after roughly a year. Her exit is not isolated. Similar patterns have emerged across Silicon Valley, with ethics and safety teams at Twitter (post-Musk acquisition) and OpenAI's own "superalignment" team being dissolved. These departures reveal five core, unresolved tensions: 1) the fatal conflict between commercialization speed and ethical caution; 2) the role mismatch where ethicists have prestige but little real decision-making power; 3) the dilution of responsibility when ethics is decentralized as "everyone's job"; 4) the inevitable "translation loss" when complex philosophical values are reduced to quantifiable engineering metrics; and 5) the fundamental clash between academic independence and corporate secrecy. Bakalar’s trajectory suggests that embedding meaningful ethical oversight within hyper-competitive tech companies is profoundly difficult. Lasting change may require external regulatory pressure, like the EU's AI Act, or a fundamental reimagining of the ethicist's role from an internal auditor to a cross-disciplinary builder with genuine authority.

marsbit38 dk önce

Silicon Valley Tech Giants No Longer Need Ethicists

marsbit38 dk önce

İşlemler

Spot
活动图片