Odaily Guest Market Analyst Cody Feng, Master of Financial Statistics from Columbia University, USA, focused on quantitative trading in US stocks during university and gradually expanded into digital assets like Bitcoin. He has built a systematic quantitative trading model and risk control system through practical experience; possesses a sharp data-driven insight into market fluctuations and is committed to continuous growth in the professional trading field, pursuing steady returns; will delve into BTC technicals, macro trends, capital flows, and other changes weekly, review and showcase practical strategies, and preview noteworthy upcoming events for reference.

Trading Weekly Report Core Summary:
• Strategy Execution (Short-term) Effectiveness Verified: Last week's trading strictly followed the established strategy, successfully completing one short-term operation (1x leverage), cumulatively achieving a 3.4% return.
• Core View (Short-term) Verified: The core view proposed last week that "Bitcoin may maintain a range-bound oscillation between $84,000~$94,500" has been precisely validated by the market. Over the past week, the price reached a high of $94,789 and a low of $89,311, highly consistent with the given resistance level of $94,500 and support level of $89,500. This result strongly confirms our judgment of key levels.
The following will detail the market forecast, strategy execution, and specific trading process.
I. Trading Market Review: (01.05~01.11)
1. Last Week's Short-term Operation Review:
Strictly following the trading signals from our self-built "Spread Trading" and "Momentum Quant" models (see red and green block signals in Figure 1), and combined with accurate market trend predictions, we successfully completed one short-term operation, cumulatively achieving a 3.4% return. Specific trade details and review are as follows:
1. Trade Details Summary: (No leverage)

2. Short-term Trade Review:
• Trade (Profit 3.4%): This operation perfectly executed the "Shorting at Resistance Level" strategy: Step one, when the price rose to impact the key resistance level of 94,500 USD, resonating with the top signal (green dot) of the Spread Trading model, we decisively entered the market to establish a 30% short position; Step two, after the price fell back to the target support zone and triggered the model's bottom signal (red dot), we closed the position to lock in profits.
2. Last Week's Trend Forecast and Operation Strategy Review:
1. Clearly stated last week: Focus on observing the gains and losses in the 84,000~94,500 USD area. Before effectively breaking through the upper or lower bounds of this area, the price will maintain a range-bound oscillation pattern.
2. Core Level Review: First resistance watched the 93,000~94,500 USD area, first support watched the 89,500~91,000 USD area.
2. Operation Strategy Review:
• Midline Strategy: If the market maintains oscillation within the 84,000~94,500 USD range, continue holding the midline position (short) of about 65%.
• Short-term Strategy: If the price maintains oscillation within the 84,000~94,500 USD range, execute operations according to Plan A:
• Open Position: When the price rebounds to the 93,000~94,500 USD area and shows signs of resistance, a 30% short position can be established.
• Risk Control: Set the short stop-loss above 95,500 USD.
• Reduce Position: When the price falls to the 86,000~86,500 USD area and shows signs of stabilization, gradually close part of the short position.
• Close Position: When the price probes near 84,000 USD and shows signs of stabilization, close all positions to take profits.
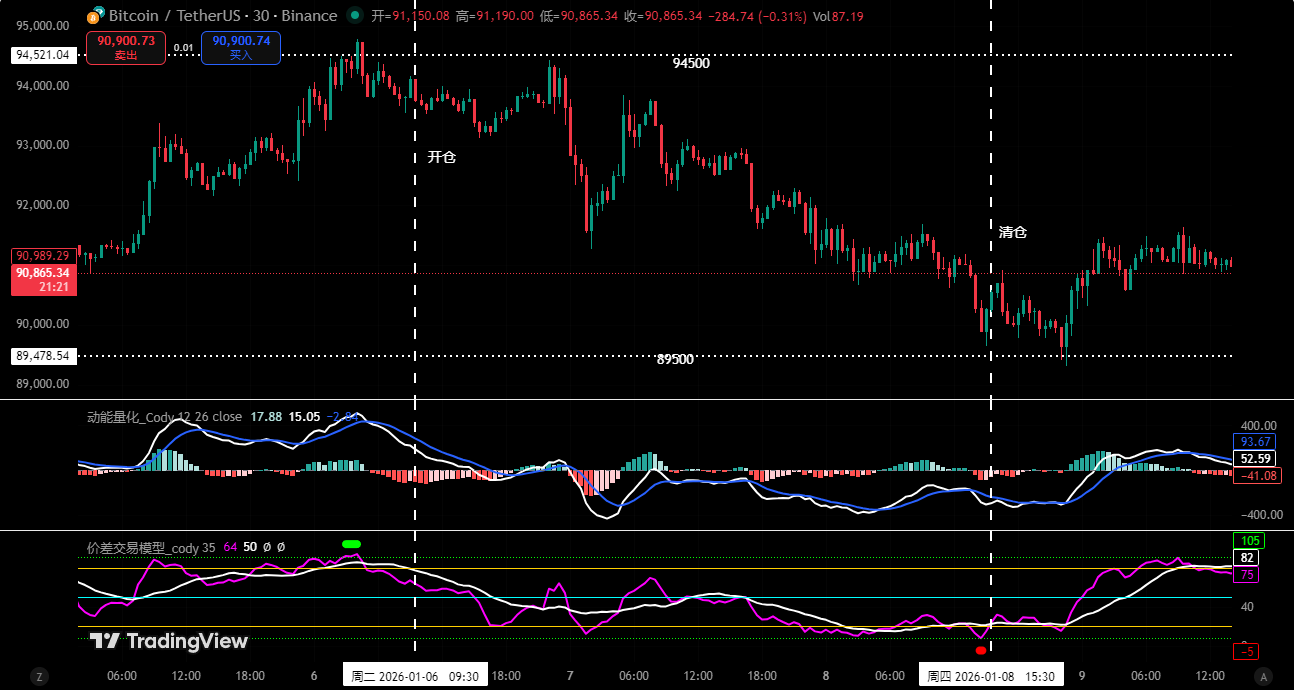
Figure 1
II. Trend Model Judgment: Bitcoin's Future Trend and How to Enter
Combining market movements, the author provides an in-depth analysis of Bitcoin's price structure from multiple models and dimensions based on a self-built trading system.
1. As shown in (Figure 2), analysis from the weekly chart:
• Momentum Quant Model: Technical indicators show the momentum line converging below the zero axis, while the negative energy bars continue to shrink, indicating a slowdown in the rate of decline. However, the current signals do not confirm that the trend has reversed.
Momentum Quant Model indicates: Probability of price decline: High
• Sentiment Quant Model: Blue sentiment line value 52.61, strength zero; Yellow sentiment line value 20.76, strength zero, peak value is 0.
Sentiment Quant Model indicates: Price pressure and support index: Neutral
• Digital Monitoring Model: The price has been below the bull-bear (yellow-blue line) dividing line for 8 weeks. Last week, bulls again冲击ed this line but fell back after encountering resistance from bears. This failed attempt means bears still control the market dominance.
Digital Monitoring Model indicates: Monitoring (top/bottom) digital signals have not appeared; Weekly K-line closed as a doji with an upper shadow, down about 0.57%.
The above data indicates: Bitcoin's weekly chart has entered a bearish trend, be wary of oscillation and adjustment risks.
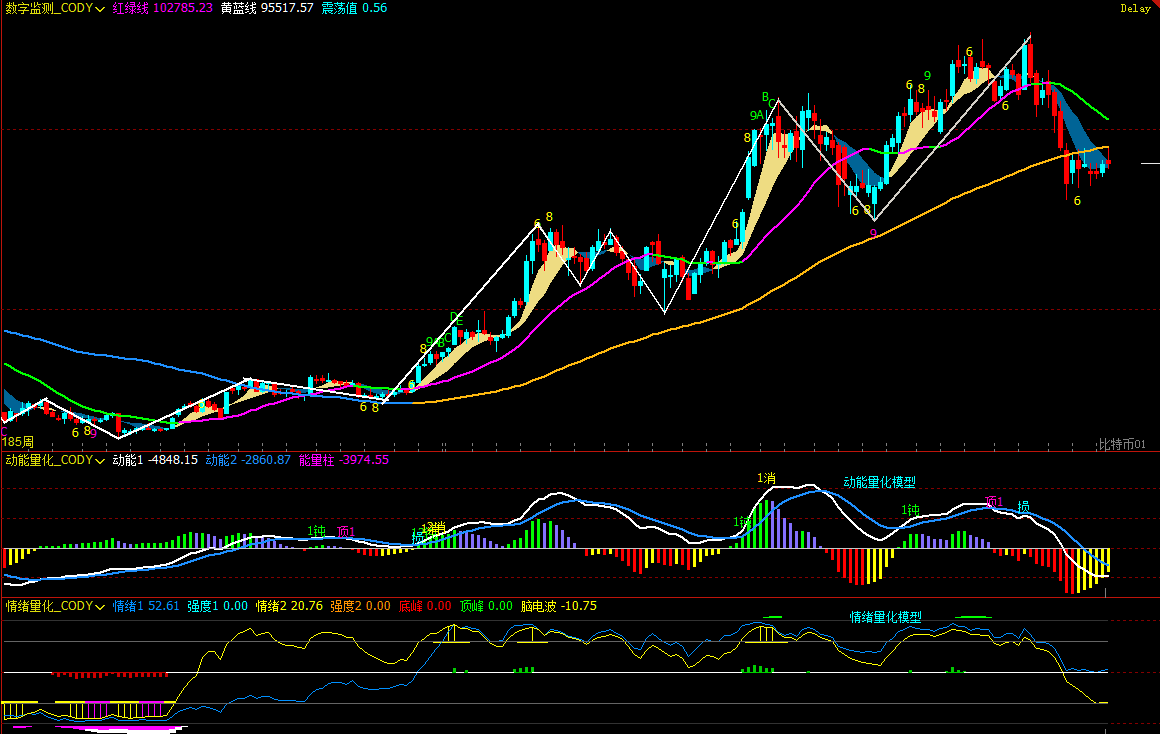
Figure 2
2. As shown in (Figure 3), analysis from the daily chart:
• Momentum Quant Model: Last week overall showed a "rise first then fall" pattern. In the first half of the week, the momentum line crossed above the zero axis, and positive energy bars continued to expand; but in the latter half, the momentum line tended to converge again, and energy bars明显 shrank, indicating weakened buying momentum.
Momentum Quant Model indicates: The daily level is in a bull-bear contest phase, watch the zero axis gain/loss.
• Sentiment Quant Model: After last week's daily close, blue sentiment line value 28, strength zero; yellow sentiment line value 62, strength zero.
Sentiment Quant Model indicates: Pressure and support index: Neutral
The above data suggests: The daily level is at a bull-bear watershed, the trend direction awaits further confirmation.
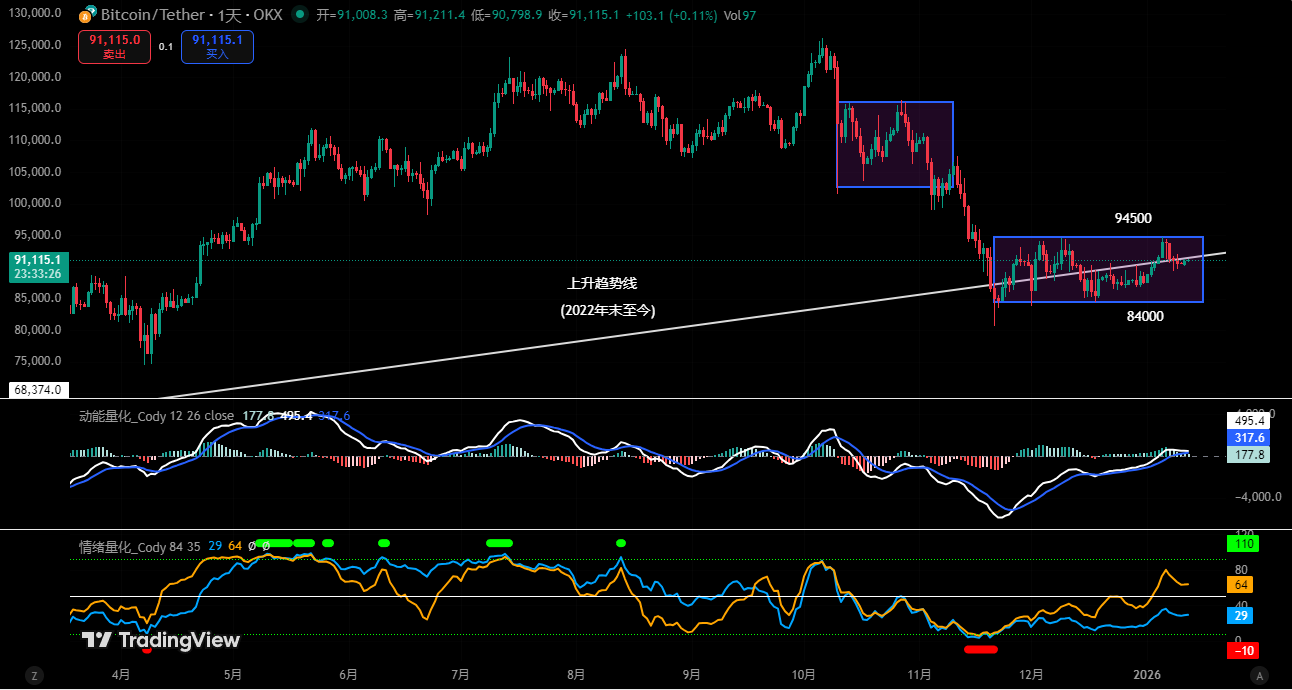
Figure 3
III. This Week's Market Prediction: (01.12~01.18)
1. This Week's Core View:
• Bitcoin is expected to continue oscillating repeatedly within the 84,000~94,500 USD range, but focus on observing the bull-bear battle at both ends of the range.
• Breakdown: Once it effectively breaks below 84,000 USD, the trend will turn downward, with the first test target at 80,000 USD.
• Breakout: If it can firmly stand above 94,500 USD, it is expected to start a relatively strong technical rebound.
2. Core Resistance Levels:
• First Resistance Area: 92,000~93,000 USD area
• Second Resistance Area: 94,500~95,000 USD area
• Important Resistance Level: Near 97,500~99,500 USD.
3. Core Support Levels:
• First Support Level: 89,500~91,000 USD area
• Second Support Level: 86,000~86,500 USD area
• Third Support Level: 83,500~84,500 USD area
• Important Support Level: Near 80,000 USD.
IV. This Week's Operation Strategy (Excluding Sudden News Impact): (01.12~01.18)
1. Midline Strategy:
• Before the price effectively breaks through 94,500 USD, continue maintaining the midline position (short) of about 65%.
• If the price successfully breaks through and stabilizes above 94,500 USD, close all midline positions (short), hold funds and observe.
2. Short-term Strategy: Use 30% of the position, set stop-loss points, and look for "spread" opportunities based on support and resistance levels. (Use 30 minutes as the operation cycle).
3. To dynamically respond to market evolution and combine real-time model signals, we have prepared three short-term operation plans A/B/C:
• Plan A: If the price maintains oscillation within 84,000~94,500 USD:
• Open Position: Based on core resistance level judgment (see this week's market prediction), when rebounding to the 93,000~94,500 USD area and combined with the hourly chart model top signal, a 30% short position can be established.
• Risk Control: Initial short stop-loss set about 1.5% above the entry price (i.e., 1.015 * entry price).
• Close Position: When probing near core support levels and combined with model signals, gradually close the position to take profits.
• Plan B: If the price effectively breaks below the 84,000 USD support:
• Open Position: If it effectively breaks down through core support levels, chase the drop to establish a 30% short position.
• Risk Control: Initial short stop-loss set about 1.5% above the entry price (i.e., 1.015 * entry price).
• Close Position: When probing near 80,000 USD and combined with model signals, gradually close the position to take profits.
• Plan C: If it successfully breaks through and stabilizes above the 94,500 USD resistance:
• Open Position: If it successfully breaks through the core resistance level and combined with model signals, a 30% long position can be established.
• Risk Control: Initial long stop-loss set about 1.5% below the entry price (i.e., 0.985 * entry price).
• Close Position: When rebounding to near 97,500 USD and combined with model signals, gradually close the position to take profits.
V. Macro & Liquidity Weekly Observation:(01.12~01.18)
I. Dense Schedule of FOMC Official Speeches: A Key Window for Policy Expectation Recalibration
This week, the Federal Reserve system will usher in a rare window of密集 official speeches. Multiple Fed Presidents and Governors with voting rights in different years will集中 express their views on economic prospects, inflation trends, and policy stance, providing key information for the market to judge the future monetary policy path.
Looking at the speaker lineup, it includes both permanent FOMC voters and rotating voters for 2026-2028, covering information dimensions from short-term policy orientation to medium-term decision-making frameworks, which is of great guiding significance for the interest rate expectation structure.
Main events include:
Tuesday: 2027 FOMC voter, Atlanta Fed President Bostic speaks;
2027 FOMC voter, Richmond Fed President Barkin speaks;
Permanent FOMC voter, New York Fed President Williams speaks;
2028 FOMC voter, St. Louis Fed President Musalem speaks;
Wednesday: Richmond Fed President Barkin speaks again;
2026 FOMC voter, Philadelphia Fed President Harker speaks on economic outlook;
Fed Governor Waller speaks in a public setting;
Thursday: 2026 FOMC voter, Minneapolis Fed President Kashkari speaks,同时 2027 FOMC voter, Atlanta Fed President Bostic speaks again;
Fed releases Beige Book;
Permanent FOMC voter, New York Fed President Williams gives opening remarks at an event;
Bostic speaks again on economic and policy issues;
Friday: Richmond Fed President Barkin speaks on regional economic prospects.
II. Market Focus: Whether to Release Policy Pivot Signals Early
Against the backdrop of marginal decline in inflation and signs of cooling in the job market, the market's core focus is whether officials will continue to emphasize the necessity of "maintaining restrictive policy for a longer time," or begin to provide clearer forward guidance for the next phase of policy shift.
It should be noted that officials' speeches affect the expectation structure more than the short-term direction, and their effect is usually reflected in the medium-term adjustment of the interest rate curve, the US dollar index, and the valuation system of risk assets.
III. Potential Impact on Risk Assets and Crypto Markets
If multiple officials maintain a cautious stance, emphasizing that the inflation path remains uncertain, it may suppress risk appetite in the short term;
But if the speeches gradually acknowledge the economic slowdown trend and weaken the necessity for further policy tightening, it will help the medium-term easing expectation to be repriced.
For crypto assets like Bitcoin, the core impact of Fed officials' speeches lies in liquidity expectations and discount rate changes. The effect is medium-term and more suitable as a macro pricing reference than a short-term trading signal.
VI. Special Notes:
1. When opening a position: Immediately set the initial stop-loss level.
2. When profit reaches 1%: Move the stop-loss to the entry price (breakeven point) to ensure capital safety.
3. When profit reaches 2%: Move the stop-loss to the 1% profit level.
4. Continuous tracking: Thereafter, for every additional 1% profit the price makes, move the stop-loss up 1% accordingly, dynamically protecting and locking in existing profits.
(Note: The above 1% profit trigger threshold can be flexibly adjusted by investors according to their own risk preference and the volatility of the asset.)
Financial markets change rapidly, all market analysis and trading strategies need dynamic adjustment. All views, analytical models, and operation strategies involved in this article are derived from personal technical analysis, for personal trading log purposes only, and do not constitute any investment advice or operational basis. The market carries risks, investment requires caution, DYOR.