86% Return? How to Use a Bot to 'Earn Passively' on Polymarket

marsbit2025-12-30 tarihinde yayınlandı2025-12-30 tarihinde güncellendi

Özet

This article details the development and backtesting of an automated trading bot for the "BTC 15-minute UP/DOWN" market on Polymarket. The author identified market inefficiencies and automated a manual strategy to exploit them. The bot operates in two modes. In manual mode, users can directly place orders. In auto mode, it runs a two-leg cycle: First, it observes the market for a set time after a round begins. If either the "UP" or "DOWN" side drops by a specified percentage (e.g., 15%) within seconds, it triggers "Leg 1" and buys the crashed side. It then waits for "Leg 2," a hedging trade on the opposite side, which is only executed if the sum of the Leg 1 entry price and the opposite ask price meets a target threshold (e.g., ≤ 0.95). Due to a lack of historical market data from Polymarket's API, the author created a custom backtesting system by recording 6 GB of live price snapshots over four days. A conservative backtest with parameters of a 15% crash threshold and a 0.95 sum target showed an 86% ROI, turning $1,000 into $1,869. An aggressive parameter set resulted in a -50% loss, highlighting the critical role of parameter selection. The author acknowledges significant limitations of the backtesting, including its short data period, failure to model order book depth, partial fills, variable network latency, and the market impact of the bot's own orders. Future improvements include rewriting the bot in Rust for performance, running a dedicated node, and deploying on a ...

A few weeks ago, I decided to build my own Polymarket bot. The full version took me a few weeks to complete.

I was willing to invest this effort because there are indeed inefficiencies on Polymarket. Although there are already some bots exploiting these inefficiencies for profit, it's far from enough. The opportunities in this market still far outnumber the bots.

Bot Construction Logic

The bot's logic is based on a strategy I previously executed manually. To improve efficiency, I automated it. This bot runs on the "BTC 15-minute UP/DOWN" market.

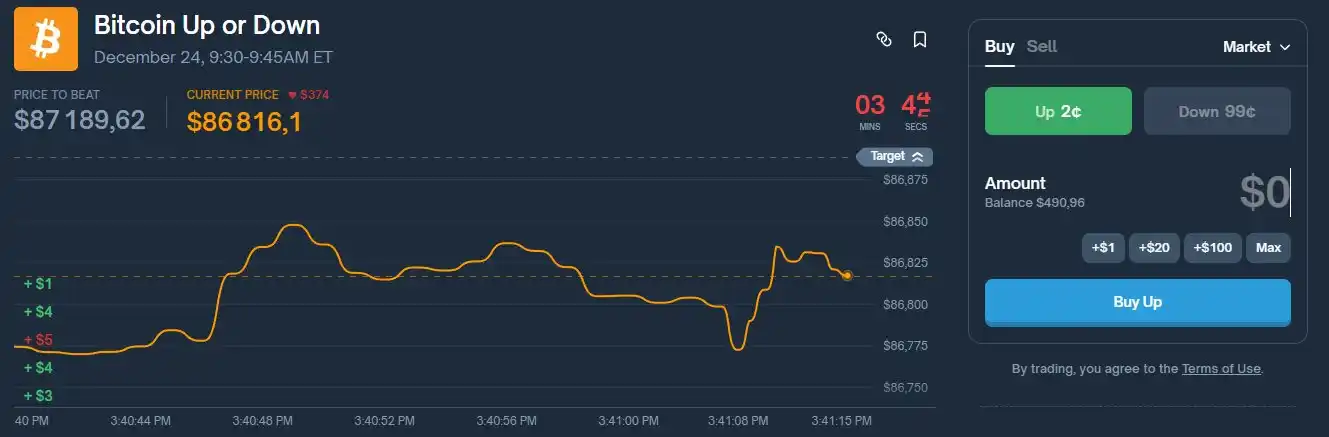
The bot runs a real-time monitoring program that can automatically switch to the current BTC 15-minute round, stream the best bid/ask via WebSocket, display a fixed terminal UI, and allow full control via text commands.

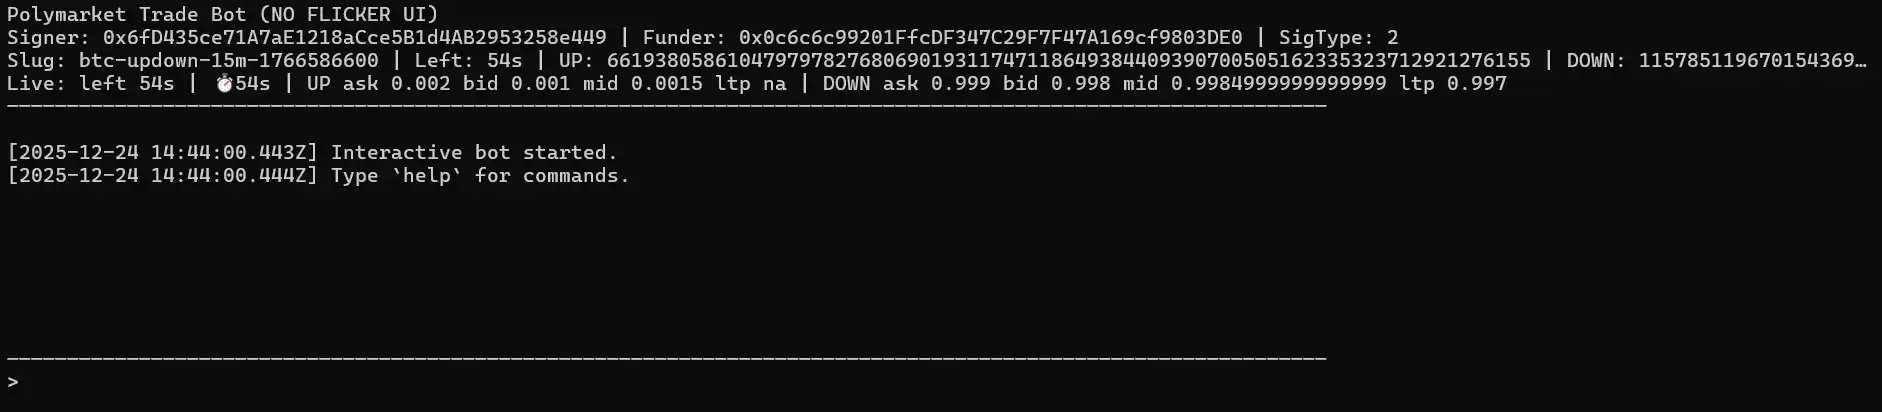
In manual mode, you can place orders directly.

buy up / buy down : Buy a specific USD amount.

buyshares up / buyshares down : Purchase an exact number of shares using user-friendly LIMIT + GTC (Good-Til-Cancelled) orders, filled at the current best ask price.

Automatic mode runs a repeating two-leg cycle.

First, it only observes price fluctuations within the first windowMin minutes after each round starts. If either side drops sufficiently fast (a drop of at least movePct within about 3 seconds), it triggers "Leg 1," buying the side that just crashed.

After completing Leg 1, the bot will never buy the same side again. It waits for "Leg 2 (the hedge)" and only triggers it when the following condition is met: leg1EntryPrice + oppositeAsk <= sumTarget.

When this condition is met, it buys the opposite side. After Leg 2 is completed, the cycle ends, and the bot returns to the observation state, waiting for the next crash signal using the same parameters.

If the round changes during the cycle, the bot abandons the open cycle and restarts with the same settings in the next round.

The parameters for automatic mode are set as follows: auto on [sum=0.95] [move=0.15] [windowMin=2]

· shares: The position size used for both legs of the trade.

· sum: The threshold allowed for hedging.

· move (movePct): The crash threshold (e.g., 0.15 = 15%).

· windowMin: The duration from the start of each round during which Leg 1 is allowed to execute.

Backtesting

The bot's logic is simple: wait for a violent price drop, buy the side that just finished dropping, then wait for the price to stabilize and hedge by buying the opposite side, while ensuring: priceUP + priceDOWN < 1.

But this logic needed testing. Does it really work in the long run? More importantly, the bot has many parameters (shares, sum, move percentage, window minutes, etc.). Which parameter set is optimal and maximizes profit?

My first thought was to let the bot run live for a week and observe the results. The problem was that this would take too long and only test one parameter set, while I needed to test many.

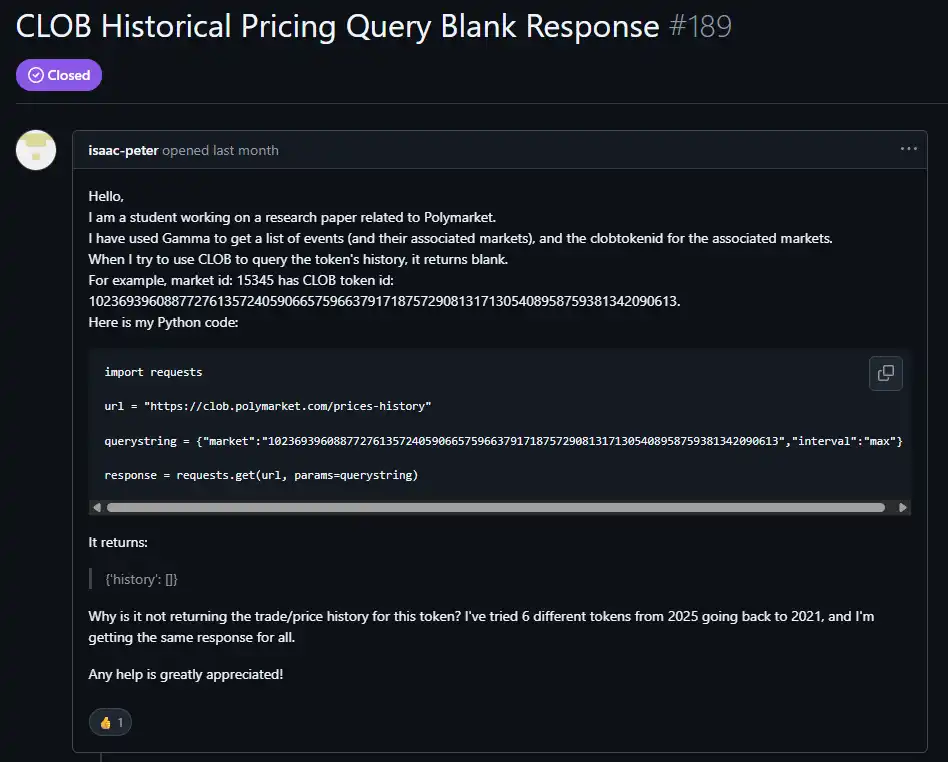
My second thought was to backtest using historical data from the Polymarket CLOB API. Unfortunately, for the BTC 15-minute UP/DOWN market, the historical data endpoint kept returning empty datasets. Without historical price ticks, the backtest couldn't detect "a crash within about 3 seconds," couldn't trigger Leg 1, and would yield 0 cycles and 0% ROI regardless of parameters.

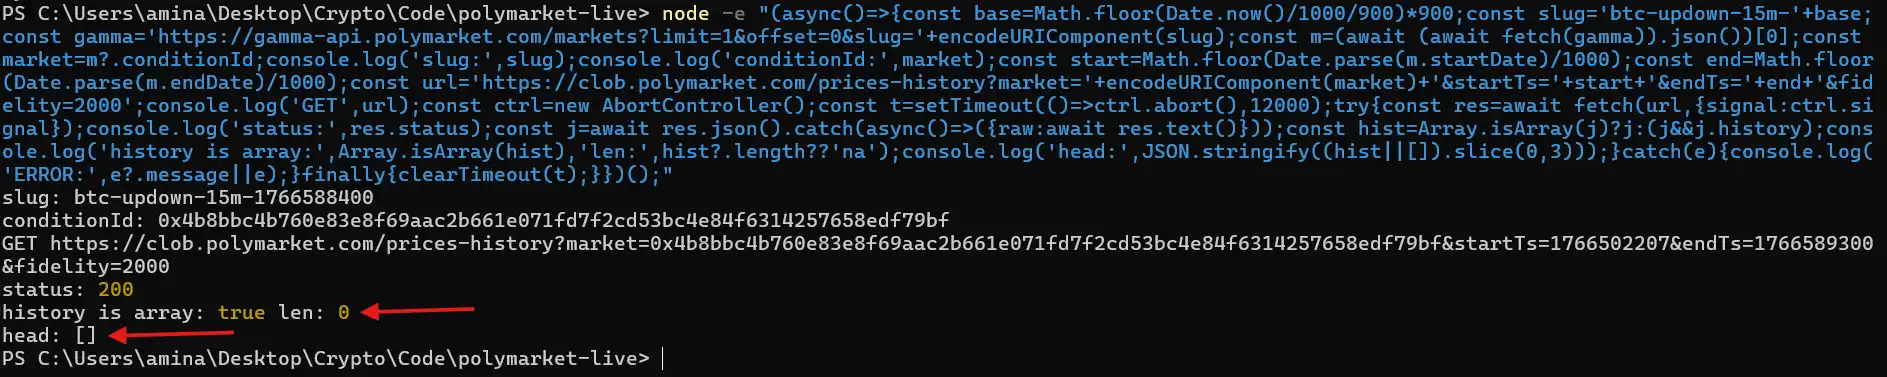
After further investigation, I found other users encountered the same issue fetching historical data for certain markets. I tested other markets that did return historical data and concluded that for this specific market, historical data simply isn't retained.

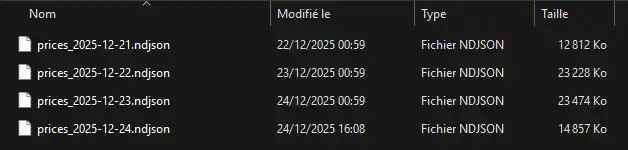
Due to this limitation, the only reliable way to backtest this strategy was to create my own historical dataset by recording the real-time best-ask prices while the bot was running.

The logger writes snapshots to disk containing:

· Timestamp

· Round identifier (round slug)

· Seconds remaining

· UP/DOWN token IDs

· UP/DOWN best ask prices

Subsequently, the "recorded backtest" replays these snapshots and deterministically applies the same automatic logic. This guarantees access to the high-frequency data needed to detect crashes and hedging conditions.

I collected 6 GB of data over 4 days in total. I could have recorded more, but I deemed it sufficient for testing different parameter sets.

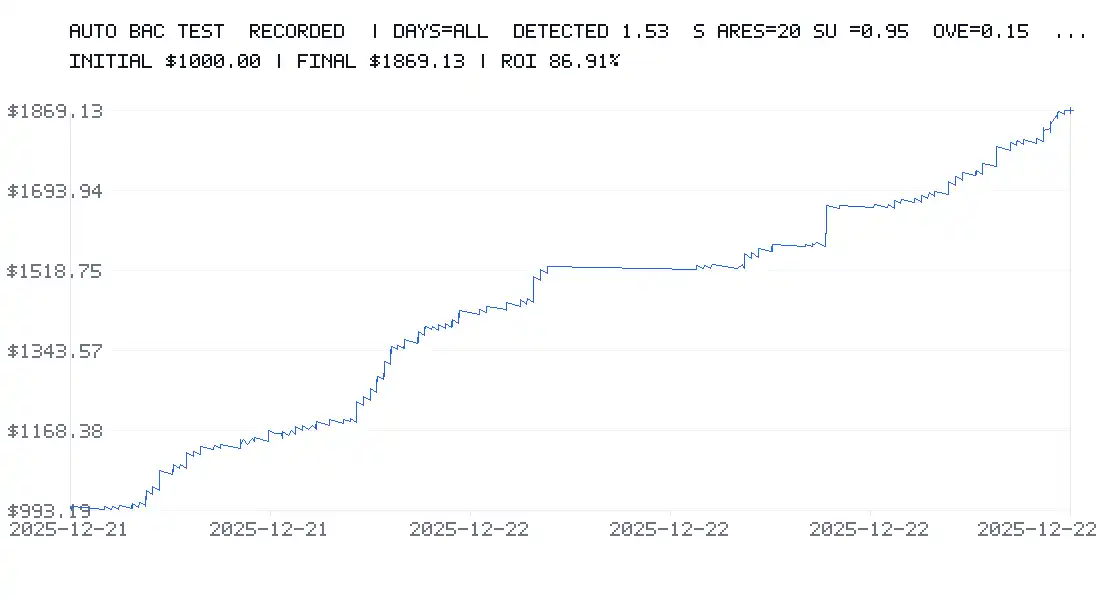
I started testing this parameter set:

· Initial balance: $1,000

· 20 shares per trade

· sumTarget = 0.95

· Crash threshold = 15%

· windowMin = 2 minutes

I also applied a constant 0.5% fee and a 2% spread to stay in a conservative scenario.

The backtest showed an ROI of 86%, turning $1,000 into $1,869 in just a few days.

Then I tested a more aggressive parameter set:

· Initial balance: $1,000

· 20 shares per trade

· sumTarget = 0.6

· Crash threshold = 1%

· windowMin = 15 minutes

Result: -50% ROI after 2 days.

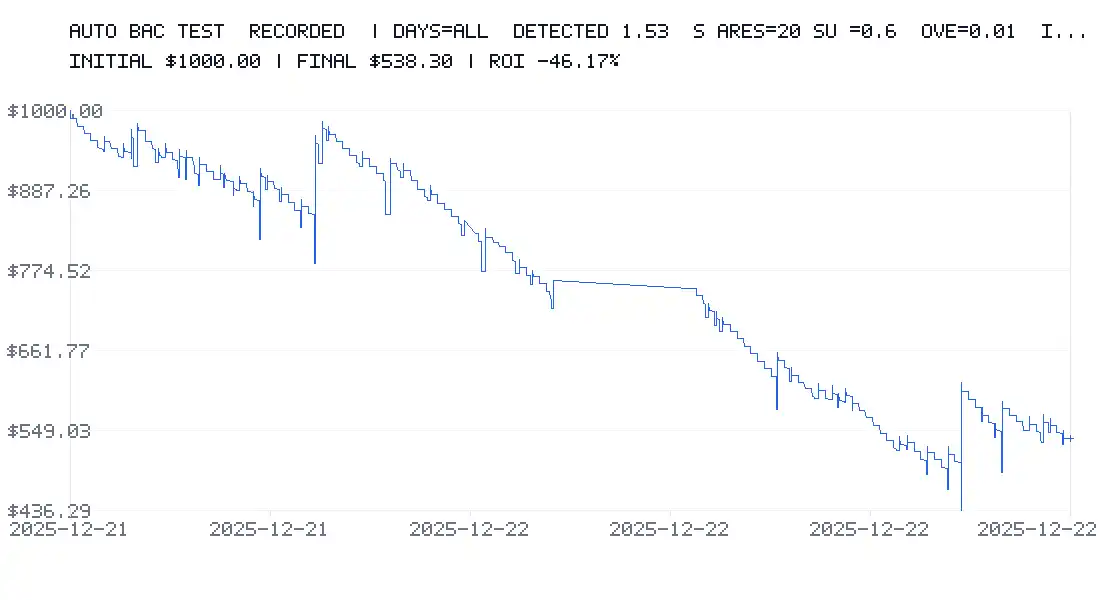
This clearly shows that parameter selection is the most critical factor. It can make you a lot of money or lead to significant losses.

Limitations of Backtesting

Even with fees and spreads included, backtesting has its limitations.

· First, it only used a few days of data, which might not be enough for a comprehensive market perspective.

· It relies on recorded best-ask snapshots; in reality, orders might be partially filled or filled at different prices. Furthermore, order book depth and available volume are not modeled.

· Micro-fluctuations below the second level are not captured (data is sampled once per second). The backtest has 1-second timestamps, but a lot can happen between seconds.

· In the backtest, slippage is constant, and variable latency (e.g., 200–1500 ms) or network spikes are not simulated.

· Each leg of the trade is considered "instantly" executed (no order queuing, no pending orders).

· Fees are charged uniformly, whereas in reality fees might depend on: market/token, maker vs. taker, fee tier, or conditions.

To be pessimistic (prudent), I applied a rule: if Leg 2 fails to execute before the market closes, Leg 1 is considered a total loss.

This is deliberately conservative but doesn't always match reality:

· Sometimes Leg 1 can be closed early,

· Sometimes it ends in-the-money (ITM) and wins,

· Sometimes the loss can be partial rather than total.

While losses might be overestimated, this provides a practical "worst-case" scenario.

Most importantly, backtesting cannot simulate the impact of your large orders on the order book or attracting other traders to hunt you. In reality, your orders can:

· Disturb the order book,

· Attract or repel other traders,

· Cause non-linear slippage.

The backtest assumes you are a pure price taker with no influence.

Finally, it does not simulate rate limits, API errors, order rejections, suspensions, timeouts, reconnections, or the bot being busy and missing signals.

Backtesting is extremely valuable for identifying good parameter ranges, but it is not a 100% guarantee, as some real-world effects cannot be modeled.

Infrastructure

I plan to run this bot on a Raspberry Pi to avoid consuming resources on my main machine and maintain 24/7 operation.

But there is still significant room for improvement:

· Using Rust instead of JavaScript would provide far superior performance and processing times.

· Running a dedicated Polygon RPC node would further reduce latency.

· Deploying on a VPS close to Polymarket's servers would also significantly reduce latency.

There are certainly other optimizations I haven't discovered yet. Currently, I am learning Rust as it is becoming an indispensable language in Web3 development.

İlgili Sorular

QWhat is the core strategy used by the Polymarket trading bot described in the article?

AThe bot's core strategy is to wait for a sharp price drop (a 'flash crash') in the BTC 15-minute UP/DOWN market, buy the side that just crashed (Leg 1), and then wait to hedge by buying the opposite side once the combined price of UP and DOWN tokens meets a specific threshold, ensuring that priceUP + priceDOWN < 1.

QWhy couldn't the author perform a backtest using historical data from the Polymarket API?

AThe author couldn't perform a backtest using the Polymarket CLOB API's historical data because, for the specific BTC 15-minute UP/DOWN market, the historical data endpoint consistently returned empty datasets. No historical price ticks were available, which are required to detect the rapid price movements the strategy relies on.

QHow did the author create a dataset to backtest the bot's strategy despite the lack of historical API data?

AThe author created their own historical dataset by running a custom logger alongside the bot. This logger recorded real-time snapshots of the best-ask prices, timestamps, round identifiers, and other market data. These snapshots were then replayed in a 'recorded backtest' to deterministically apply the bot's logic.

QWhat was the result of the backtest using the conservative parameter set (sumTarget=0.95, movePct=15%, windowMin=2)?

AThe backtest using the conservative parameter set (20 shares per trade, sumTarget=0.95, movePct=15%, windowMin=2 minutes) showed a return on investment (ROI) of 86%, turning an initial $1,000 into $1,869 over a few days, even after applying a constant 0.5% fee and 2% spread.

QWhat are some key limitations of the backtesting method mentioned by the author?

AKey limitations include: using only a few days of data; relying on best-ask snapshots without modeling order book depth or partial fills; not capturing sub-second micro-fluctuations; assuming constant slippage and instant order execution; not simulating the market impact of large orders; and not accounting for API errors, network latency, or rate limits.

İlgili Okumalar

An Open-Source AI Tool That No One Saw Predicted Kelp DAO's $292 Million Vulnerability 12 Days Ago

An open-source AI security tool flagged critical risks in Kelp DAO’s cross-chain architecture 12 days before a $292 million exploit on April 18, 2026—the largest DeFi incident of the year. The vulnerability was not in the smart contracts but in the configuration of LayerZero’s cross-chain bridge: a 1-of-1 Decentralized Verifier Network (DVN) setup allowed an attacker to forge cross-chain messages with a single compromised node. The tool, which performs AI-assisted architectural risk assessments using public data, identified several unremediated risks, including opaque DVN configuration, single-point-of-failure across 16 chains, unverified cross-chain governance controls, and similarities to historical bridge attacks like Ronin and Harmony. It also noted the absence of an insurance pool, which amplified losses as Aave and other protocols absorbed nearly $300M in bad debt. The attack unfolded over 46 minutes: the attacker minted 116,500 rsETH on Ethereum via a fraudulent message, used it as collateral to borrow WETH on lending platforms, and laundered funds through Tornado Cash. While an emergency pause prevented two subsequent attacks worth ~$200M, the damage was severe. The tool’s report, committed to GitHub on April 6, scored Kelp DAO a medium-risk 72/100—later acknowledged as too lenient. It failed to query on-chain DVN configurations or initiate private disclosure, highlighting gaps in current DeFi security approaches that focus on code audits but miss config-level and governance risks. The incident underscores the need for independent, AI-powered risk assessment tools that evaluate protocol architecture, not just code.

marsbit1 saat önce

An Open-Source AI Tool That No One Saw Predicted Kelp DAO's $292 Million Vulnerability 12 Days Ago

marsbit1 saat önce

İşlemler

Spot
Futures

Popüler Makaleler

FRAX Nasıl Satın Alınır

HTX.com’a hoş geldiniz! FRAX (FRAX) satın alma işlemlerini basit ve kullanışlı bir hâle getirdik. Adım adım açıkladığımız rehberimizi takip ederek kripto yolculuğunuza başlayın. 1. Adım: HTX Hesabınızı OluşturunHTX'te ücretsiz bir hesap açmak için e-posta adresinizi veya telefon numaranızı kullanın. Sorunsuzca kaydolun ve tüm özelliklerin kilidini açın. Hesabımı Aç2. Adım: Kripto Satın Al Bölümüne Gidin ve Ödeme Yönteminizi SeçinKredi/Banka Kartı: Visa veya Mastercard'ınızı kullanarak anında FRAX (FRAX) satın alın.Bakiye: Sorunsuz bir şekilde işlem yapmak için HTX hesap bakiyenizdeki fonları kullanın.Üçüncü Taraflar: Kullanımı kolaylaştırmak için Google Pay ve Apple Pay gibi popüler ödeme yöntemlerini ekledik.P2P: HTX'teki diğer kullanıcılarla doğrudan işlem yapın.Borsa Dışı (OTC): Yatırımcılar için kişiye özel hizmetler ve rekabetçi döviz kurları sunuyoruz.3. Adım: FRAX (FRAX) Varlıklarınızı SaklayınFRAX (FRAX) satın aldıktan sonra HTX hesabınızda saklayın. Alternatif olarak, blok zinciri transferi yoluyla başka bir yere gönderebilir veya diğer kripto para birimlerini takas etmek için kullanabilirsiniz.4. Adım: FRAX (FRAX) Varlıklarınızla İşlem YapınHTX'in spot piyasasında FRAX (FRAX) ile kolayca işlemler yapın.Hesabınıza erişin, işlem çiftinizi seçin, işlemlerinizi gerçekleştirin ve gerçek zamanlı olarak izleyin. Hem yeni başlayanlar hem de deneyimli yatırımcılar için kullanıcı dostu bir deneyim sunuyoruz.

268 Toplam GörüntülenmeYayınlanma 2026.03.03Güncellenme 2026.03.03

FRAX Nasıl Satın Alınır

MANTRA Nedir

I. Proje TanıtımıMANTRA, gerçek dünya düzenleyici gerekliliklerine uyum sağlama ve bunları uygulama yeteneğine sahip, güvenlik odaklı bir RWA Katman 1 Blok Zinciridir. Kurumlar ve Geliştiriciler için tasarlanmış olan MANTRA, izinli uygulamalar için izin gerektirmeyen bir Blok Zinciri sunmaktadır.Ana Özellikler: * Cosmos SDK kullanılarak inşa edilmiştir, IBC uyumlu, CosmWasm destekli * Egemen bir PoS doğrulayıcı seti ile güvence altına alınmıştır * 10k TPS'ye kadar ölçeklenebilir * Düzenleyici uyumlu RW'ları oluşturmak, ticaretini yapmak ve yönetmek için yerleşik Modüller, SDK'lar ve API'ler * Yerel olmayan kullanıcıları ve kurumları Web3'e entegre etmek için geliştirilmiş Kullanıcı Deneyimi.1) Temel Bilgilerİsim:MANTRA(OM)III. İlgili BağlantılarBeyaz Kağıt:https://docs.mantrachain.io/Resmi web sitesi:https://www.mantrachain.io/Keşif Araçları:https://mintscan.io/mantraSosyal Medya:https://x.com/MANTRA_ChainNot: Proje tanıtımı, resmi proje ekibi tarafından yayımlanan veya sağlanan materyallerden alınmıştır, yalnızca referans içindir ve yatırım tavsiyesi teşkil etmez. HTX, ortaya çıkan doğrudan veya dolaylı kayıplardan sorumluluk kabul etmez.

552 Toplam GörüntülenmeYayınlanma 2026.03.04Güncellenme 2026.03.04

MANTRA Nedir

MANTRA Nasıl Satın Alınır

HTX.com’a hoş geldiniz! Mantra (MANTRA) satın alma işlemlerini basit ve kullanışlı bir hâle getirdik. Adım adım açıkladığımız rehberimizi takip ederek kripto yolculuğunuza başlayın. 1. Adım: HTX Hesabınızı OluşturunHTX'te ücretsiz bir hesap açmak için e-posta adresinizi veya telefon numaranızı kullanın. Sorunsuzca kaydolun ve tüm özelliklerin kilidini açın. Hesabımı Aç2. Adım: Kripto Satın Al Bölümüne Gidin ve Ödeme Yönteminizi SeçinKredi/Banka Kartı: Visa veya Mastercard'ınızı kullanarak anında Mantra (MANTRA) satın alın.Bakiye: Sorunsuz bir şekilde işlem yapmak için HTX hesap bakiyenizdeki fonları kullanın.Üçüncü Taraflar: Kullanımı kolaylaştırmak için Google Pay ve Apple Pay gibi popüler ödeme yöntemlerini ekledik.P2P: HTX'teki diğer kullanıcılarla doğrudan işlem yapın.Borsa Dışı (OTC): Yatırımcılar için kişiye özel hizmetler ve rekabetçi döviz kurları sunuyoruz.3. Adım: Mantra (MANTRA) Varlıklarınızı SaklayınMantra (MANTRA) satın aldıktan sonra HTX hesabınızda saklayın. Alternatif olarak, blok zinciri transferi yoluyla başka bir yere gönderebilir veya diğer kripto para birimlerini takas etmek için kullanabilirsiniz.4. Adım: Mantra (MANTRA) Varlıklarınızla İşlem YapınHTX'in spot piyasasında Mantra (MANTRA) ile kolayca işlemler yapın.Hesabınıza erişin, işlem çiftinizi seçin, işlemlerinizi gerçekleştirin ve gerçek zamanlı olarak izleyin. Hem yeni başlayanlar hem de deneyimli yatırımcılar için kullanıcı dostu bir deneyim sunuyoruz.

237 Toplam GörüntülenmeYayınlanma 2026.03.04Güncellenme 2026.03.04

MANTRA Nasıl Satın Alınır

Tartışmalar

HTX Topluluğuna hoş geldiniz. Burada, en son platform gelişmeleri hakkında bilgi sahibi olabilir ve profesyonel piyasa görüşlerine erişebilirsiniz. Kullanıcıların A (A) fiyatı hakkındaki görüşleri aşağıda sunulmaktadır.

活动图片