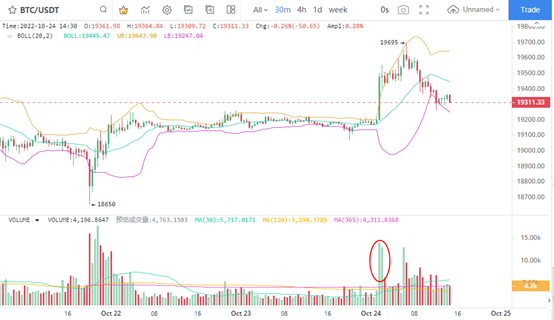
【重磅解读】ETH鲸鱼抛压达3年来峰值,KLAY强震106%反弹

火币资讯2022-10-24 tarihinde yayınlandı2022-10-25 tarihinde güncellendi

Özet

BTC和ETH短线振幅走强,预示着行情变盘加速。

1、BTC小幅反弹

BTC 的30分钟K线图显示,随着区间内窄幅波动延续,BTC价格再次冲高回落。在放量期间,BTC成交量的回升仅延续了1个小时,表明多头拉升价格能力相当有限,BTC价格再次表现为疲态。因此,近期行情走势仍然有较强的低迷预期。同时,整数关口2万美元下方没有有效拉升表现,BTC在振幅达到了10月22日的0.75%以后,首次价格反弹又一次失败。
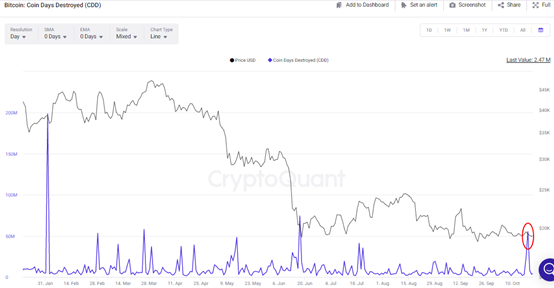
2、BTC长期投资者销毁增加

BTC主力大量获利出逃信号持续,币天销毁数在10月18日达到了6月17日以来的最高数值,为5544万,表明抛售压力再次增加。也就是说,BTC价格目前处在了比较典型的变盘阶段。虽然BTC价格在 10月21日触底18650美元以后开始反弹,但是反弹力度较弱,BTC价格冲高回落预示着近期价格可能再次走低。
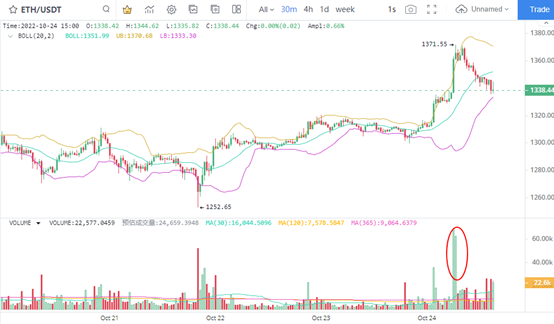
3、ETH收盘回升

30分钟K线方面,ETH的价格短线出现反弹回升,价格上涨期间成交量短线放大,推动ETH价格最高触及1371美元高位。也就是说,ETH价格以及达到了9月19日以来的最高收盘价。考虑到成交量放大时间较短,加之抛售压力快速提升的缘故,使得ETH价格维持强势的周期很短。因此,目前走势上虽然看似强于BTC价格,但是能够持续上涨的可能性较低。

4、鲸鱼抛售增加

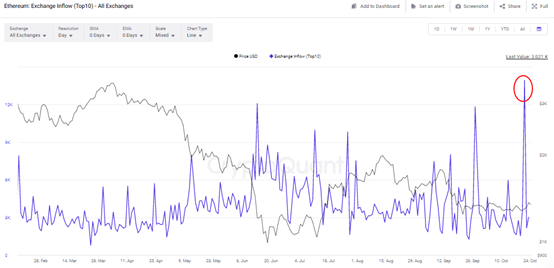
在ETH的价格短线回升前,交易所抛售压力已经增长,10月21日的抛售占比已经达到了13948。也就是说,流入到交易所的抛压中,前10笔流入量达到了13948枚ETH,以1300美元计算的价值达到了1813万美元。从绝对数值上看,ETH在交易所的抛售压力位近3年来的最高水平。可见,ETH在10月24日上涨乏力,继续提示典型抛压信号。
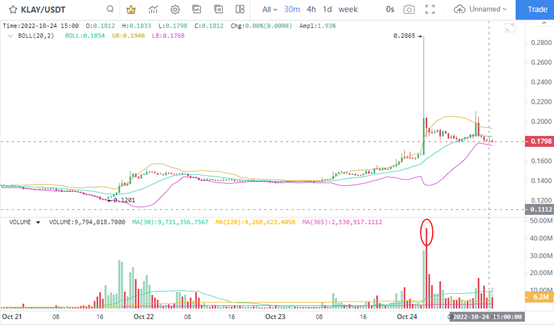
5、Klay利好飙升

从10月21日开始,KLAY价格表现为放量突破信号,分别在10月21日和10月23日上涨11%和31%。值得关注的是,10月23日的价格振幅高达106%,异动表现或许是消息面推动的杰哥。

10月24日消息,据官方公告,韩国互联网巨头Kakao旗下公链Klaytn官方团队已向Klaytn治理委员会 (GC) 的提交“减少区块奖励”的治理提案,建议将现有区块奖励减少三分之一,以优化KLAY发行水平。如果该提案被管理委员会批准(投票截止到10月25日),通胀调整将在11月中旬左右在链上反映出来,届时每个区块铸造奖励将从现行的9.6 KLAY更改为6.4 KLAY,新铸造代币在治理委员会、Klaytn成长基金、Klaytn改进储备(KIR)之间的分配比例将从34%:54%:12%变更为50%:40%:10%,KLAY代币的年铸造量从3%减少到2%,KLAY代币的年通胀率将从10%降至6.48%。

受此影响,KLAY价格也迎来了难得的反转信号。不过30分钟K线也显示,价格出现了明确的高位放量信号。因此需要关注低吸机会,而不是在抛压增加的时候追涨交易。

İlgili Okumalar

Bitcoin Trading Strategy Breakdown: Celebrity Predictions and Classic Models All Fail, Only These Four Indicators Remain

Analysis of Bitcoin Trading Strategies: Why Celebrity Forecasts and Classic Models Fail, Leaving Only These Four Reliable Indicators This analysis examines the failure of common Bitcoin prediction methods and identifies four reliable indicators for constructing a trading strategy. The author reviewed all major BTC prediction approaches from 2017-2025, categorizing them into three groups: celebrity price targets (consistently over-optimistic), analytical models like Stock-to-Flow (broken post-2022), and on-chain signals. The key finding is that more data often creates confusion, not clarity. The strategy discards unreliable elements: celebrity predictions (incentivized to be extreme), pure models (invalidated by post-ETF market changes), and the Fear & Greed Index used alone (too many false signals). Four reliable indicators were selected: 1. **MVRV Z-Score:** Accurately identifies cycle bottoms when entering its green zone (e.g., 2018, 2020, 2022). Note: Its ability to call tops is now ineffective post-2024. 2. **SOPR (28-day MA):** Consistently signals bottoms when below 1.0, indicating holders are selling at a loss. 3. **ETF Net Flow:** A crucial post-2024 metric showing institutional momentum (e.g., sustained inflows = buying). 4. **Macro Liquidity (Fed policy & M2):** Sets the overall directional bias (e.g., bullish during easing cycles). The core strategy involves waiting for a multi-signal共振 (resonance). For example, a bottom signal requires MVRV in the green zone + SOPR < 1.0. A top signal requires overheated on-chain data + sustained ETF outflows. Macro policy sets the overall direction. The Fear & Greed Index is only used as a weighted confirmatory signal, never alone. Action is only taken when three or more indicators align. The author automated this into a monitoring system that sends Telegram alerts only when signals trigger. As of the article's date (April 15, 2026), the system showed a strong bottom signal: extreme fear (F&G=12), MVRV in the buy zone, and SOPR < 1.0. The only contrary signal was weak ETF flows. Historically, such triple on-chain共振 has preceded 100%+ returns. The conclusion emphasizes building a personal framework over relying on external predictions, allowing for iterative improvement and customization based on individual risk tolerance.

marsbit2 saat önce

Bitcoin Trading Strategy Breakdown: Celebrity Predictions and Classic Models All Fail, Only These Four Indicators Remain

marsbit2 saat önce

İşlemler

Spot
Futures
活动图片