Ethereum's Merge on Sep. 15 turned out to be a sell-the-news event, which looks set to continue.
Notably, Ether (ETH) dropped considerably against the U.S. dollar and Bitcoin (BTC) after the Merge. As of Sep. 22, ETH/USD and ETH/BTC trading pairs were down by more than 20% and 17%, respectively, since Ethereum's switch to Proof-of-Stake (PoS).
What's eating Ether bulls?
Multiple catalysts contributed to Ether's declines in the said period. First, ETH's price fall against the dollar appeared in sync with similar declines elsewhere in the crypto market, driven by Federal Reserve's 75 basis points (bps) rate hike.
Second, Ethereum faced a lot of flak for becoming too centralized post-Merge.
Only five entities produced 60% of the blocks so far. The biggest share belongs to Lido DAO, an Ethereum staking service, that has 4.19 million ETH deposited, or over 30% of the total amount staked into Ethereum's official PoS smart contract.
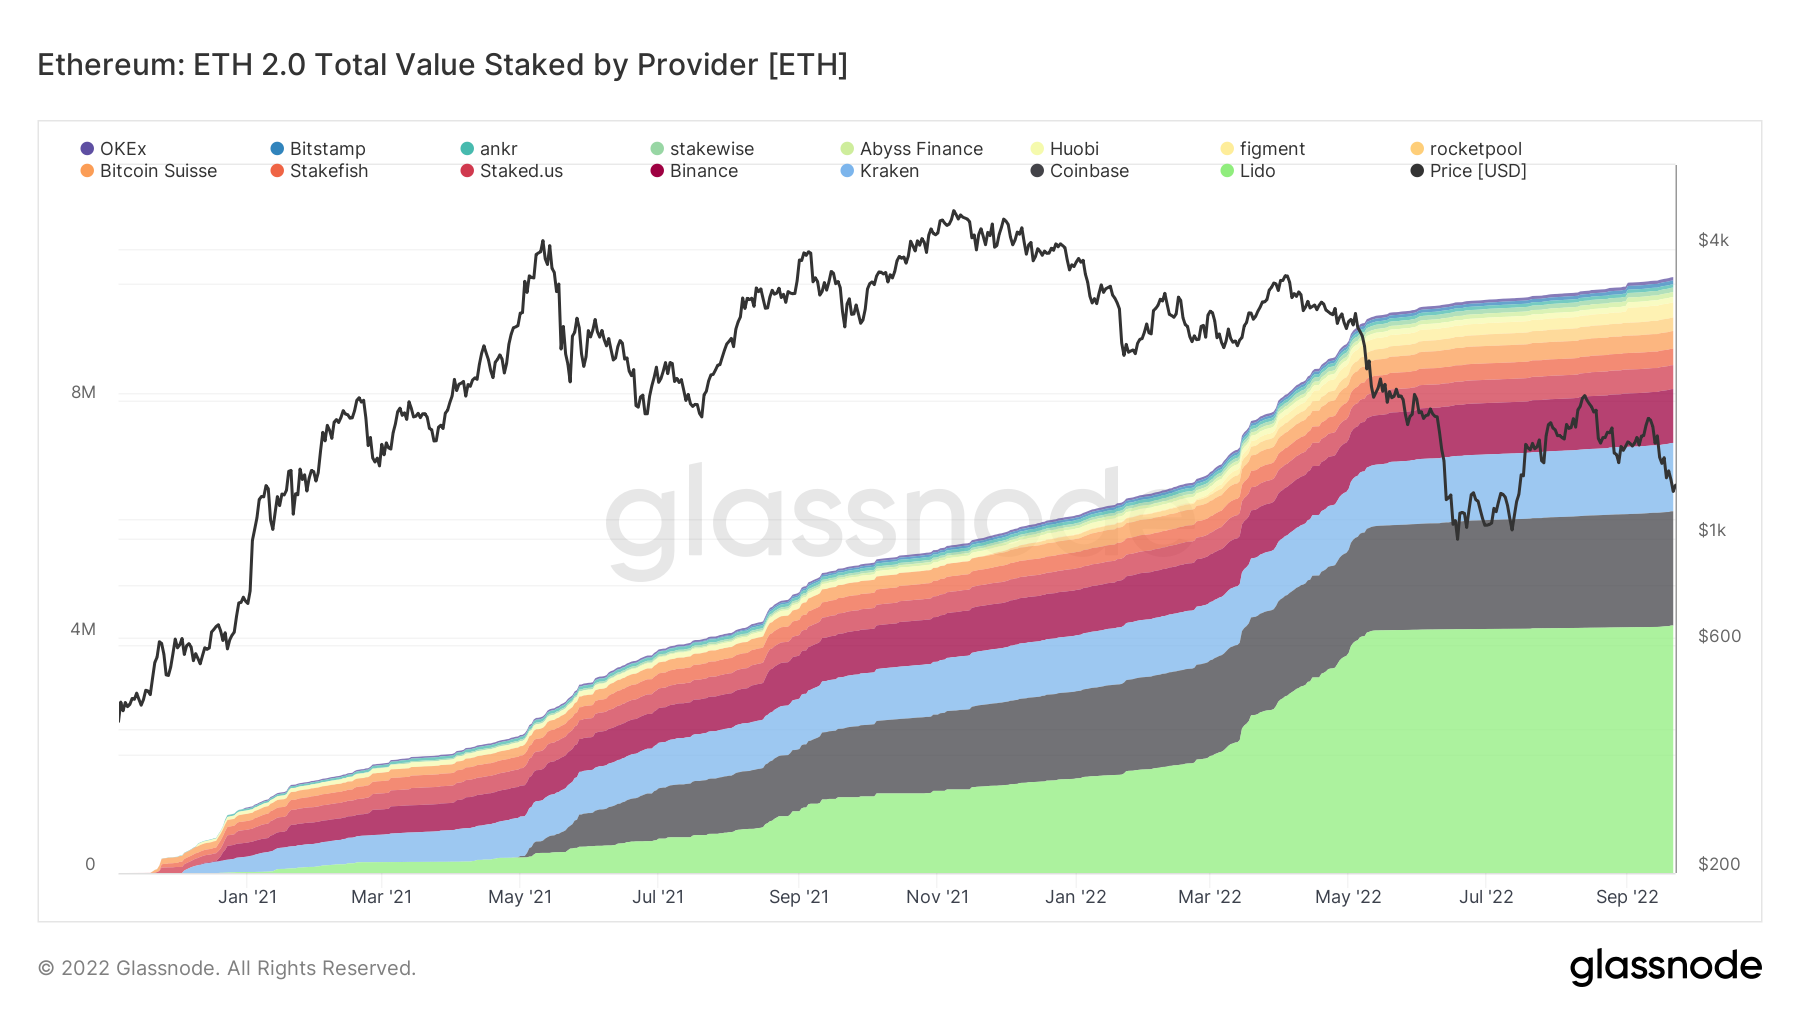
ETH 2.0 total value staked by provider. Source: Glassnode
Third, institutional investors, or "smart money," also reduced exposure to the Ethereum-focused investment vehicles in the day leading up to and after the Merge.
Ethereum funds witnessed $15.4 million worth of capital outflows from their coffers in the week ending Sep. 16, according to CoinShares' weekly report. In contrast, Bitcoin-based investment funds attracted $17.4 million in the same week, suggesting capital migration post-Merge.
Lastly, Ether also felt extreme selling pressure from its proof-of-work (PoW) miners, who sold $40 million worth of Ether in the days leading up to the PoS update.
Independent market analyst Tuur Demeester noted that Ether could continue its decline versus Bitcoin in the coming days, citing ETH/BTC's previous reaction to key events in the Ethereum market, as shown below.
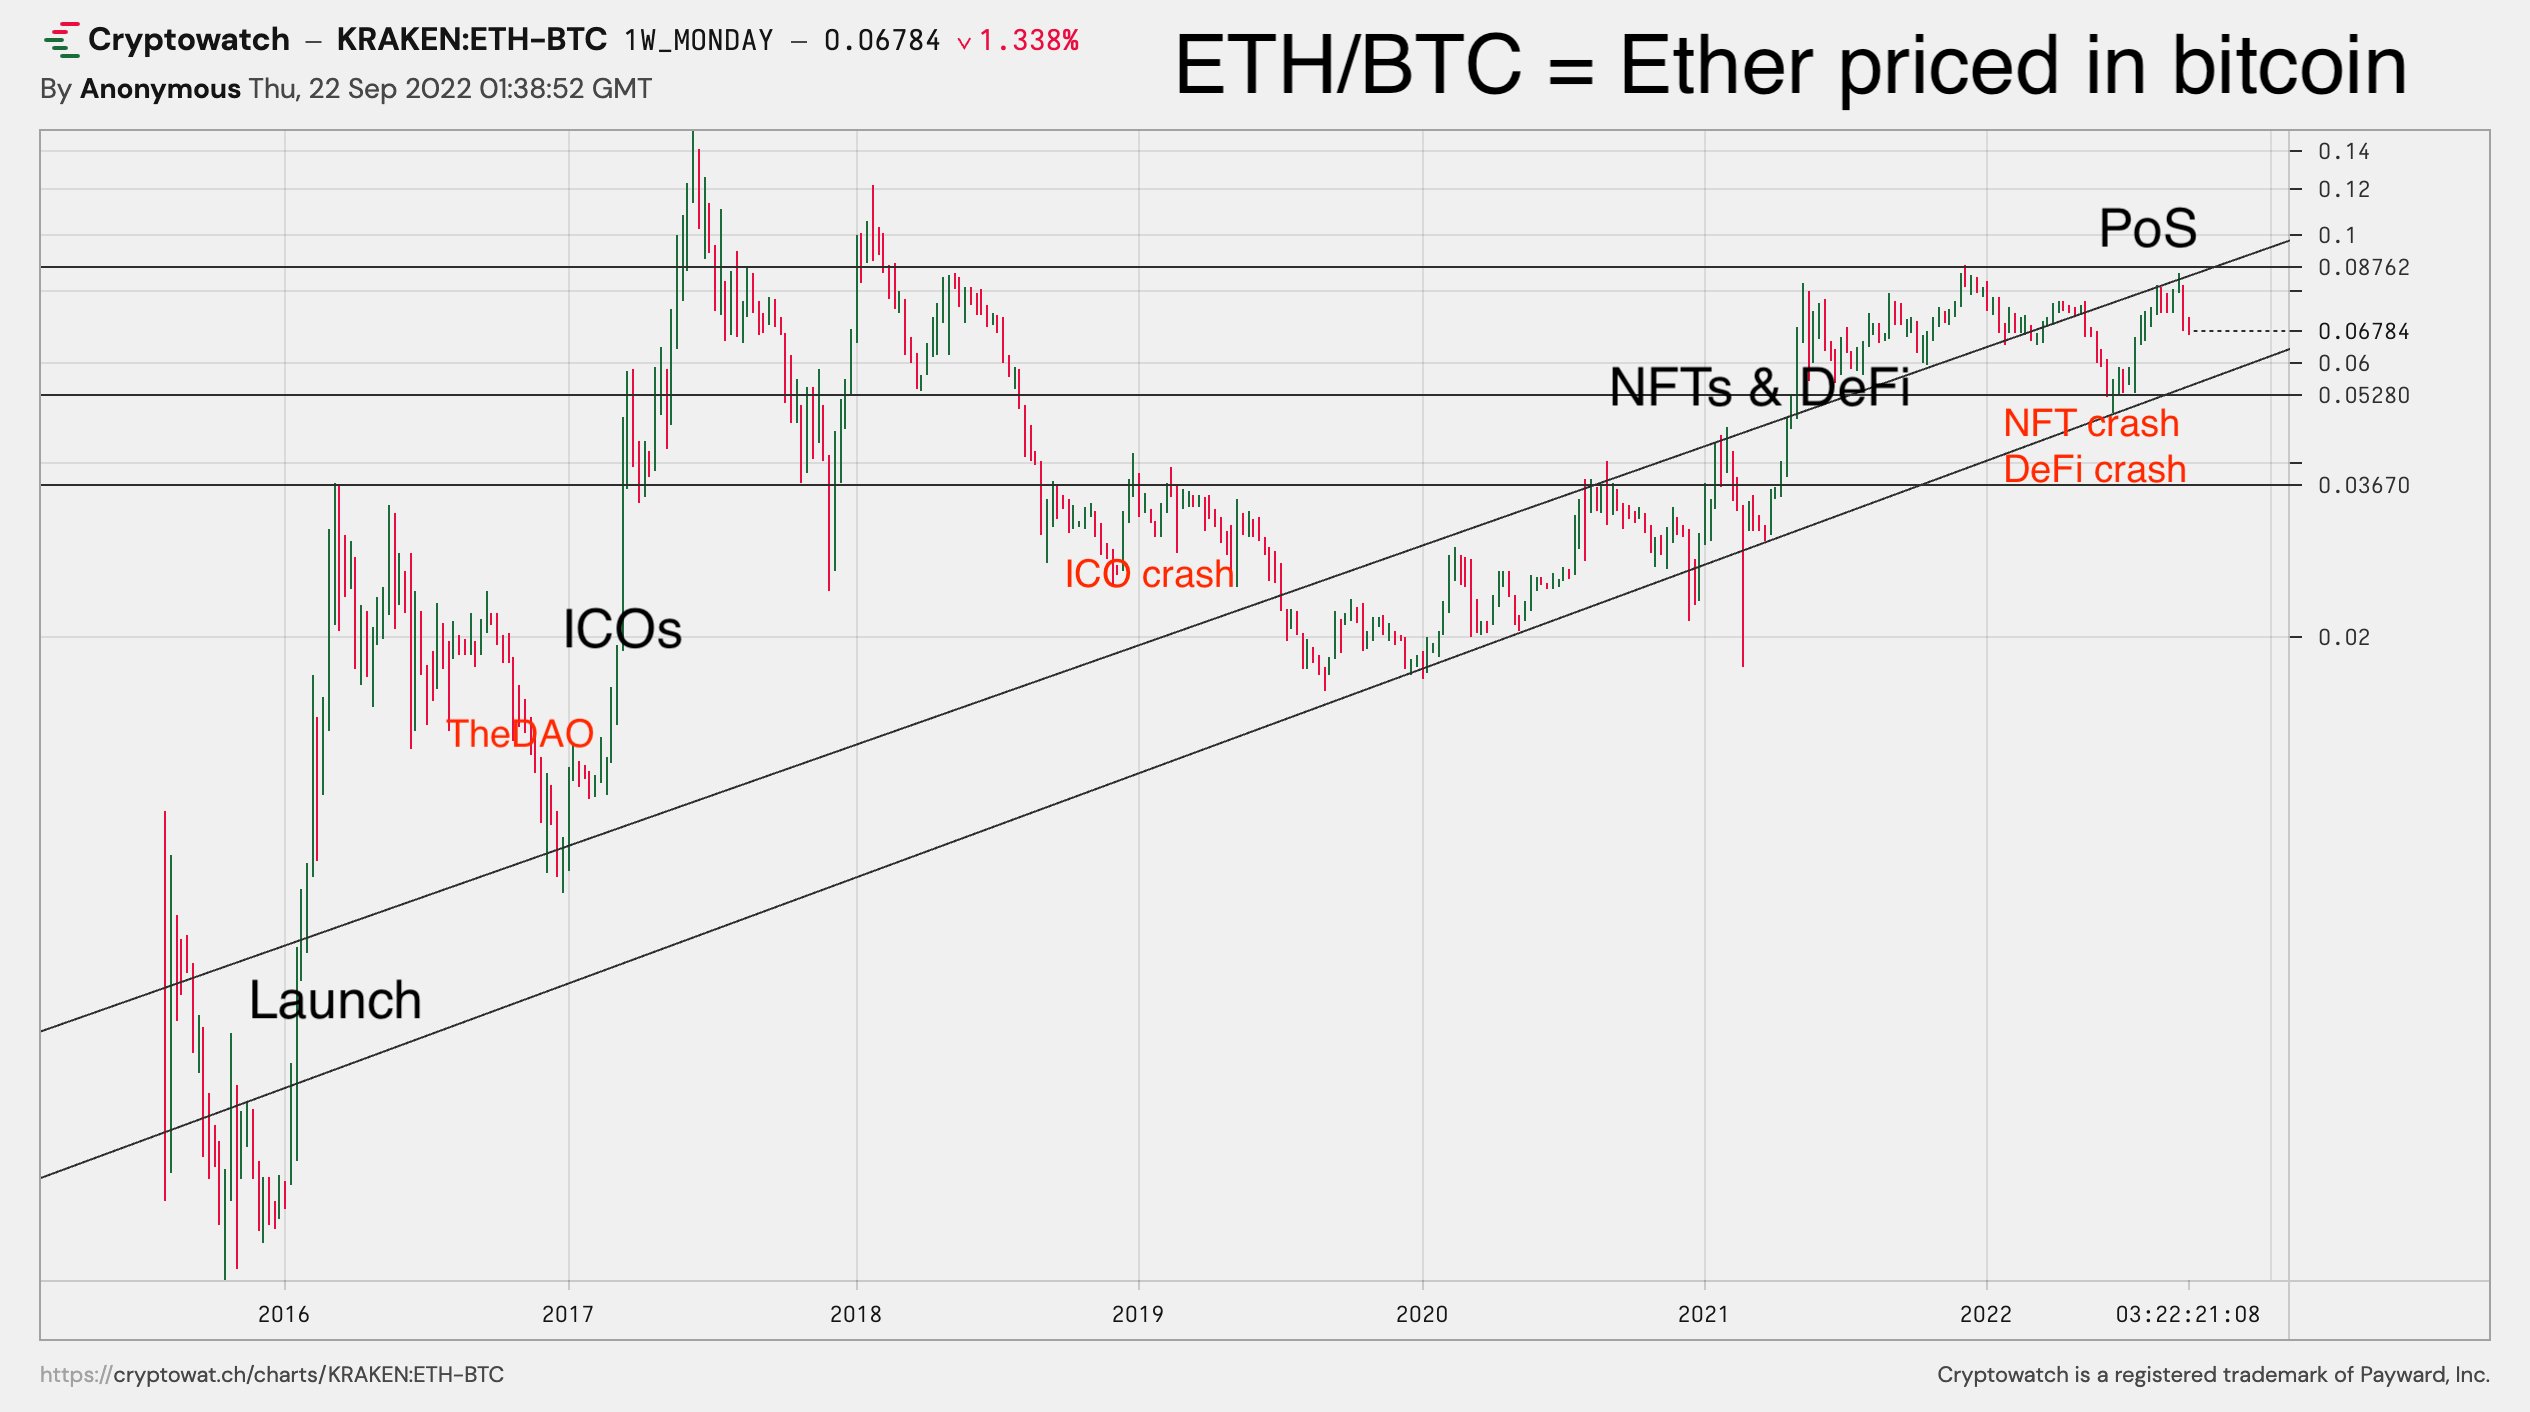
ETH/BTC price performance around key Ethereum events. Source: TradingView
The chart shows Ether traders' practice of pumping ETH against Bitcoin ahead of adoption-related narratives, such as nonfungible tokens (NFT) and the Defi craze of 2021, and the ICO boom of 2017.
All of these rallies fizzled out once the hype subsided. Demeester highlights Ethereum's switch to PoS as a similar hype phase that pushed ETH/BTC higher in 2022, expecting the pair to undergo a deep correction in the coming weeks.
"I expect ETH/BTC to break down violently at some point," he said, adding:
"ETH is a ticking time bomb."
ETH/BTC technicals hint at 10% drop ahead
Placing these fundamentals against Ether's technicals versus Bitcoin presents a similarly bearish setup.
On the three-day chart, ETH/BTC has dropped by nearly 25% after topping out at 0.085 BTC, a level that coincides with its long-serving resistance level of 0.081 BTC.
Now,the pair eyes an additional drop toward its multi-month ascending trendline support, as illustrated below.
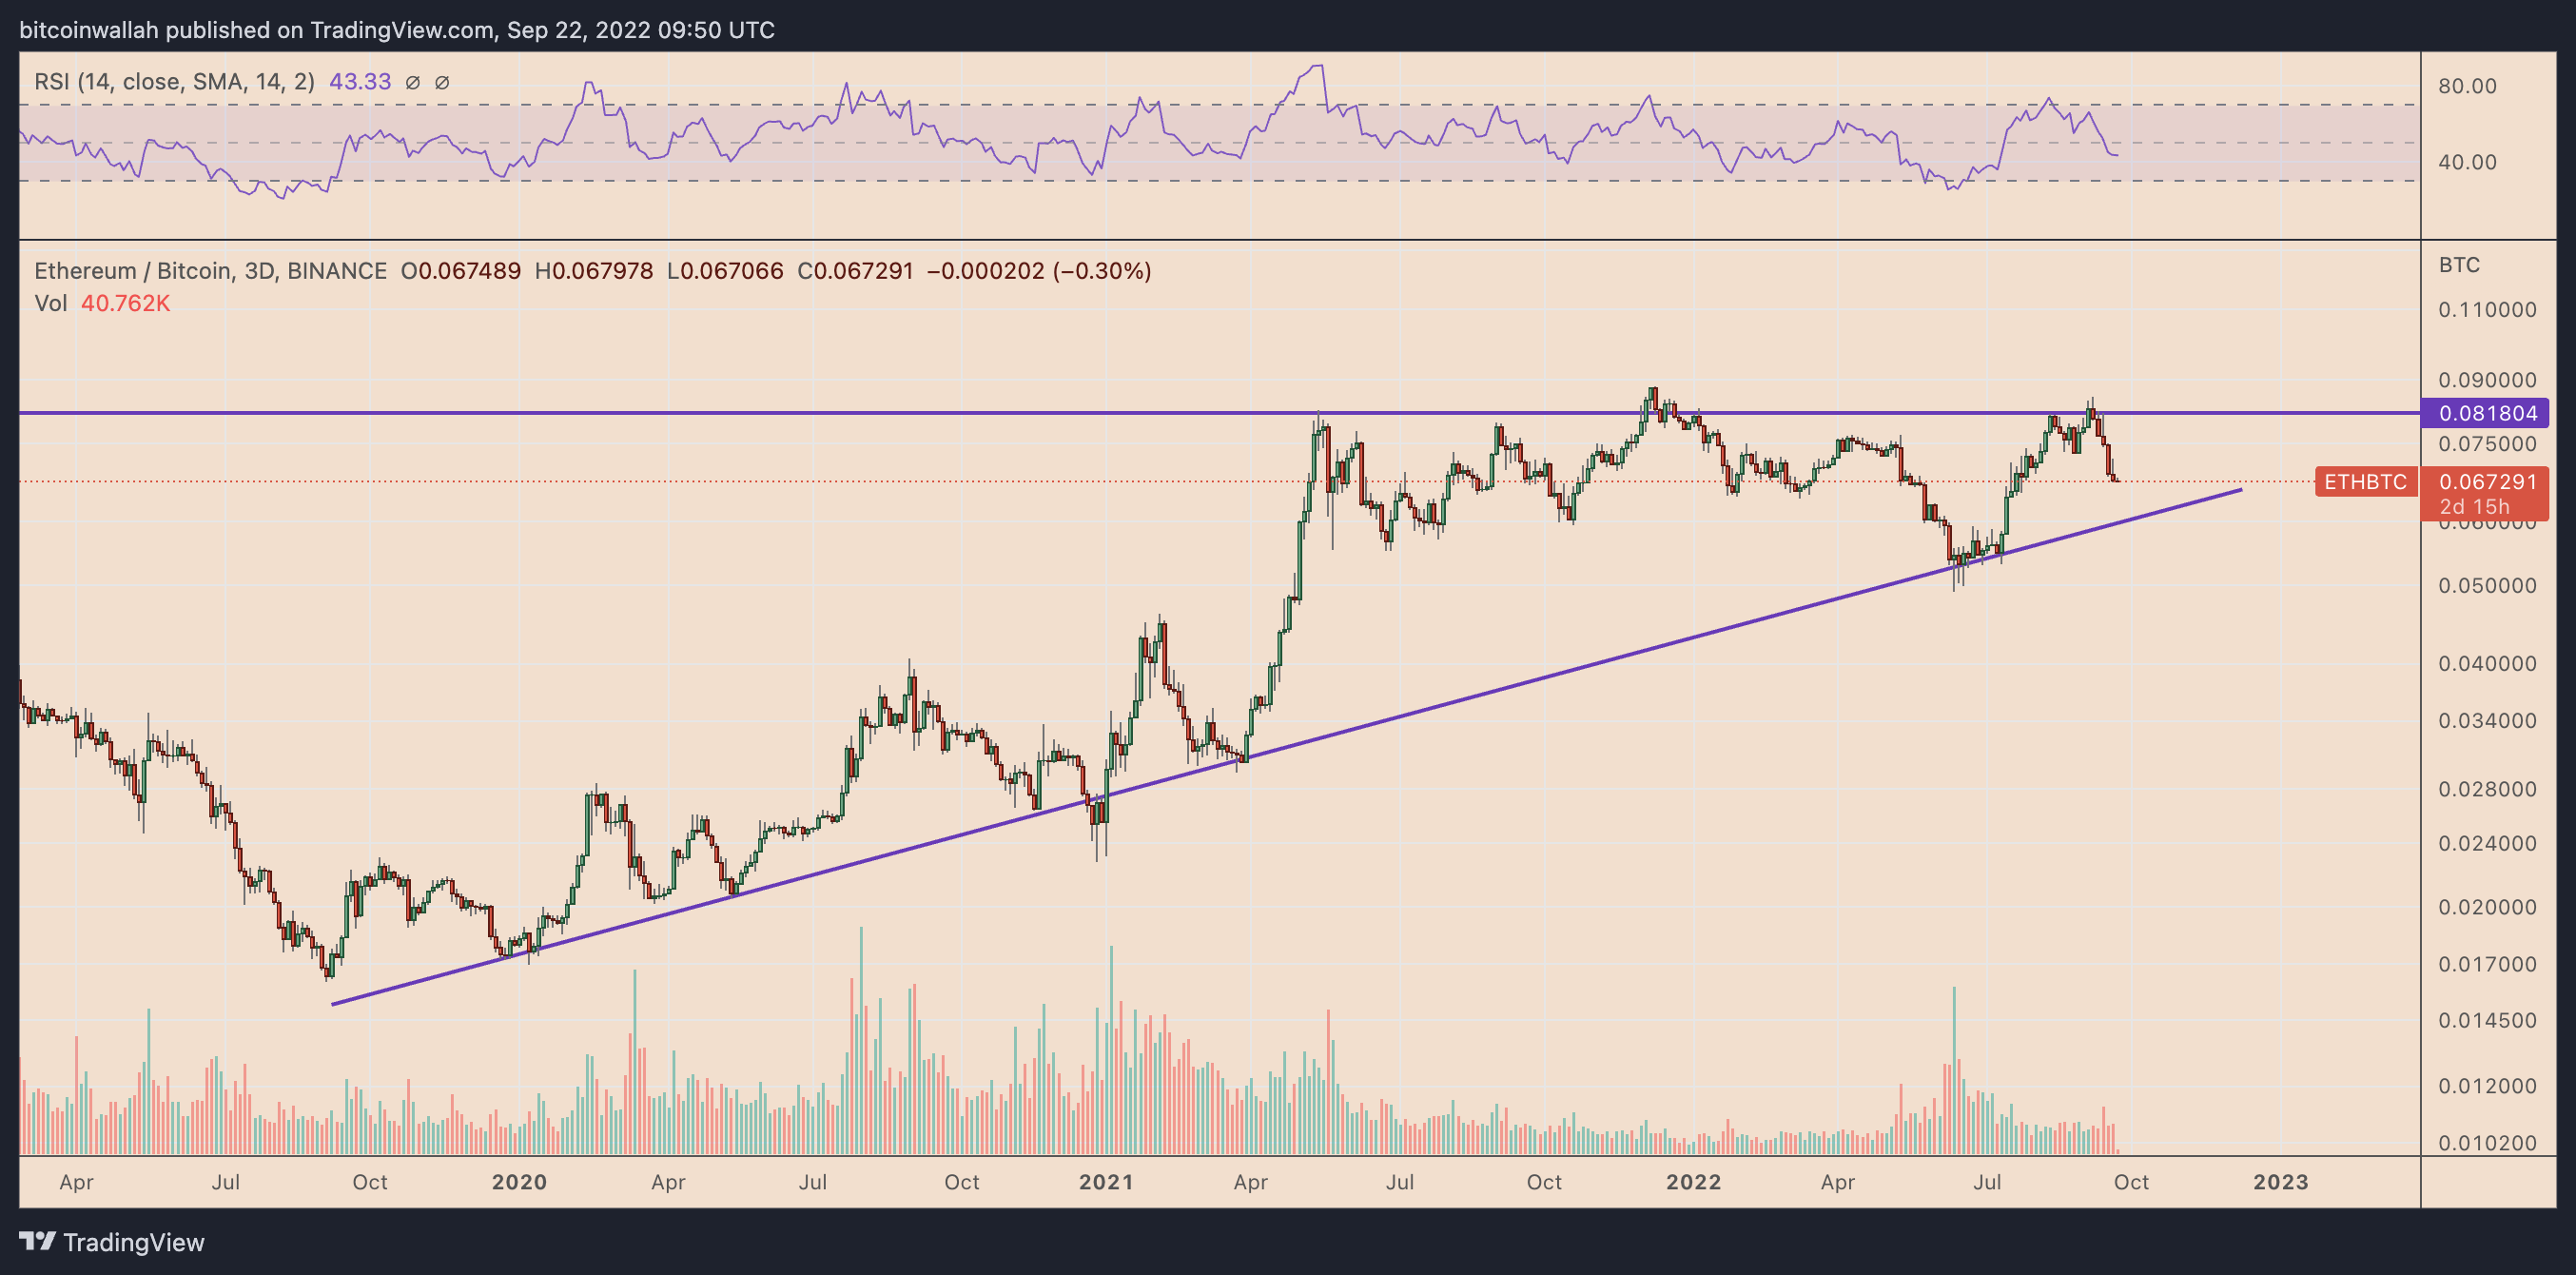
ETH/BTC three-day price chart. Source: TradingView
The trendline support falls in sync with 0.06 BTC, a level that has served as a pullback zone in 2022. In other words, another 10% decline is on the table.
ETH/USD's bearish setup is worse
Against the dollar, Ether could decline by as much as 45% due to what appears to be an ascending triangle pattern in a downtrend.
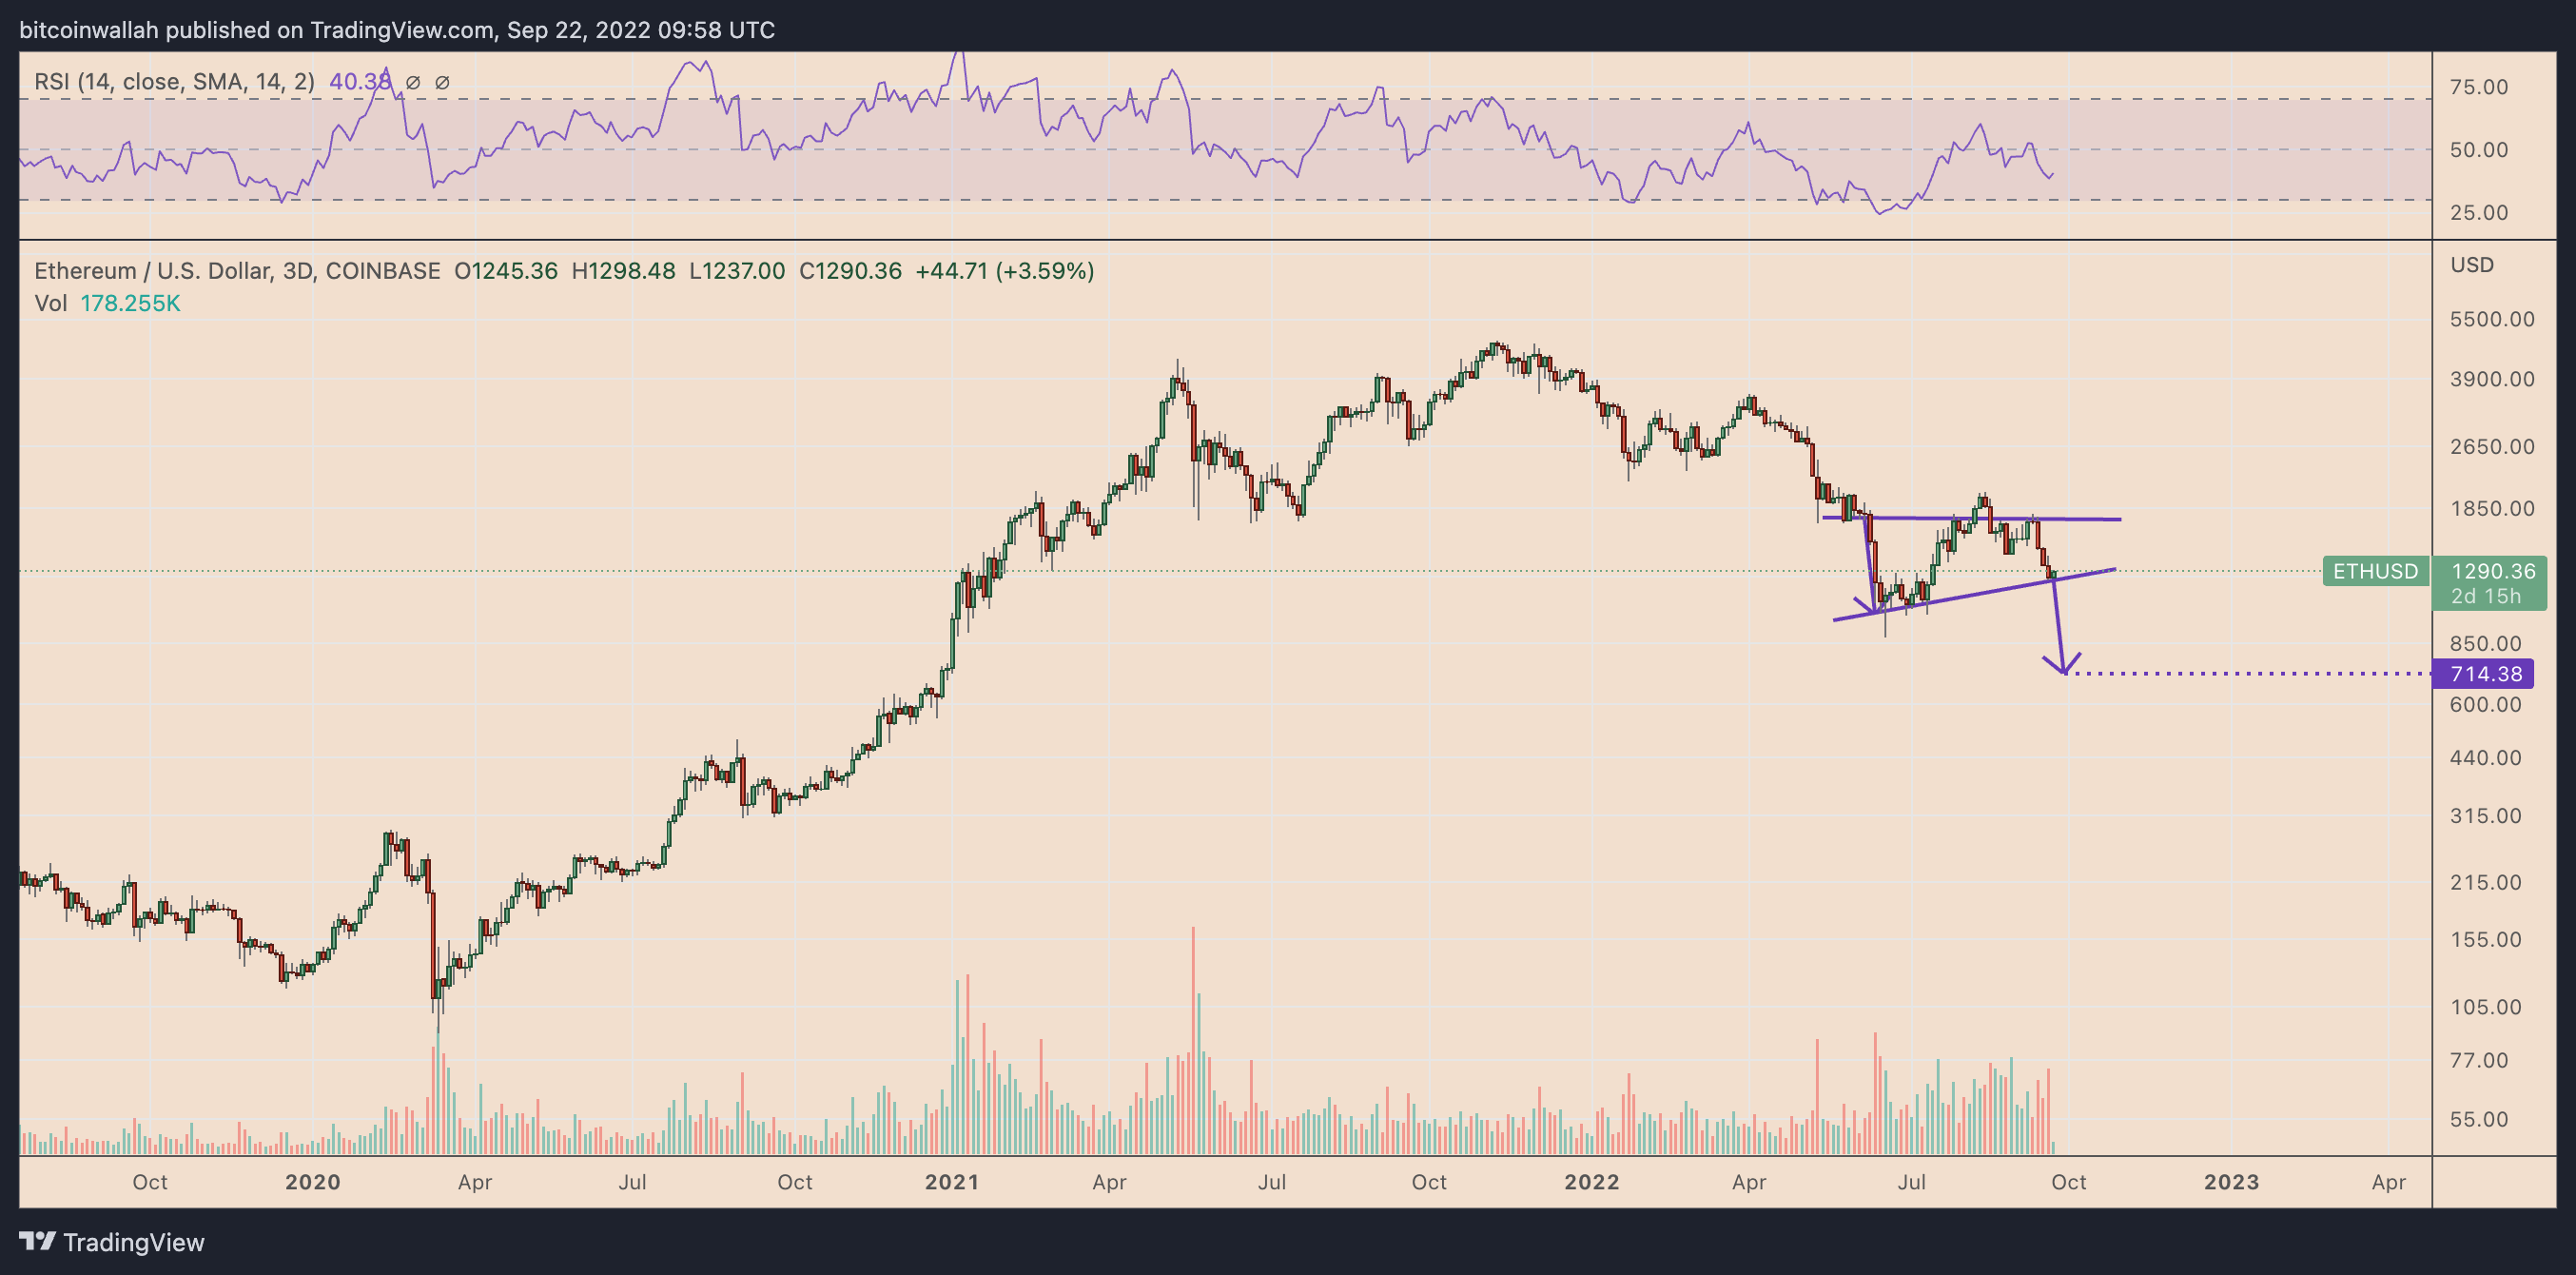
ETH/USD three-day price chart featuring 'ascending triangle' pattern. Source: TradingView
As a rule, the bearish continuation pattern resolves after the price breaks below its lower trendline and then falls by as much as its maximum height. Hence the bearish target sits near $700 by the end of this year, down 45% from today's price.
Conversely, a pullback from the triangle's lower trendline could have Ether rise toward the upper trendline, which means a rally toward $1,775, or a 35% gain from current price levels.