Celsius Network price prediction: Here’s why CEL is soaring

coinjournal2022-09-02 tarihinde yayınlandı2022-09-02 tarihinde güncellendi

Özet

Celsius Network price rebounded on Friday after the latest news on the company’s bankruptcy proceedings.

Celsius Network price rebounded on Friday after the latest news on the company’s bankruptcy proceedings. The CEL token price jumped to a high of $1.6835, which was the highest level since August 24. It has jumped by more than 100% from its lowest level in August.

Why is CEL rallying?

CEL is the native token for the Celsius Network, the Nexo competitor that filed for voluntary bankruptcy in June of this year. At its peak, the company had billions of dollars in client deposits and it was one of the biggest success stories in the crypto industry.

In May, the company announced that it would suspend deposits and withdrawals as the prices of most tokens collapsed. The CEL token rose sharply on Friday after the company asked the judge overseeing the case for permission to release $50 million to customers.

These funds are stuck in the company’s custody accounts, which are designed to store digital assets. In a statement, the judge said that the matter will be heard on October 6 of this year. Still, these funds are a small percentage of over $200 million that are stuck at the company’s custody accounts.

At the same time, the company still owes customers over $4.2 billion of assets in the company’s earn accounts. Therefore, the future of the company is still in question even though some companies are attempting to buy it.

Celsius Network price rose because of this news. For a thinly traded assets like CEL, any good news usually attracts attention of day traders. This explains why the price of the token went parabolic. It also explains why the VGX price rose. VGX is the native token for Voyager Digital, a company that also filed for bankruptcy.

Celsius Network price forecast

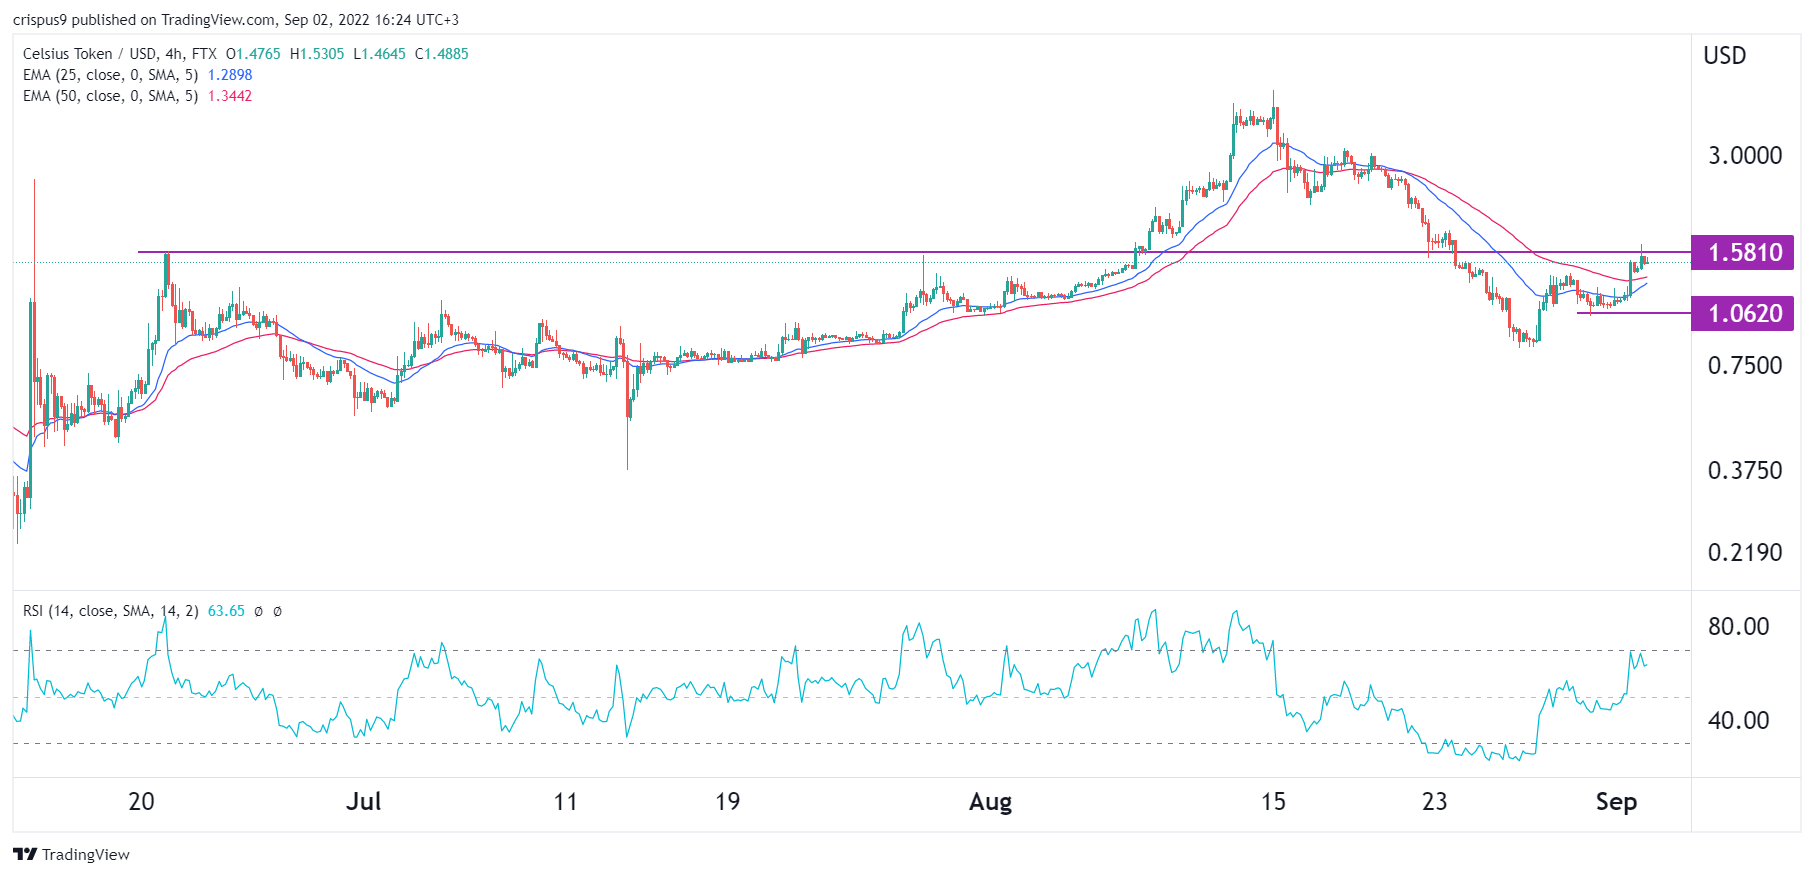
The four-hour chart shows that the CEL price has been in a strong bullish trend in the past few days. It rose to a high of $1.5810, which was the highest point on June 21. As it rose, it moved slightly above the 25-day and 50-day moving averages while the Relative Strength Index (RSI) is nearing its overbought level.

Therefore, Celsius Network price will likely resume the bearish trend as the hype surrounding the $50 million return eases. If this happens, the coin will likely retest the important support at $1.06.

İlgili Okumalar

Bitcoin Trading Strategy Breakdown: Celebrity Predictions and Classic Models All Fail, Only These Four Indicators Remain

Analysis of Bitcoin Trading Strategies: Why Celebrity Forecasts and Classic Models Fail, Leaving Only These Four Reliable Indicators This analysis examines the failure of common Bitcoin prediction methods and identifies four reliable indicators for constructing a trading strategy. The author reviewed all major BTC prediction approaches from 2017-2025, categorizing them into three groups: celebrity price targets (consistently over-optimistic), analytical models like Stock-to-Flow (broken post-2022), and on-chain signals. The key finding is that more data often creates confusion, not clarity. The strategy discards unreliable elements: celebrity predictions (incentivized to be extreme), pure models (invalidated by post-ETF market changes), and the Fear & Greed Index used alone (too many false signals). Four reliable indicators were selected: 1. **MVRV Z-Score:** Accurately identifies cycle bottoms when entering its green zone (e.g., 2018, 2020, 2022). Note: Its ability to call tops is now ineffective post-2024. 2. **SOPR (28-day MA):** Consistently signals bottoms when below 1.0, indicating holders are selling at a loss. 3. **ETF Net Flow:** A crucial post-2024 metric showing institutional momentum (e.g., sustained inflows = buying). 4. **Macro Liquidity (Fed policy & M2):** Sets the overall directional bias (e.g., bullish during easing cycles). The core strategy involves waiting for a multi-signal共振 (resonance). For example, a bottom signal requires MVRV in the green zone + SOPR < 1.0. A top signal requires overheated on-chain data + sustained ETF outflows. Macro policy sets the overall direction. The Fear & Greed Index is only used as a weighted confirmatory signal, never alone. Action is only taken when three or more indicators align. The author automated this into a monitoring system that sends Telegram alerts only when signals trigger. As of the article's date (April 15, 2026), the system showed a strong bottom signal: extreme fear (F&G=12), MVRV in the buy zone, and SOPR < 1.0. The only contrary signal was weak ETF flows. Historically, such triple on-chain共振 has preceded 100%+ returns. The conclusion emphasizes building a personal framework over relying on external predictions, allowing for iterative improvement and customization based on individual risk tolerance.

marsbit1 saat önce

Bitcoin Trading Strategy Breakdown: Celebrity Predictions and Classic Models All Fail, Only These Four Indicators Remain

marsbit1 saat önce

İşlemler

Spot
Futures
活动图片