This weekly report conducts a multi-period technical structure analysis focusing on BTC and HYPE. For Bitcoin, the analysis begins with the daily and 4-hour charts, examining the correction structure since the May 6th peak. Combined with a proprietary quantitative model, it offers predictions for key resistance and support levels this week, along with medium- and short-term trading paths. The HYPE section concentrates on the 4-hour chart trend, analyzing the structural evolution of the current rebound and providing corresponding risk control suggestions for this week's short-term operations. Details are as follows.
Last Week's Strategy Verification
- BTC Market Prediction Verification: Last week's article explicitly stated that Bitcoin's short-term correction was nearing its end. The actual market movement largely aligned with the predicted path, validating the forward-looking judgment.
- HYPE Market Prediction Verification: Last week's article pointed out that a short-term entry opportunity for long positions in HYPE was about to emerge. Current market movements have confirmed this judgment.
I. Multi-Period Trend Structure Analysis of Bitcoin
1. Daily Chart Trend Structure Analysis
Bitcoin Daily Candlestick Chart
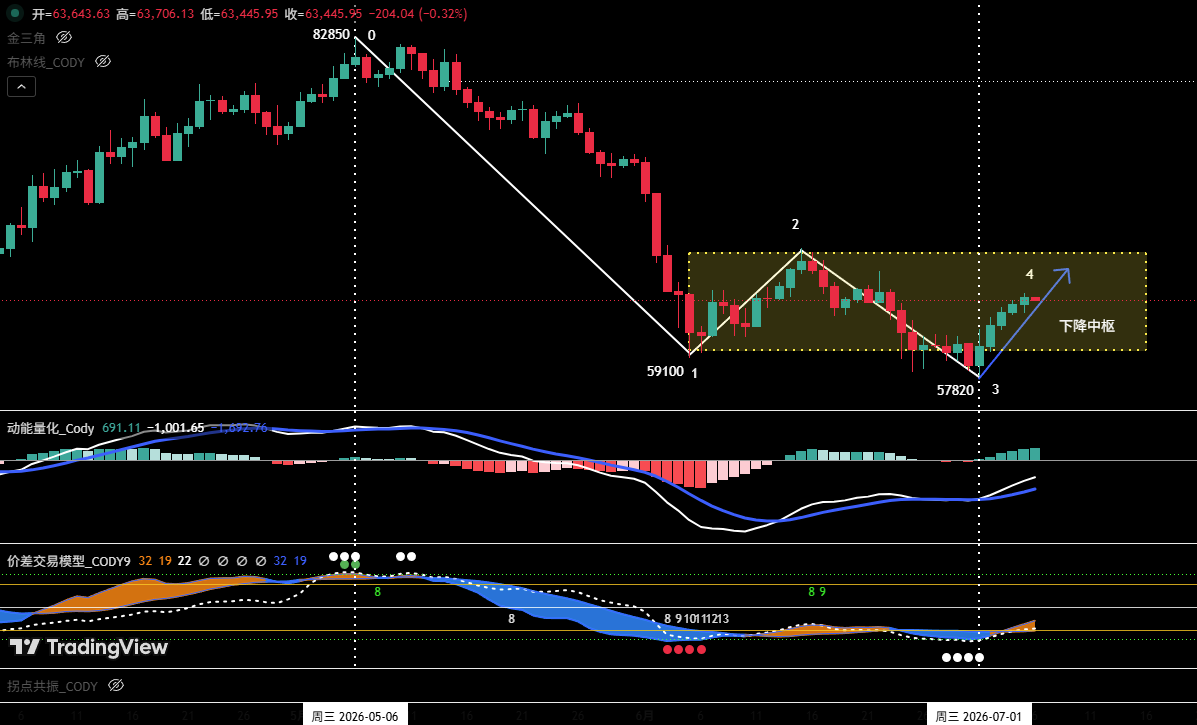
Figure 1
1. As shown in Figure 1: The correction that began from the May 6th high of $82,850 has clearly formed a four-stage correction structure on the daily chart, from "Point 0" to "Point 4".
2. The market is currently in the (3-4) rebound phase. The final position of "Point 4" will determine the short-term price direction.
- Path One: If the rebound price at "Point 4" can break through the resistance at $65,700, the probability of a subsequent pullback directly breaking below the support at the July 1st low of $57,820 will be significantly reduced. In this scenario, the market is expected to rebound again after the correction ends, with the recent overall trend likely entering a range-bound consolidation pattern. The longer this consolidation structure persists, the more it helps to slow downward momentum and accumulate strength for a subsequent bullish counterattack.
- Path Two: If the rebound price at "Point 4" fails to reach $65,700, or even falls below $64,500, the probability of a subsequent pullback directly breaking below $57,820 increases substantially, making it more likely for the market to continue its downward trend.
3. Analysis based on the proprietary quantitative model indicates a high probability of the market entering range-bound consolidation (i.e., Path One).
2. Hourly Chart Trend Structure Deep Dive (Using 4-hour as Analysis Period)
Bitcoin 4-hour Candlestick Chart
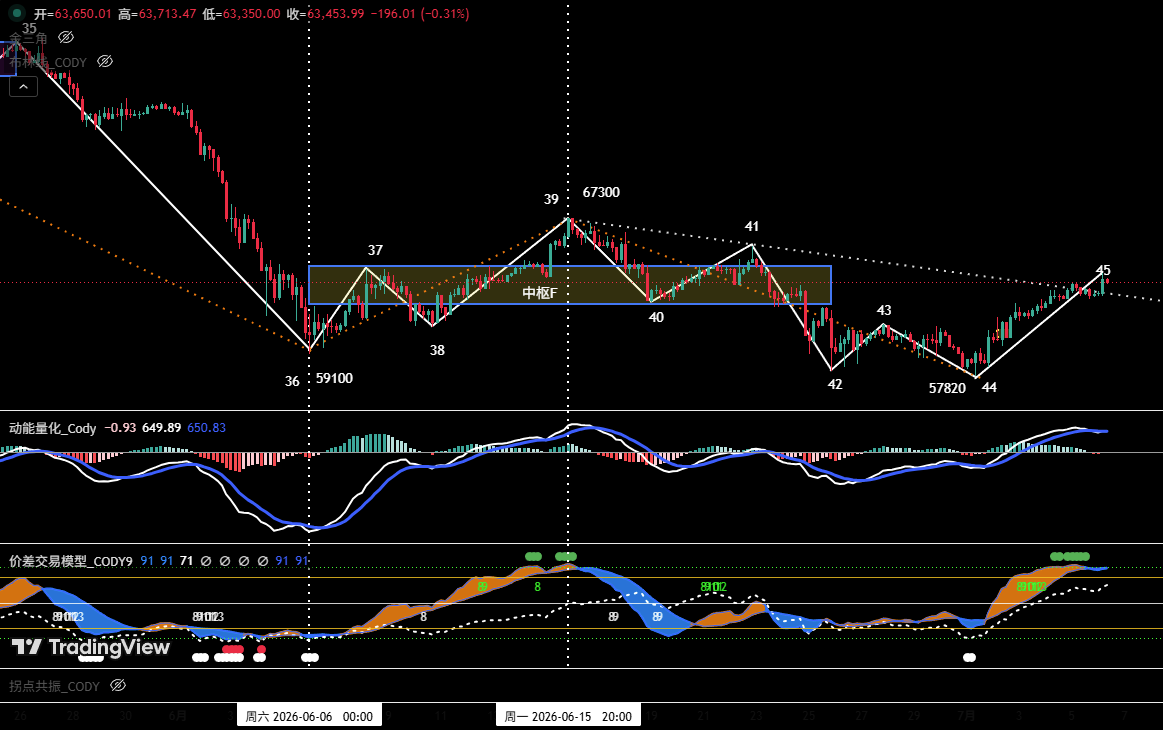
Figure 2
1. Last week's review pointed out: "If the end of Point 44 is below $58,110 accompanied by the formation of a momentum bottom divergence, the market will present a rebound opportunity." Last week's price action validated this judgment, with the actual movement highly consistent with the predicted structure.
2. On the 4-hour chart, the hourly-level decline wave that started from the June 15th high of $67,300 has completed a full five-wave structure; simultaneously, at the end of the correction, a clear momentum bottom divergence formed between low points "Point 44" and "Point 42," providing technical support for the subsequent oversold rebound.
3. The market is currently in the (44-45) rebound phase. From Figure 2, the current rebound high "Point 45" has broken above the lower boundary of the previous "Falling Channel F" (around $62,300), indicating short-term momentum is shifting in favor of bulls. If the price can further break through "Point 41" (around $65,700), it would signal an upgrade in rebound strength, significantly reducing the probability of a subsequent pullback directly breaking below "Point 44" (around $57,820).
II. Bitcoin Weekly Market Forecast and Trading Strategy (07.06~07.12)
1. BTC Weekly Market Trend Forecast
Core View: Focus on the high point of the daily oversold rebound starting from the low of $57,820.
2. Core Resistance Levels:
• First Resistance Zone: $64,500~$65,700 area (previous significant high/low points)
• Second Resistance Zone: Around $67,300 (previous significant resistance area)
• Third Resistance Zone: $69,500~$71,000 area (previous significant resistance area)
3. Core Support Levels:
• First Support Level: $60,950~$62,300 area (previous significant support)
• Second Support Level: Around $57,820 (previous significant support)
• Third Support Level: Around $55,000 (previous significant support)
4. Weekly Trading Strategy
1 Medium-Term Strategy:
Bitcoin Daily Candlestick Chart (Position Monitoring Model)
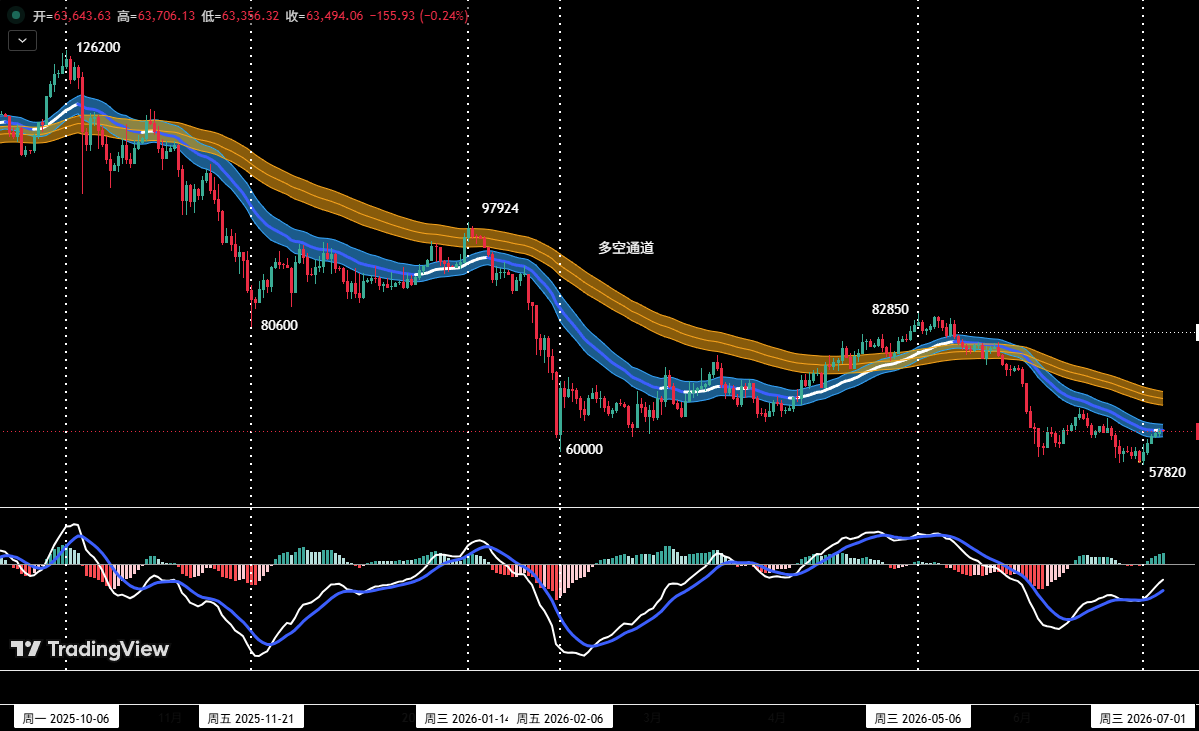
Figure 3
As shown in Figure 3, the price has effectively broken below the "Bull-Bear Channel," confirming a shift to a bear-dominated market structure.
- Current medium-term short positions can be maintained at around 20%.
- If the price rebounds to the $65,700~$67,300 zone and shows signs of stagnation, combined with top signals from the proprietary quantitative model, consider increasing medium-term short positions to within 50%.
2 Short-Term Strategy
Utilize 30% of capital, set stop-losses, and seek "price difference" opportunities based on support and resistance levels (using 30-minute/60-minute charts as operational cycles).
3 Short-Term Operation Contingency Plans
To dynamically respond to the market's complex evolution, two specific operational plans, A and B, are drafted in advance:
- Plan A: Testing Short Positions in Strong Resistance Zone
- Entry: If the price rebounds to the $65,700~$67,300 zone and meets resistance, combined with quantitative model top signals, establish short positions of around 30%.
- Risk Control: Set initial stop-loss.
- Exit: Gradually close positions to take profits when the price adjusts near important support levels, combined with model signals.
- Plan B: Light Long Positions in Strong Support Zone
- Entry: If the price breaks above the $65,700 zone, meets resistance, pulls back, and stabilizes near the strong support of $57,820, showing signs of bottoming, combined with quantitative model bottom signals, establish long positions of around 15%.
- Risk Control: Set initial stop-loss.
- Exit: Gradually close positions to take profits when the price rebounds near important resistance levels, combined with model signals.
III. HYPE Hourly Chart Trend Structure Analysis
HYPE 4-hour Candlestick Chart
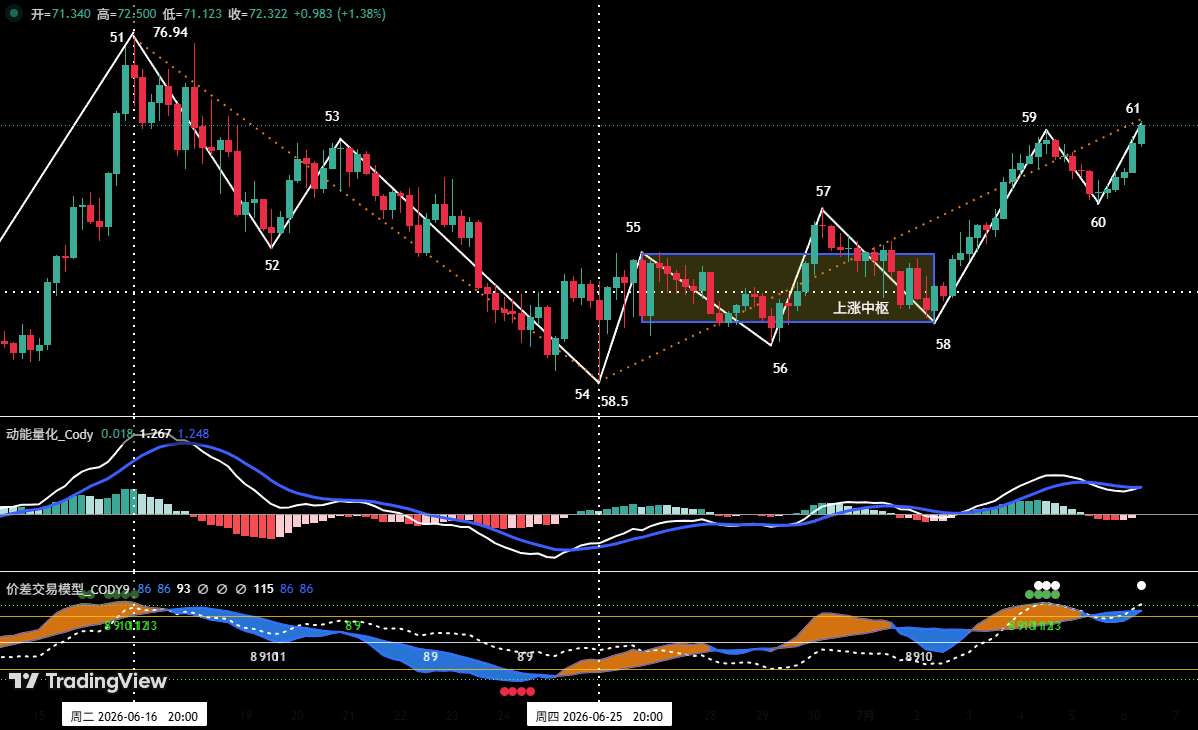
Figure 4
- As shown in Figure 4, last week's review stated: "If 'Point 56' is higher than 'Point 54', it forms a 'Double Bottom' pattern, potentially ending this correction, with a high probability of a rebound starting from 'Point 56'." To date, the market movement closely aligns with the analysis. In last week's actual movement, HYPE price rose from "Point 56" (around $60.55) to "Point 59" (around $72.06), with a maximum gain of approximately 19.01%.
- Analyzing the 4-hour chart, the rebound in HYPE starting from the June 25th low of $58.5 (Point 54) can be subdivided into a seven-wave upward structure on the 4-hour cycle: 54-55, 55-56, 56-57, 57-58, 58-59, 59-60, 60-61.
- The price is currently in the 60-61 upward phase, with the overall upward structure complete. However, the proprietary "Price Difference Trading Model" detected top warning signals at "Point 59" and "Point 61," and the price is approaching the historical high area near $76.94. Therefore, blind chasing of rallies is not advisable at this moment; remain vigilant against short-term correction risks.
IV. HYPE Weekly Market Forecast and Short-Term Trading Strategy
1. HYPE Weekly Market Trend Forecast
Core Resistance Levels
- First Resistance: Around $75~$76.94
- Second Resistance: Around $80
Core Support Levels
- First Support: Around $68
- Second Support: Around $65.5
- Third Support: $60.5~$61.5 area
Core View for the Week: When the price rises to the $75~$76.94 area, observe the battle outcome between bulls and bears over this zone.
2. HYPE Weekly Short-Term Trading Strategy
This week's focus is on closing positions to lock in profits and prevent risks. If long positions were established in the support zone according to the plan, it is recommended to move the stop-loss up to around $68 to protect profits (or decide independently). If the market shows signs of adjustment, close positions promptly to take profits.
V. HYPE Short-Term Operation Review
We strictly followed the operation plan and, based on trading signals from our proprietary "Price Difference Trading Model" and "Momentum Quantitative Model," completed one short-term (long) trade last week, achieving a total trading profit of approximately: 10.23%.
Short-Term Trade 1: (See Table 1)
1. HYPE Short-Term Trade Details Summary:(Leverage*1x)
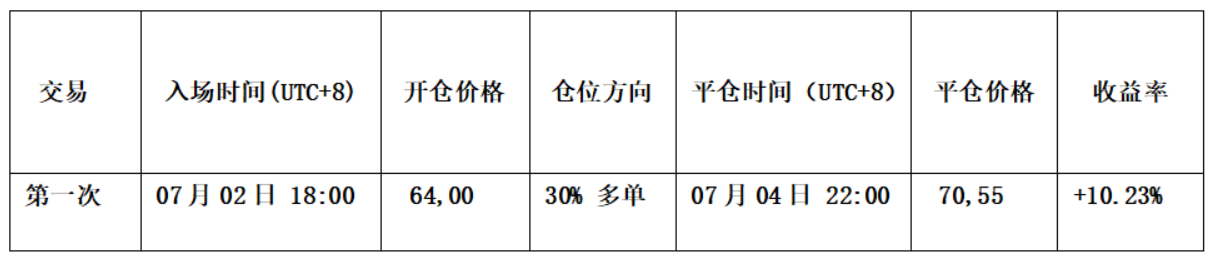
Table 1
2. Short-Term Trade Review:(See Figure 5)
• Entry Strategy:
a. Based on an accurate judgment of the overall upward price trend.
b. When the price effectively broke through the short-term downtrend line, and both the "Price Difference Trading Model" and "Momentum Quantitative Model" simultaneously issued bottom divergence resonance signals.
Therefore, we established a 30% long position at $64.
• Exit Strategy:
a. When the price rose near the $72 resistance and showed signs of stagnation, with the candlesticks forming a "Top Reversal" pattern.
b. The "Price Difference Trading Model" triggered a strong top warning signal (green dot + white dot), forming a top resonance signal with the "Momentum Quantitative Model".
Therefore, we closed all positions around $70.55.
• Summary: This trade successfully yielded a profit of approximately 10.23%.
HYPE_60-minute Candlestick Chart:(Momentum Quantitative Model + Price Difference Trading Model)
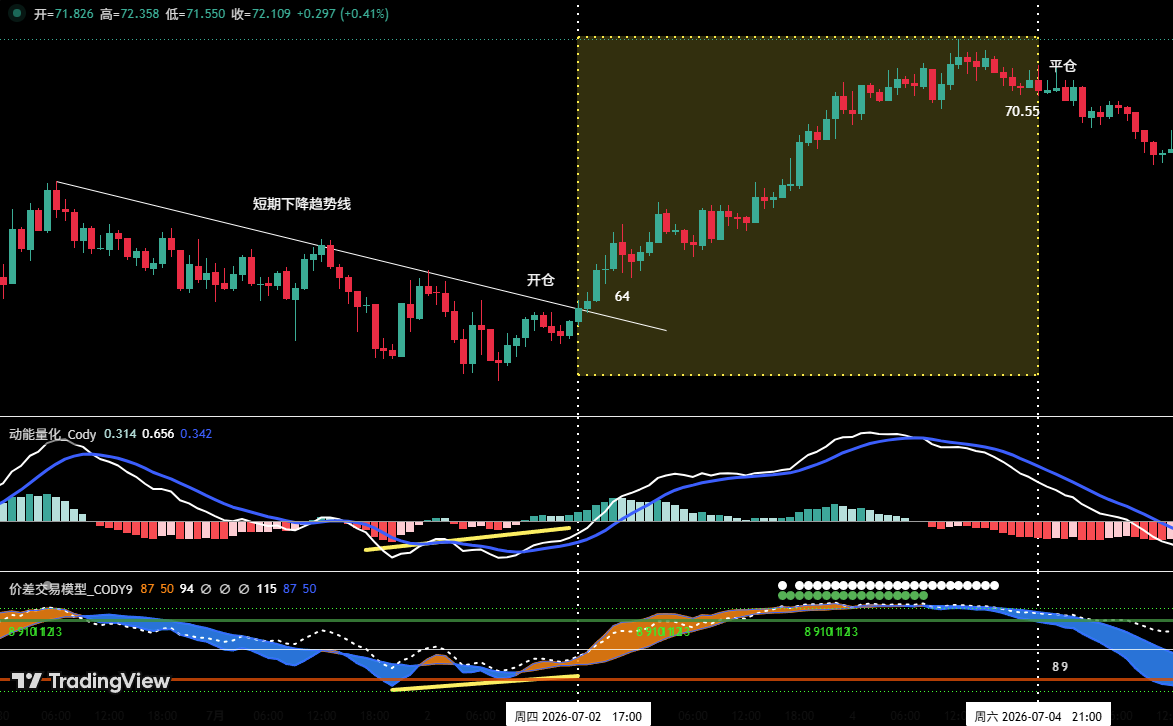
Figure 5 (Short-Term Trade Illustration)
VI. Special Notes
- When opening a position: Immediately set an initial stop-loss.
- When profit reaches 1%: Move the stop-loss to the entry price (break-even point) to ensure capital safety.
- When profit reaches 2%: Move the stop-loss to the 1% profit level.
- Continuous tracking: Thereafter, for every additional 1% profit the price makes, move the stop-loss up by 1% accordingly, dynamically protecting and locking in profits.
Financial markets change rapidly, and all market analysis and trading strategies require dynamic adjustment. All views, analytical models, and operational strategies mentioned in this article are derived from personal technical analysis, intended solely for personal trading log purposes. They do not constitute any investment advice or basis for operation. The market involves risks, investing requires caution. Please do not make decisions based solely on this content.