Stellar’s $0.142 test – Why it may be the buying chance traders await

ambcrypto2026-06-26 tarihinde yayınlandı2026-06-26 tarihinde güncellendi

Özet

Stellar's XLM extended its decline, dropping 7.85% to $0.1514 despite a 10.55% increase in trading volume. This suggests active selling rather than support for a recovery. Key technical indicators point to persistent bearish control. XLM broke a key horizontal support and remains below a descending trendline, with the MACD in a bearish crossover and Parabolic SAR dots above the price. The RSI is at 34.42, nearing oversold territory, and the DMI shows bearish momentum is intact. The analysis indicates XLM is likely to drift toward the next major demand zone at $0.142 before any potential recovery attempt can gain traction.

Stellar [XLM] extended its decline after sellers retained firm control despite a pickup in market activity.

The token traded at around $0.1514 at press time, reflecting a 7.85% daily loss, while trading volume climbed 10.55% to $236.47 million. The combination suggests market participants actively traded into the decline instead of supporting a recovery.

XLM drifted toward its next demand zone

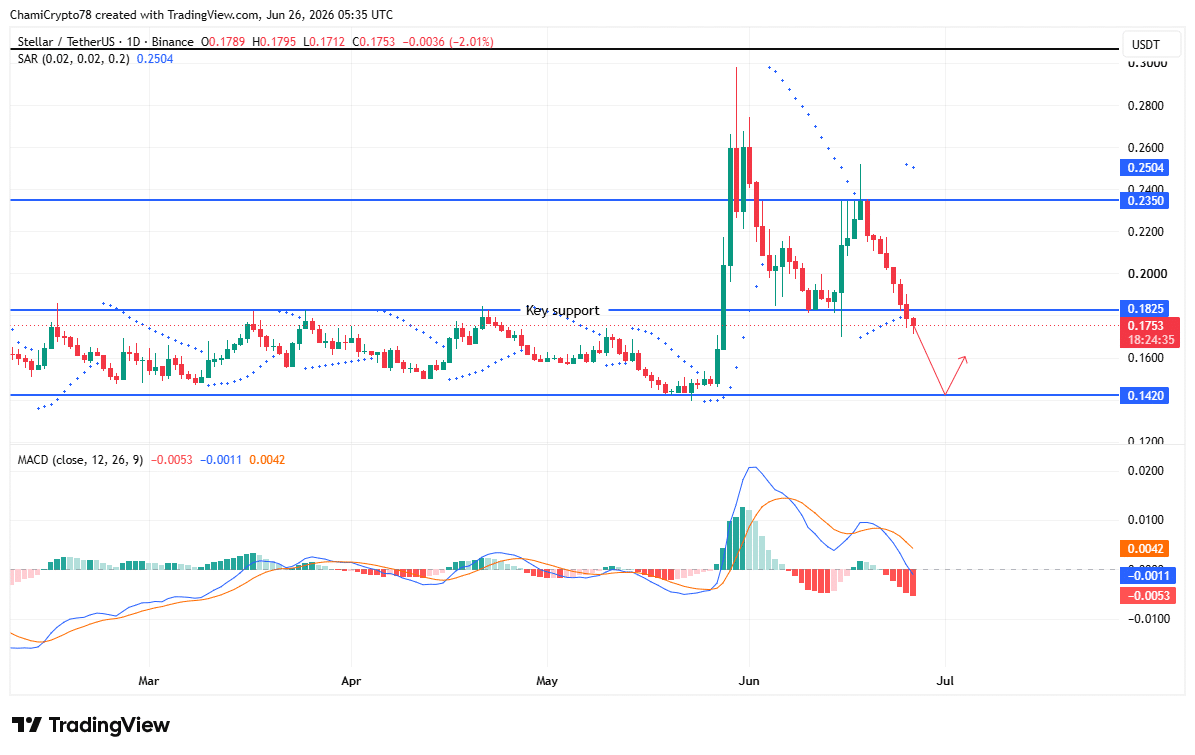
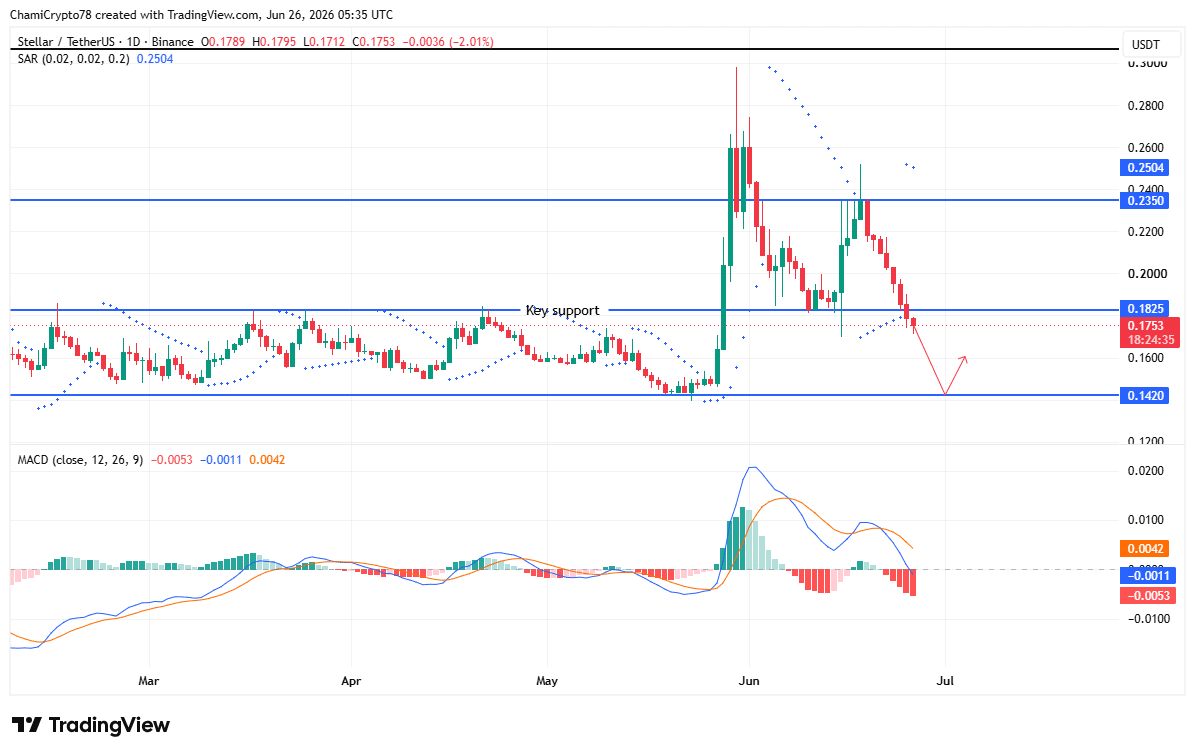
XLM broke below a key horizontal support after failing to preserve its previous trading structure, leaving the $0.142 demand zone as the next major downside objective.

Price remained below the descending trendline, reflecting continued bearish control across the chart.

The MACD maintained a bearish crossover as the histogram stayed below the zero line, showing downside pressure had not eased despite recent consolidation attempts.

In addition, the Parabolic SAR dots continued forming above the candles, reinforcing the existing downtrend instead of signaling a reversal.

Buyers repeatedly attempted to reclaim lost ground, yet every recovery stalled beneath former support, strengthening the bearish structure.

If sellers maintained control, XLM could continue drifting toward $0.142 before any meaningful recovery attempt emerged.
Source: TradingView

Buyers weakened as bears retained control

Momentum indicators continued favoring sellers as XLM approached another important technical test.

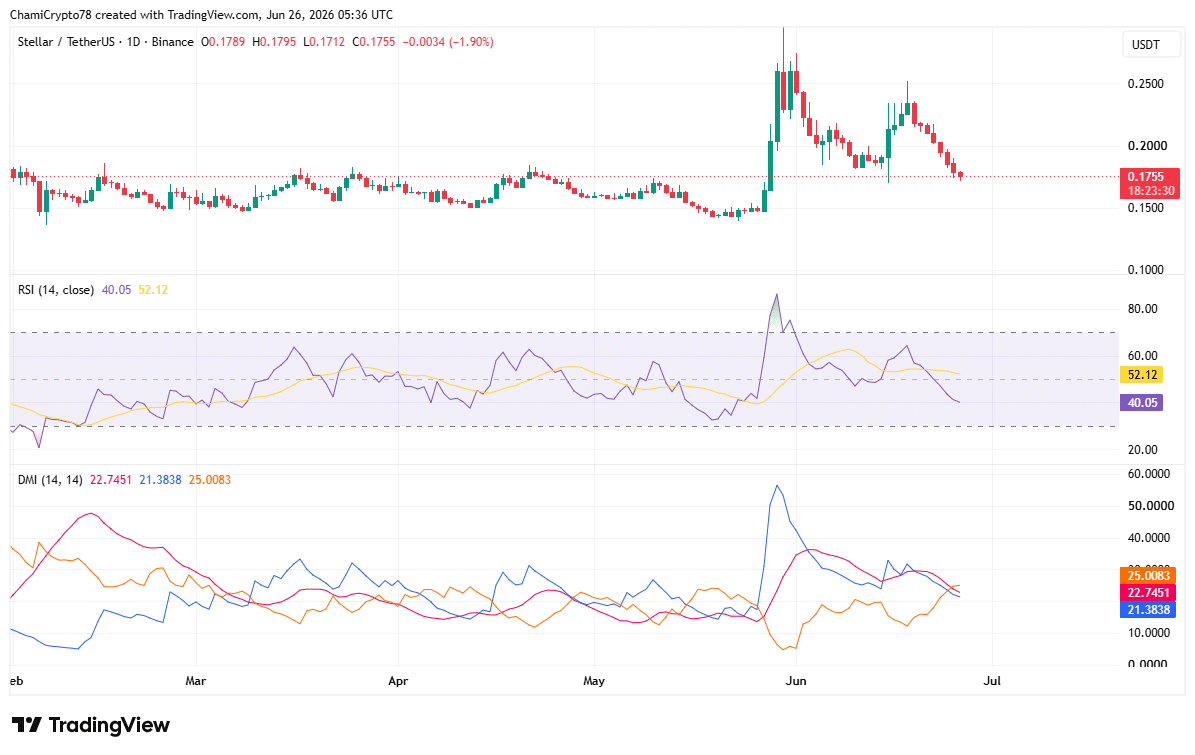
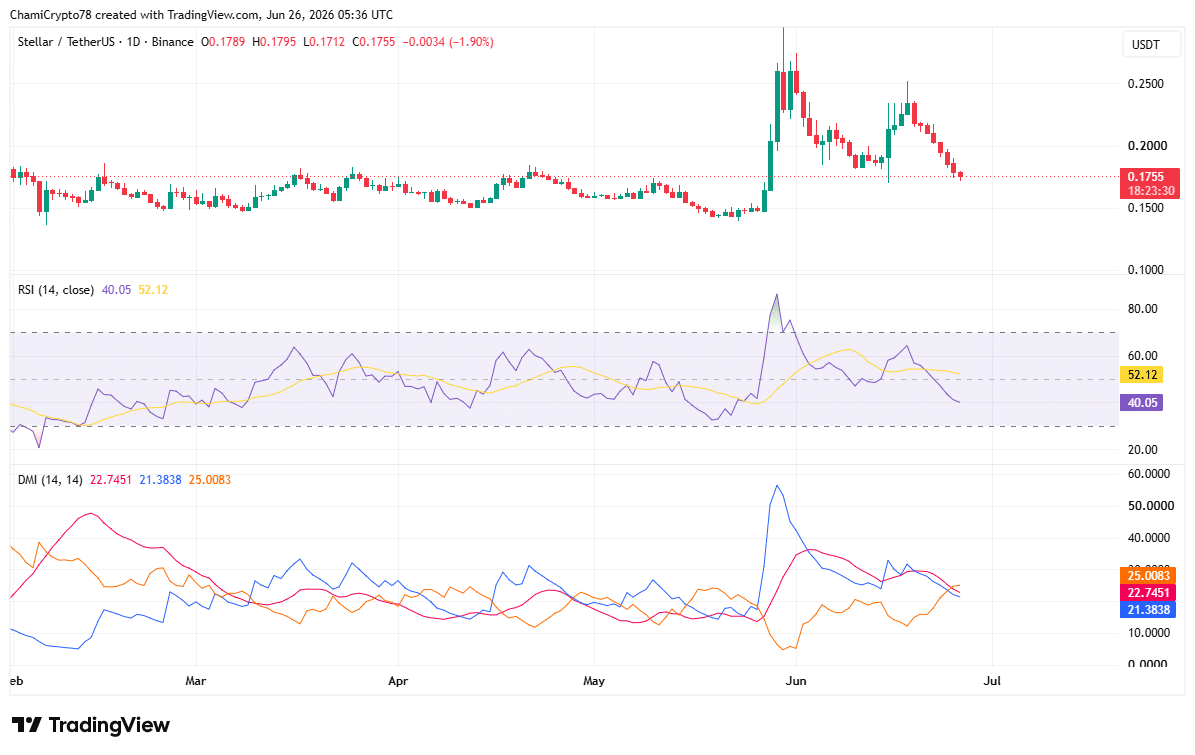
The Relative Strength Index (RSI) fell to 34.42, placing it close to oversold territory after extended selling pressure reduced buying participation.

Although the reading suggested the decline had become increasingly stretched, it had not yet confirmed a reversal signal.

Meanwhile, the Directional Movement Index (DMI) showed -DI at 25 remained well above +DI at 21.38, while the ADX climbed to 22.75.

This combination indicates the prevailing bearish trend retained enough strength to remain intact.

Buyers would likely need to reclaim control of directional movement before sentiment improves. Otherwise, weakening participation could continue supporting another leg lower toward the next demand area.
Source: TradingView

Is XLM headed for the $0.142 demand zone?

Current market conditions favored another decline toward the $0.142 demand zone before buyers could attempt a sustained recovery.

Selling pressure dominated both Spot order flow and price structure, while trend indicators continued supporting the bearish outlook.

However, if buyers successfully defend the demand zone and momentum indicators stabilize, XLM could begin building a recovery from that area. Until those signals emerge, the downside scenario remains the more probable outcome.


Final Summary

  • Rising trading activity failed to slow XLM’s decline as sellers continued controlling the market.
  • XLM could test the $0.142 demand zone before buyers attempt a meaningful recovery.

Trend Kriptolar

İlgili Sorular

QWhat is the current trading price of Stellar (XLM) and its daily percentage change as mentioned in the article?

AThe token traded at around $0.1514 at press time, reflecting a 7.85% daily loss.

QWhat is the next major downside price target for XLM according to the technical analysis?

AThe $0.142 demand zone is identified as the next major downside objective for XLM.

QWhat do key momentum indicators like the MACD and Parabolic SAR suggest about the market trend for XLM?

AThe MACD maintained a bearish crossover and the histogram stayed below the zero line. The Parabolic SAR dots continued forming above the candles, both reinforcing the existing downtrend and indicating continued bearish control.

QWhat does the Relative Strength Index (RSI) reading imply about XLM's current market condition?

AThe RSI fell to 34.42, placing it close to oversold territory, which suggests the decline has become increasingly stretched but has not yet confirmed a reversal signal.

QAccording to the article's conclusion, what is the more probable short-term outcome for XLM's price?

AThe downside scenario, with XLM declining towards the $0.142 demand zone, remains the more probable outcome until buyers show successful defense of that zone and momentum indicators stabilize.

İlgili Okumalar

China Added 67 New Unicorns in Half a Year, with AI and Robotics Accounting for Over Half

China added 67 new unicorn companies in the first half of 2026, reaching a total of 517 unicorns with a combined valuation of approximately $2.39 trillion. This surge marks a significant rebound after a post-2022 slowdown and sets a new semi-annual record. The growth is primarily driven by Artificial Intelligence (AI) and Robotics, which together account for over 53% of the new entrants. Specifically, 19 new unicorns are in robotics and 17 in AI. Notable companies include DeepSeek ($615.38B) and Kling AI ($18B). The trend indicates a decisive shift from internet consumer models to hard tech innovation. Geographically, new unicorns are highly concentrated in four cities: Beijing (19), Shanghai (18), Shenzhen (9), and Hangzhou (5), which together host 76.1% of the new companies. Hangzhou's overall valuation is boosted significantly by DeepSeek. Valuation distribution among new unicorns is pyramidal: 77.6% are valued between $1B and $2B, indicating early-stage status, while only two exceed $10B. There is a notable "speed divide": many AI/robotics startups achieved unicorn status in under three years, often via corporate spin-offs or led by star founders, while hard tech companies in semiconductors or biotech typically took over eight years. The report concludes that this wave reflects China's accelerating transition into an AI and robotics-powered innovation cycle, characterized by faster company formation, heightened geographic concentration, and a clear focus on foundational technologies.

marsbit11 dk önce

China Added 67 New Unicorns in Half a Year, with AI and Robotics Accounting for Over Half

marsbit11 dk önce

İşlemler

Spot

Popüler Makaleler

XLM Nasıl Satın Alınır

HTX.com’a hoş geldiniz! Stellar (XLM) satın alma işlemlerini basit ve kullanışlı bir hâle getirdik. Adım adım açıkladığımız rehberimizi takip ederek kripto yolculuğunuza başlayın. 1. Adım: HTX Hesabınızı OluşturunHTX'te ücretsiz bir hesap açmak için e-posta adresinizi veya telefon numaranızı kullanın. Sorunsuzca kaydolun ve tüm özelliklerin kilidini açın. Hesabımı Aç2. Adım: Kripto Satın Al Bölümüne Gidin ve Ödeme Yönteminizi SeçinKredi/Banka Kartı: Visa veya Mastercard'ınızı kullanarak anında Stellar (XLM) satın alın.Bakiye: Sorunsuz bir şekilde işlem yapmak için HTX hesap bakiyenizdeki fonları kullanın.Üçüncü Taraflar: Kullanımı kolaylaştırmak için Google Pay ve Apple Pay gibi popüler ödeme yöntemlerini ekledik.P2P: HTX'teki diğer kullanıcılarla doğrudan işlem yapın.Borsa Dışı (OTC): Yatırımcılar için kişiye özel hizmetler ve rekabetçi döviz kurları sunuyoruz.3. Adım: Stellar (XLM) Varlıklarınızı SaklayınStellar (XLM) satın aldıktan sonra HTX hesabınızda saklayın. Alternatif olarak, blok zinciri transferi yoluyla başka bir yere gönderebilir veya diğer kripto para birimlerini takas etmek için kullanabilirsiniz.4. Adım: Stellar (XLM) Varlıklarınızla İşlem YapınHTX'in spot piyasasında Stellar (XLM) ile kolayca işlemler yapın.Hesabınıza erişin, işlem çiftinizi seçin, işlemlerinizi gerçekleştirin ve gerçek zamanlı olarak izleyin. Hem yeni başlayanlar hem de deneyimli yatırımcılar için kullanıcı dostu bir deneyim sunuyoruz.

352 Toplam GörüntülenmeYayınlanma 2024.12.13Güncellenme 2026.06.02

XLM Nasıl Satın Alınır

Tartışmalar

HTX Topluluğuna hoş geldiniz. Burada, en son platform gelişmeleri hakkında bilgi sahibi olabilir ve profesyonel piyasa görüşlerine erişebilirsiniz. Kullanıcıların XLM (XLM) fiyatı hakkındaki görüşleri aşağıda sunulmaktadır.

活动图片