Por qué FLOKI está subiendo a pesar de una caída anual del 72%

ambcrypto2026-01-05 tarihinde yayınlandı2026-01-05 tarihinde güncellendi

Özet

FLOKI ha experimentado una subida del 18% en las últimas 24 horas, rompiendo una línea de resistencia descendente que mantenía al memecoin en una tendencia bajista desde octubre de 2025. Este impulso, respaldado por un volumen de trading de 147,7 millones de dólares, podría llevar al precio a revisitar el máximo de 0.00008930 registrado en octubre. Indicadores técnicos como el Parabolic SAR (con puntos por debajo del precio) y el Money Flow Index (por encima de 50) sugieren condiciones favorables para una continuación alcista, con entradas de capital sostenidas. Sin embargo, el indicador de Acumulación/Distribución (A/D), aunque en aumento, permanece en territorio negativo, lo que indica que la presión de venta aún persiste y podría limitar las ganancias. En resumen, si bien el momentum actual es alcista y hay señales de recuperación, la presencia de vendedores activos sugiere que el avance podría enfrentar resistencia en niveles superiores.

FLOKI ha subido durante el último día a pesar de un año turbulento que vio al memecoin caer casi un 72%.

Al momento de escribir, el memecoin había subido un 18%, un movimiento que puede insinuar un renovado interés de los inversores en el mercado.

Sin embargo, persisten dudas sobre si este interés en FLOKI [FLOKI] es sostenible. Desde una perspectiva técnica, AMBCrypto examina el gráfico para proporcionar claridad.

FLOKI rompe una cadena bajista

El reciente repunte siguió a una ruptura de una línea de resistencia descendente que había mantenido el precio en una caída sostenida durante todo un trimestre, entre octubre y diciembre de 2025, mientras se intensificaba la presión de venta.

Esta vez, el impulso en el tercer intento de ruptura demostró ser lo suficientemente fuerte como para impulsar a FLOKI al alza, con un volumen de negociación que subió a 147,7 millones de dólares.

Si este impulso se mantiene, la ruptura podría permitir que el memecoin vuelva a visitar el máximo de 0,00008930 dólares en el gráfico, lo que ocurrió por última vez el 11 de octubre.

Las zonas marcadas en azul resaltan áreas donde FLOKI podría enfrentar presión de venta a medida que el precio se mueve hacia el objetivo, que se alineó con el pico de la anterior resistencia descendente.

Esto plantea una pregunta clave: ¿puede el impulso sostener un movimiento hacia ese nivel? Los indicadores ofrecen algunas señales alentadoras.

Posible resultado alcista

El indicador Parabólico Stop and Reverse (SAR) sugirió que las condiciones de rally siguen siendo favorables.

Esta señal provino de los puntos SAR formándose por debajo del precio. Cuando los puntos aparecen debajo de la acción del precio, normalmente apunta a una mayor probabilidad de movimiento continuado en esa dirección.

Históricamente, esta tendencia se desarrolla cuando los puntos SAR se rastrean por debajo del precio durante los rallies, mientras que los puntos por encima del precio tienden a reforzar las condiciones bajistas.

Mientras tanto, el Índice de Flujo de Dinero (MFI) continuó subiendo, con lecturas manteniéndose por encima de la marca de 50 en territorio alcista. Esto sugirió entradas de capital más fuertes en FLOKI.

Las entradas sostenidas apoyarían el caso alcista, aumentando la probabilidad de un impulso hacia la zona objetivo previamente identificada en el gráfico.

Una nota de precaución

A pesar del tono generalmente alcista y los indicadores orientados al alza, el indicador de Acumulación/Distribución (A/D) presentó una imagen más matizada.

El indicador A/D mide la presión de compra y venta rastreando si la actividad del mercado está dominada por la acumulación o la distribución.

Al cierre de esta edición, la línea A/D tendía al alza, lo que indica que la compra ha superado a la venta durante el último día. Sin embargo, se mantuvo en territorio negativo, señalando que el sentimiento más amplio aún se inclina a la baja.

Esto sugirió que, si bien las condiciones a corto plazo parecen constructivas, los vendedores siguen activos y podrían recuperar el control, manteniendo potencialmente a FLOKI limitado a niveles más bajos.


Reflexiones finales

  • La ruptura de FLOKI marcó un cambio significativo después de meses de presión sostenida a la baja.
  • Si bien el impulso y las entradas de capital apoyaron más subidas, la distribución persistente sugirió que los compradores aún pueden enfrentar resistencia.


Trend Kriptolar

İlgili Sorular

Q¿Por qué ha subido FLOKI a pesar de una caída anual del 72%?

AFLOKI ha experimentado un repunte reciente debido a un aumento del interés de los inversores y a la rotura de una línea de resistencia descendente que había mantenido el precio a la baja durante todo un trimestre.

Q¿Qué indicador sugiere que las condiciones de la subida siguen siendo favorables para FLOKI?

AEl indicador Parabólico Stop and Reverse (SAR) sugiere que las condiciones de la subida son favorables, ya que sus puntos se forman por debajo del precio, lo que normalmente indica una mayor probabilidad de que el movimiento alcista continúe.

Q¿Qué nivel anterior en el gráfico podría FLOKI intentar alcanzar si se mantiene el impulso actual?

ASi el impulso actual se mantiene, FLOKI podría intentar alcanzar el máximo anterior de 0.00008930, que se registró por última vez el 11 de octubre.

Q¿Qué señal mixta presenta el indicador de Acumulación/Distribución (A/D) para FLOKI?

AAunque la línea A/D tiene una tendencia alcista, lo que indica que la compra ha superado a la venta en el último día, se mantiene en territorio negativo, lo que señala que la sentimiento general del mercado aún es bajista.

Q¿Qué sugiere el Índice de Flujo de Dinero (MFI) sobre los flujos de capital hacia FLOKI?

AEl Índice de Flujo de Dinero (MFI) continúa subiendo y se mantiene por encima de la marca de 50, en territorio alcista, lo que sugiere que hay entradas de capital más fuertes en FLOKI.

İlgili Okumalar

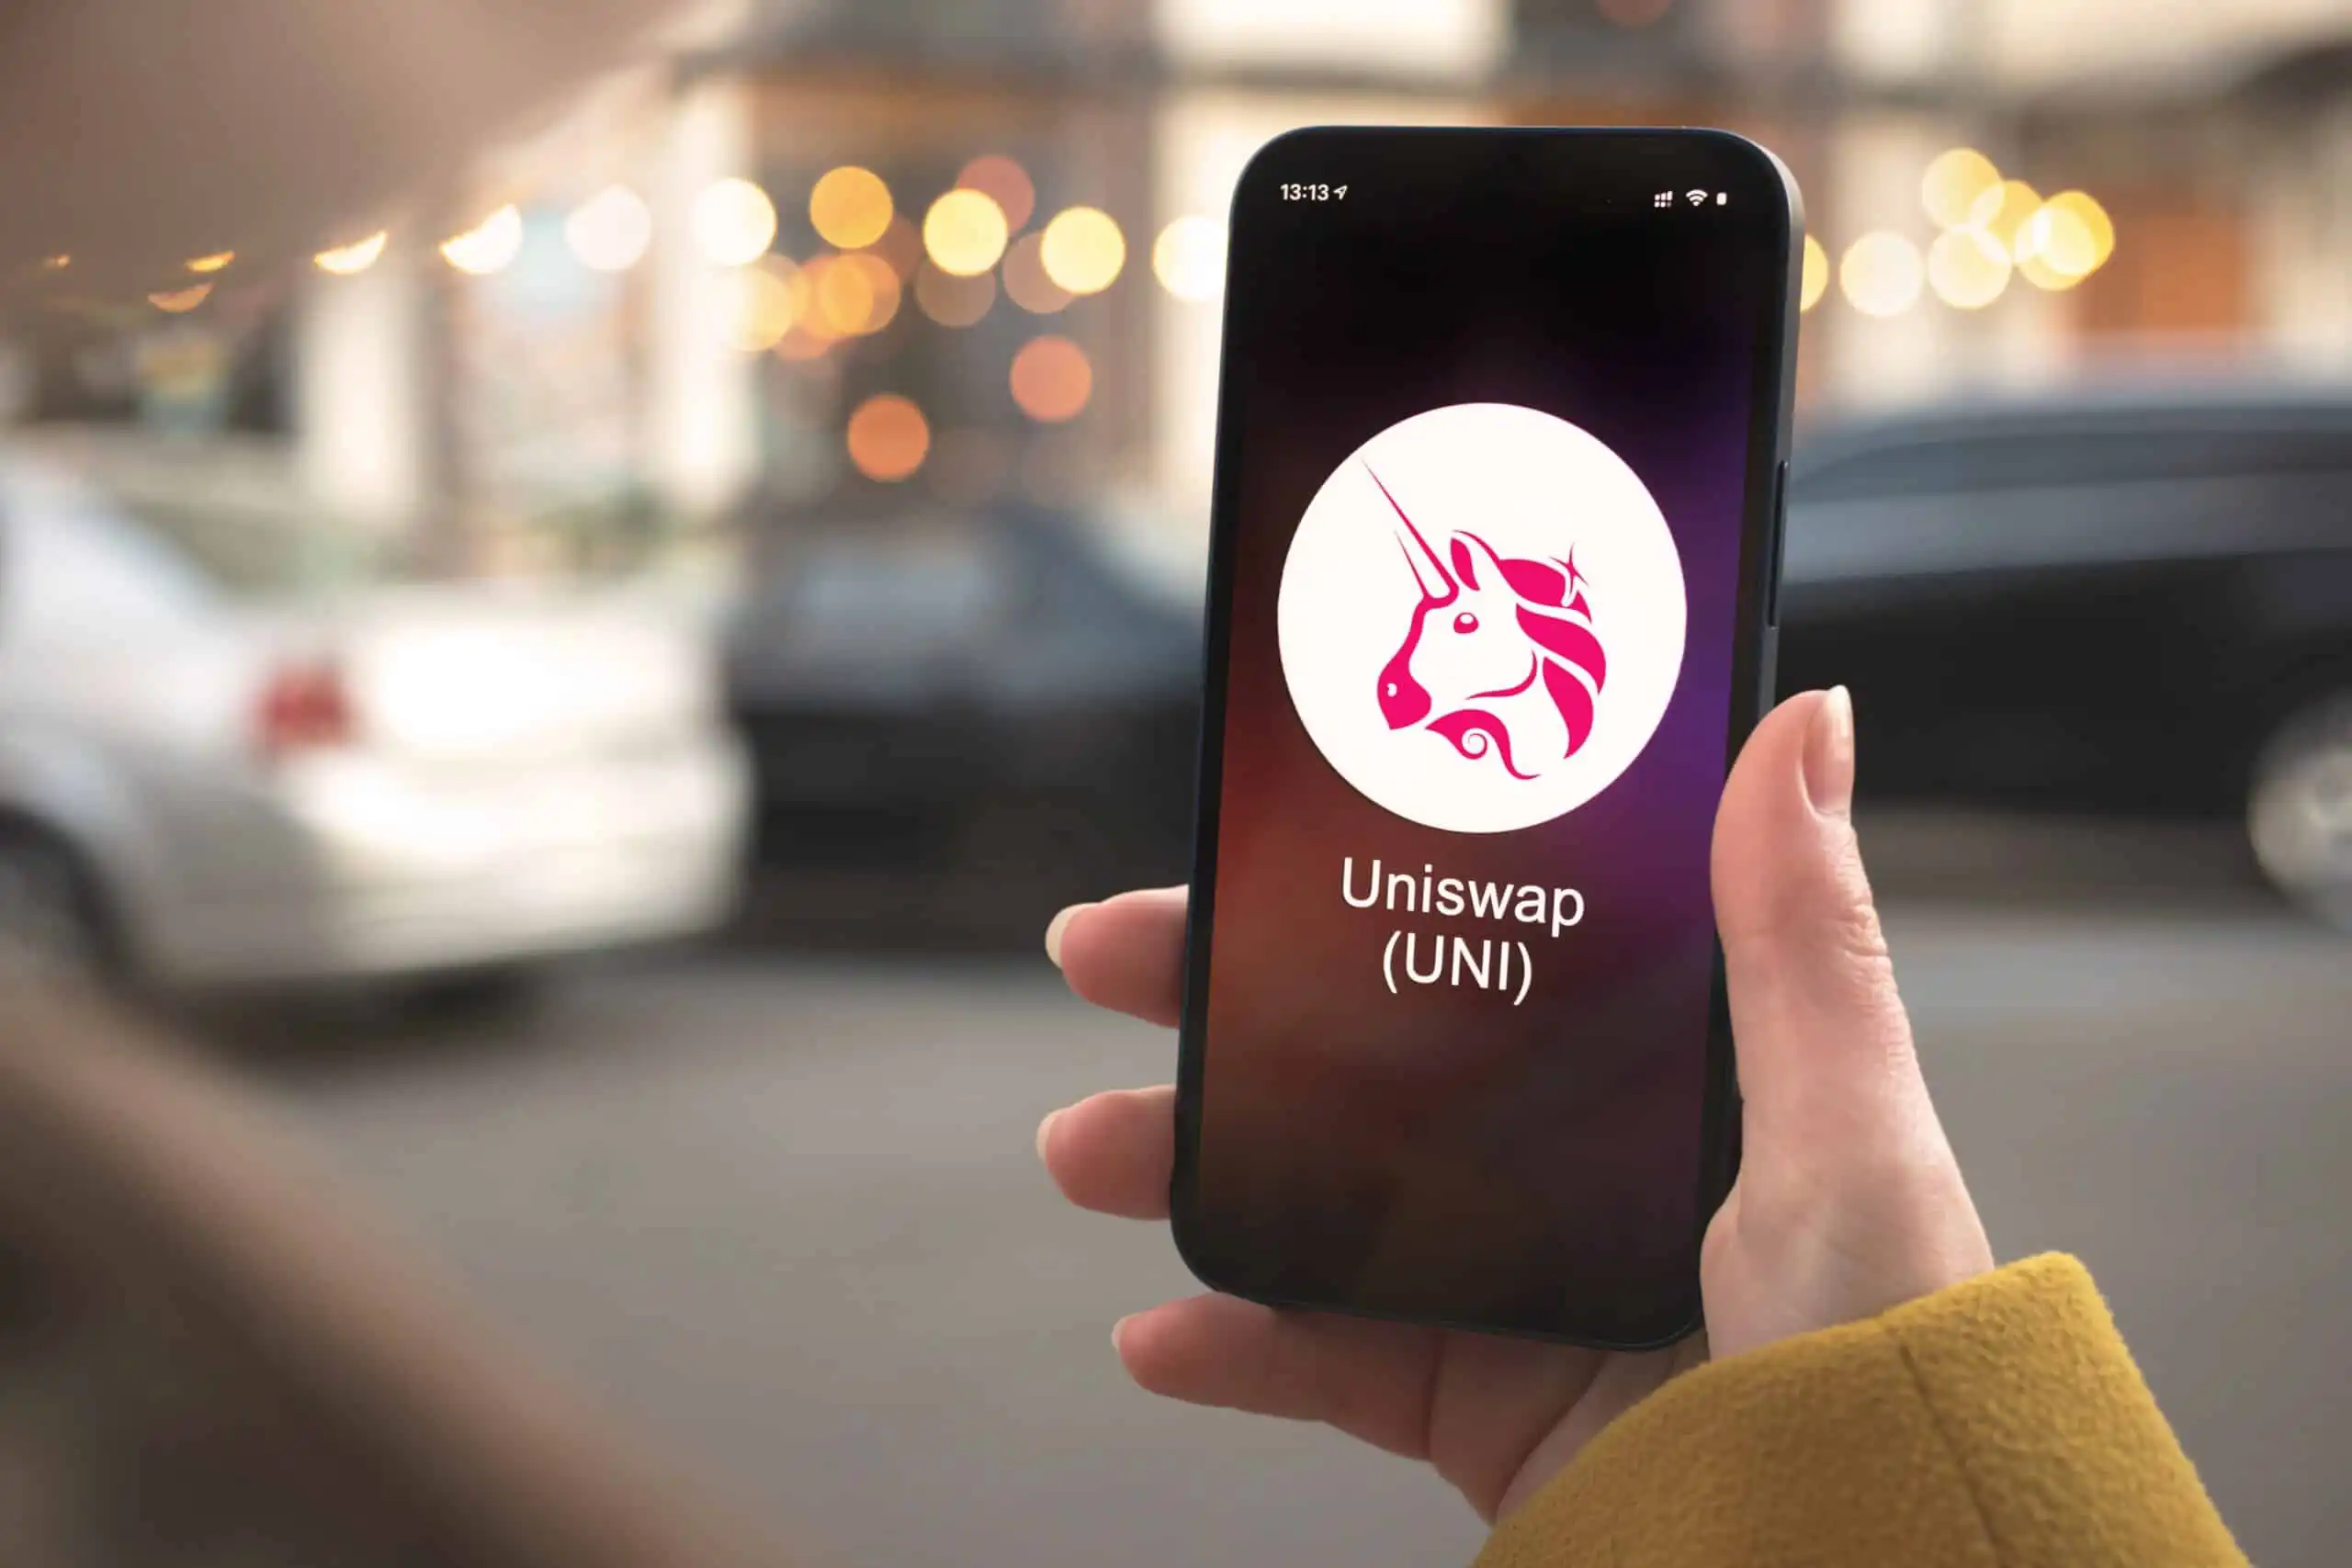
UNI Doubles in Two Months Against the Trend: A 5-Year-Overdue Value Realization

Amidst a generally stagnant crypto market in June and July, UNI, the governance token of Uniswap, saw a significant surge, nearly doubling in price from around $2.3 to $4.6. This rally represents a delayed but significant value reassessment, triggered by the practical implementation of its long-debated "fee switch" mechanism. The key turning point was the on-chain execution of the UNIfication proposal in December 2025. It activated a protocol fee on select pools, directed Unichain sequencer revenue (net of costs) to a communal treasury, executed a one-time burn of 100 million UNI, and established a system where all protocol revenue flows into a "TokenJar" contract. This treasury has a single exit: purchasing and permanently burning UNI via a "Firepit" contract. Initially, the market reacted tepidly as the generated revenue and corresponding burn rate were modest. The narrative shifted dramatically in July 2025 with two major developments. First, the launch of Robinhood Chain, tailored for tokenized stocks, rapidly became a primary source of volume and fees for Uniswap, at one point contributing nearly half of its weekly fees. Second, governance votes successfully expanded the fee mechanism to v4 pools and initiated a temperature check for fees on Robinhood Chain. The activation of v4 fees caused the protocol's daily revenue earmarked for UNI burns to nearly triple. The core of UNI's recent price action is the transition from a pure governance token to a cash-flow asset with a permanent, protocol-funded buyer. Its effectiveness is amplified by UNI's mature and widely distributed supply, with no major impending unlocks to dilute the impact of the buybacks. The sustainability of this rally now hinges on whether the transaction volume, particularly on Robinhood Chain, persists after its initial gas subsidies expire, determining if this is a genuine value realization or a subsidy-fueled spike.

marsbit52 dk önce

UNI Doubles in Two Months Against the Trend: A 5-Year-Overdue Value Realization

marsbit52 dk önce

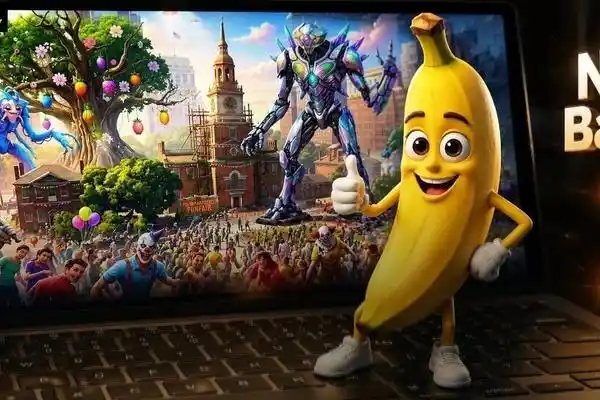
Breaking: Google Earth Urgently Pulls Back Nano Banana 2 Image Generation Feature!

Google Earth's newly launched "Create image" feature, powered by the Nano Banana 2 AI image generation model, was abruptly withdrawn shortly after its release due to being "played" by users. The feature allowed users to generate and overlay AI-created visuals directly onto real-world satellite and 3D maps in Google Earth. The tool enabled creative applications like historical recreations (e.g., visualizing ancient Pompeii), generating informational graphics for landmarks, and envisioning architectural projects or futuristic cityscapes on real terrain. It operated under "geospatial grounding," meaning the AI respected the underlying geography, topography, and perspective of the chosen map view. The model also integrated with Gemini to retrieve relevant factual information. However, upon release, users quickly tested its limits. A prominent example involved reimagining Philadelphia's historic Independence Hall as a post-apocalyptic ruin overrun by "happy" zombies, evil clowns, and giant alien mechs. This highlighted both the feature's playful potential and its risks regarding the generation of inappropriate or misleading content on realistic maps, leading to its swift temporary removal. Google stated it would re-release the feature after implementing "enhanced guardrails." Analysts note this move strategically leverages Google's vast proprietary geospatial data, positioning its AI not just for artistic generation but for spatially accurate world visualization—a unique advantage in the competitive AI image generation landscape.

marsbit2 saat önce

Breaking: Google Earth Urgently Pulls Back Nano Banana 2 Image Generation Feature!

marsbit2 saat önce

Altman Admits: Overestimated AI Snatching Jobs! Huang Renxun: The Unemployment Narrative Is Completely Backwards

Sam Altman has revised his earlier predictions about AI rapidly replacing jobs, admitting he overestimated the speed at which AI would eliminate entry-level white-collar roles. Speaking on the "Invest Like the Best" podcast, he stated that people do not truly want an AI CEO, as accountability and human connection remain critical. He found that individuals prefer interacting with people who can be held responsible for decisions. Similarly, NVIDIA's Jensen Huang argued that the narrative of AI destroying jobs is misguided. He distinguishes between tasks and jobs, noting that while AI can automate specific tasks, entire jobs—encompassing communication, judgment, coordination, and accountability—are not eliminated. He cited examples like radiologists and software engineers, where demand for these roles has increased as AI handles repetitive tasks, allowing for business expansion and the creation of more positions. Data from a University of Maryland and LinkUp study supports this, showing that U.S. job postings for new graduates have actually risen, countering the fear of vanishing entry-level roles. However, a significant shift is occurring: the traditional entry-level tasks that help newcomers gain experience are being automated, making initial career access more challenging. The key insight is that as AI takes over standardized tasks, the enduring value of human work shifts toward areas of responsibility, trust-building, and final decision-making—aspects that AI cannot replicate. The real "moat" for professionals lies in these irreplaceable human elements.

marsbit2 saat önce

Altman Admits: Overestimated AI Snatching Jobs! Huang Renxun: The Unemployment Narrative Is Completely Backwards

marsbit2 saat önce

İşlemler

Spot

Popüler Makaleler

O Nasıl Satın Alınır

HTX.com’a hoş geldiniz! O1 exchange (O) satın alma işlemlerini basit ve kullanışlı bir hâle getirdik. Adım adım açıkladığımız rehberimizi takip ederek kripto yolculuğunuza başlayın. 1. Adım: HTX Hesabınızı OluşturunHTX'te ücretsiz bir hesap açmak için e-posta adresinizi veya telefon numaranızı kullanın. Sorunsuzca kaydolun ve tüm özelliklerin kilidini açın. Hesabımı Aç2. Adım: Kripto Satın Al Bölümüne Gidin ve Ödeme Yönteminizi SeçinKredi/Banka Kartı: Visa veya Mastercard'ınızı kullanarak anında O1 exchange (O) satın alın.Bakiye: Sorunsuz bir şekilde işlem yapmak için HTX hesap bakiyenizdeki fonları kullanın.Üçüncü Taraflar: Kullanımı kolaylaştırmak için Google Pay ve Apple Pay gibi popüler ödeme yöntemlerini ekledik.P2P: HTX'teki diğer kullanıcılarla doğrudan işlem yapın.Borsa Dışı (OTC): Yatırımcılar için kişiye özel hizmetler ve rekabetçi döviz kurları sunuyoruz.3. Adım: O1 exchange (O) Varlıklarınızı SaklayınO1 exchange (O) satın aldıktan sonra HTX hesabınızda saklayın. Alternatif olarak, blok zinciri transferi yoluyla başka bir yere gönderebilir veya diğer kripto para birimlerini takas etmek için kullanabilirsiniz.4. Adım: O1 exchange (O) Varlıklarınızla İşlem YapınHTX'in spot piyasasında O1 exchange (O) ile kolayca işlemler yapın.Hesabınıza erişin, işlem çiftinizi seçin, işlemlerinizi gerçekleştirin ve gerçek zamanlı olarak izleyin. Hem yeni başlayanlar hem de deneyimli yatırımcılar için kullanıcı dostu bir deneyim sunuyoruz.

382 Toplam GörüntülenmeYayınlanma 2026.06.19Güncellenme 2026.06.29

O Nasıl Satın Alınır

PROS Nasıl Satın Alınır

HTX.com’a hoş geldiniz! Pharos (PROS) satın alma işlemlerini basit ve kullanışlı bir hâle getirdik. Adım adım açıkladığımız rehberimizi takip ederek kripto yolculuğunuza başlayın. 1. Adım: HTX Hesabınızı OluşturunHTX'te ücretsiz bir hesap açmak için e-posta adresinizi veya telefon numaranızı kullanın. Sorunsuzca kaydolun ve tüm özelliklerin kilidini açın. Hesabımı Aç2. Adım: Kripto Satın Al Bölümüne Gidin ve Ödeme Yönteminizi SeçinKredi/Banka Kartı: Visa veya Mastercard'ınızı kullanarak anında Pharos (PROS) satın alın.Bakiye: Sorunsuz bir şekilde işlem yapmak için HTX hesap bakiyenizdeki fonları kullanın.Üçüncü Taraflar: Kullanımı kolaylaştırmak için Google Pay ve Apple Pay gibi popüler ödeme yöntemlerini ekledik.P2P: HTX'teki diğer kullanıcılarla doğrudan işlem yapın.Borsa Dışı (OTC): Yatırımcılar için kişiye özel hizmetler ve rekabetçi döviz kurları sunuyoruz.3. Adım: Pharos (PROS) Varlıklarınızı SaklayınPharos (PROS) satın aldıktan sonra HTX hesabınızda saklayın. Alternatif olarak, blok zinciri transferi yoluyla başka bir yere gönderebilir veya diğer kripto para birimlerini takas etmek için kullanabilirsiniz.4. Adım: Pharos (PROS) Varlıklarınızla İşlem YapınHTX'in spot piyasasında Pharos (PROS) ile kolayca işlemler yapın.Hesabınıza erişin, işlem çiftinizi seçin, işlemlerinizi gerçekleştirin ve gerçek zamanlı olarak izleyin. Hem yeni başlayanlar hem de deneyimli yatırımcılar için kullanıcı dostu bir deneyim sunuyoruz.

354 Toplam GörüntülenmeYayınlanma 2026.06.22Güncellenme 2026.06.29

PROS Nasıl Satın Alınır

VERONA Nedir

I. Proje Tanıtımı VERONA, zincir soyutlaması aracılığıyla herkes için, her yerde inşa edilmiş bir blok zinciridir. Genel Soyutlama katmanını kullanarak, VERONA, hesaplar, imzalar ve birlikte çalışabilirlik gibi karmaşık blok zinciri işlevlerini doğrudan protokol seviyesinde entegre ederek kendini ayırt eder. Bu yaklaşım, temel teknolojileri anlamaya gerek kalmadan blok zinciri uygulamalarıyla etkileşimde bulunmayı sağlar.1) Temel Bilgiler İsim: VERONA (VERONA)III. İlgili Bağlantılar Resmi web sitesi bağlantısı: https://xion.burnt.com/ Whitepaper: https://xion.burnt.com/whitepaper.pdf Keşif Araçları: https://explorer.burnt.com/ Sosyal Medya: https://x.com/burnt_xion Not: Proje tanıtımı, resmi proje ekibi tarafından yayımlanan veya sağlanan materyallerden alınmıştır, yalnızca referans içindir ve yatırım tavsiyesi teşkil etmez. HTX, ortaya çıkan doğrudan veya dolaylı kayıplardan sorumluluk kabul etmez.

332 Toplam GörüntülenmeYayınlanma 2026.06.22Güncellenme 2026.06.22

VERONA Nedir

Tartışmalar

HTX Topluluğuna hoş geldiniz. Burada, en son platform gelişmeleri hakkında bilgi sahibi olabilir ve profesyonel piyasa görüşlerine erişebilirsiniz. Kullanıcıların A (A) fiyatı hakkındaki görüşleri aşağıda sunulmaktadır.

活动图片