MM en Auge 1: Sistema de Cotización de Inventario del Market Maker

marsbit2025-12-28 tarihinde yayınlandı2025-12-28 tarihinde güncellendi

Özet

**Resumen: El modelo de Avellaneda-Stoikov y la gestión de inventario de los market makers** ¿Alguna vez has notado que, tras comprar una altcoin, su precio suele moverse en tu contra? Esto no es una manipulación deliberada, sino el resultado de los sistemas de cotización de los market makers (MM) basados en inventarios. Los MM no son inversores direccionales; gestionan riesgos mediante coberturas. Cuando compras grandes cantidades, el MM vende y su inventario se vuelve corto (short inventory). Para protegerse: 1. **Sesgo de cotización (Quote Skew)**: El MM baja los precios para atraer vendedores y reponer inventario. 2. **Ampliación del spread (Spread Widening)**: Si el inventario empeora, el MM amplía el spread para reducir el riesgo de ejecución y compensar pérdidas. El precio de reserva (Reservation Price) se calcula como: **Precio de reserva = Precio medio − γ · q** Donde `q` es el inventario actual y `γ` es el coeficiente de aversión al riesgo. Los traders minoristas suelen ser afectados porque: - Ejecutan órdenes agresivas y concentradas. - No se cubren ni fragmentan órdenes. - En criptomonedas con baja liquidez, su volumen impacta directamente el riesgo del MM. **Consejo práctico**: Para minimizar el impacto, divide tus órdenes. Si quieres comprar 1000 USD, compra gradualmente (ej. 100 USD por vez). El ajuste de precios del MM te permitirá obtener mejores precios. Próximamente: - Parte 2: El libro de órdenes y el flujo tóxico (toxic f...

Autor: Dave

¿Alguna vez has experimentado una situación en la que, después de comprar algunas altcoins, el precio se mueve en la dirección opuesta en poco tiempo, como si los grandes jugadores te estuvieran atacando? ¿Por qué sucede esto? ¿Es realmente una conspiración de los grandes jugadores?

Este post te introducirá al sistema de cotización de los market makers, desvelando el misterio detrás de la "conspiración de los grandes jugadores". La conclusión es: que el precio a menudo se mueve en contra de nosotros no es una manipulación subjetiva, sino un sesgo de cotización basado en inventario (Quote Skew) bajo el modelo de Avellaneda-Stoikov, y un mecanismo de protección para manejar el flujo tóxico de órdenes (Toxic Flow). ¿Cómo funciona exactamente? Érase una vez...

Primero, entendamos el concepto de inventario. Todos saben que los market makers no son inversores direccionales; bajo una cobertura rigurosa, los cambios en el precio del spot no deberían afectar el P&L total. En este caso, mantener inventario es un comportamiento "pasivo". Los cambios en el inventario amplían la posición, y cuanto más grande sea la posición, mayor será la exposición al riesgo de movimientos adversos del precio. En este momento, las órdenes de compra y venta de los minoristas causan cambios en el inventario, y los market makers reaccionan a los riesgos asociados con estos cambios.

En pocas palabras, rompiste su equilibrio, y el market maker debe protegerse y esforzarse por volver al equilibrio. El medio para protegerse es el sistema de cotización.

1. Sesgo de Cotización (Quote Skew)

Cuando el market maker vende grandes cantidades debido a tus compras, equivalente a: el market maker vende en grandes volúmenes, y el inventario se convierte en una exposición corta. En este momento, ¿qué espera hacer el market maker?: (1) Reponer el inventario lo antes posible. (2) Proteger la posición corta expuesta.

Entonces, la reacción del market maker es: bajar el precio para atraer vendedores, evitar más compras y, al mismo tiempo, asegurar que su posición neta corta permanezca temporalmente sin pérdidas, dándole tiempo para cubrirse.

2. Ampliación del Spread (Spread Widening)

Cuando el inventario continúa deteriorándose, el market maker no solo ajusta el precio, sino que también amplía el spread, reduciendo la probabilidad de ejecución.

Su objetivo es reducir el riesgo de ejecución por unidad de tiempo y, al mismo tiempo, obtener más ganancias a través del spread para protegerse de las pérdidas de precio.

Al escribir un artículo, cada fórmula matemática adicional reduce un 10% de los lectores, pero por si acaso a algunos de ustedes les interesa ver algo más técnico, les daré una breve introducción sobre cómo se forma la cotización (también el mecanismo matemático detrás de los cambios de cotización mencionados).

El precio al que negociamos con el market maker se llama Precio de Reserva (Reservation Price), que proviene del modelo de fijación de precios basado en inventario:

Precio de Reserva = Precio Medio − γ⋅q

q: Inventario actual

gamma γ: Coeficiente de aversión al riesgo

En realidad, el Precio de Reserva se ve así, pero no quiero aburrirlos, así que solo les daré un vistazo:

Cuando los minoristas compran o venden en grandes volúmenes, q experimenta cambios significativos, lo que hace que el Precio de Reserva cambie considerablemente. La magnitud del cambio proviene del modelo de Avellaneda-Stoikov. Pueden adivinar que, dado que las compras y ventas causan pequeños cambios en el inventario, este modelo es una ecuación diferencial parcial. ¿Y adivinen qué? Tampoco tengo interés en derivar esta ecuación, así que solo necesitamos conocer la conclusión central:

La cotización óptima se despliega simétricamente alrededor del Precio de Reserva. El inventario inevitablemente revierte a su media hacia cero. El spread óptimo se amplía con el riesgo.

Si no entienden lo anterior, no importa. Solo necesitan comprender que, después de que los minoristas compran, el precio a menudo se mueve en contra de la tendencia alcista, esencialmente porque nuestro flujo cambia la fijación de precios de riesgo del mercado. Las razones por las que los minoristas a menudo enfrentan esta situación son:

• Los minoristas casi siempre son órdenes activas.

• Tamaño concentrado, ritmo no discreto.

• Sin cobertura.

• Sin timing, sin dividir órdenes.

En las altcoins pequeñas, esta situación es aún más grave porque la liquidez de las altcoins es muy baja. A menudo, tu orden es una de las pocas órdenes activas en un período de 5 minutos. En los mercados grandes, puede haber una cobertura natural, pero en las monedas pequeñas, tú eres la contraparte de los grandes jugadores.

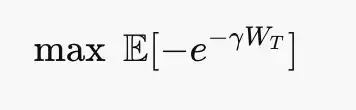
Por lo tanto, los market makers profesionales no intentan liquidarte, sino maximizar E[Captura del Spread] − Riesgo de Inventario − Selección Adversa. De hecho, su función objetivo se ve así, donde el riesgo de inventario es penalizado exponencialmente:
Los lectores que hayan llegado hasta aquí deben ser espárragos con sueños de convertirse en grandes jugadores. Así que, para motivar a los valientes, compartiré un pequeño truco para aprovechar el mecanismo de cotización. Dijimos que los minoristas a menudo tienen tamaño concentrado y ritmo no discreto, entonces, simplemente hay que hacer lo contrario. Supongamos que Dave quiere comprar 1000u en largo. En lugar de apostar todo de una vez, usando la estrategia de los grandes jugadores, primero compro 100u. El sistema de cotización bajará el precio, y entonces puedo acumular a un precio más barato. Luego compro otros 100u, y el precio continuará bajando, por lo que mi costo promedio de tenencia será mucho más barato que si hubiera apostado todo de una vez.

La historia de la mala suerte de los minoristas solo se ha contado a la mitad aquí. Además de los factores de cotización de gestión de inventario, el manejo del flujo de órdenes por parte de los market makers es otro elemento que causa la desviación del precio, es decir, el flujo tóxico de órdenes mencionado al principio. En la próxima parte, les presentaré el libro de órdenes y el flujo de órdenes de los market makers, y también especularé sobre las causas microeconómicas del desastre del 1011.

Para saber cómo continúa la historia, esperen la próxima entrega.

《MM en Auge 2: Libro de Órdenes y Flujo de Órdenes del Market Maker》

《MM en Auge 3: Ventaja Estadística y Diseño de Señales》

Trend Kriptolar

İlgili Sorular

Q¿Por qué los precios a menudo se mueven en contra de la dirección esperada después de que los minoristas compran altcoins?

ANo se debe a una manipulación subjetiva, sino al sesgo de cotización basado en inventario del modelo Avellaneda-Stoikov y los mecanismos de protección contra el flujo tóxico de órdenes. Los market makers ajustan los precios para gestionar el riesgo de inventario.

Q¿Cómo reaccionan los market makers cuando su inventario se vuelve corto debido a grandes compras de minoristas?

ALos market makers bajan los precios para atraer órdenes de venta, detener más compras y proteger su posición corta expuesta, mientras se cubren.

Q¿Qué es el 'Quote Skew' en el sistema de cotización de los market makers?

AEl 'Quote Skew' es el ajuste de los precios de oferta y demanda para gestionar el riesgo de inventario, atrayendo órdenes que equilibren el inventario y protegiendo las posiciones expuestas.

Q¿Por qué los minoristas a menudo experimentan precios en su contra en altcoins con baja liquidez?

APorque en altcoins con baja liquidez, las órdenes minoristas son a menudo las únicas órdenes activas en un período corto, lo que hace que los market makers reaccionen más fuertemente al riesgo de inventario.

Q¿Cuál es una estrategia que los minoristas pueden usar para aprovechar el mecanismo de cotización de los market makers?

AEn lugar de realizar órdenes grandes y concentradas, los minoristas pueden dividir sus órdenes en partes más pequeñas y ejecutarlas de manera gradual para obtener precios promedio más bajos debido a los ajustes de cotización.

İlgili Okumalar

After Three Consecutive Quarters of Decline, Can the Crypto Market Find a Window for Stabilization in Q3?

The cryptocurrency market has just concluded its worst-performing quarter since 2022, with total capitalization dropping 12.6% to $2.1 trillion. All core metrics indicate capital is leaving the sector, not just rotating within it. Bitcoin fell 14.2% and Ethereum dropped 25.4% in Q2, breaking their previous correlation with US tech stocks. A key driver is the reversal in US spot Bitcoin ETF flows, which saw a net outflow of approximately $4.67 billion in Q2, including a record monthly outflow near $4.5 billion in June. While recent data suggests long-term holders are accumulating again, sustained ETF outflows mean continued selling pressure. Market focus is now singularly on the Federal Reserve. The upcoming July FOMC meeting is seen as the most critical event for Q3. A dovish signal could support Bitcoin reclaiming a $68,000-$84,000 range, while a hawkish stance might establish a new trading band around $50,000-$56,000. Additionally, regulatory uncertainty persists, with the progress of the crucial *CLARITY Act* stalling in the Senate, reducing its perceived 2026 passage probability to 40-45%. Despite the broad downturn, a few sectors showed growth. Prediction markets saw nominal volume surge 48.7% year-over-year to $113.8 billion, and tokenized collectibles transaction volume rose 143% quarterly to $1.4 billion. The Real-World Asset (RWA) tokenization sector also continued steady growth, now representing ~$28.1 billion in on-chain value. The market's foundation for an extreme crash appears limited, with Bitcoin price hovering near its 200-week moving average. However, the trading paradigm has shifted from narrative-driven speculation to decisions based on price action, policy developments, and interest rate expectations, making a broad sentiment-driven rally unlikely in the near term.

marsbit22 saat önce

After Three Consecutive Quarters of Decline, Can the Crypto Market Find a Window for Stabilization in Q3?

marsbit22 saat önce

BIT Trading Moment: BTC Still Suppressed by Weekly 200 EMA, Rejection May Restart Decline; Storage and Semiconductors that Surged Last Night Begin Falling in Evening Trading

**Crypto & Stock Market Wrap: Bitcoin Tests Resistance, Stocks Retreat After AI Surge** Bitcoin consolidates around $66,000, facing key resistance near $68,000—an area seen as a major psychological and technical hurdle where previous rallies have failed. Analysts note the cryptocurrency is caught between its 200-week moving average (~$63,333) and 200-week EMA (~$68,328). A clear break above $68k is needed to signal a stronger bullish trend, while a rejection could lead to a retest of $63k support. Market sentiment remains cautious, with low futures open interest pointing to a low-liquidity rebound rather than a full bull market. Bitcoin spot ETFs saw another $203 million inflow. US stock futures pointed lower after a strong Tuesday session led by a massive rebound in semiconductors and memory stocks. The rally was fueled by renewed optimism about AI-driven hardware demand, with Micron, SanDisk, and SK Hynix surging. However, those gains reversed in pre-market trading. Super Micro Computer (SMCI) soared over 20% after hours on strong guidance and a record backlog. Other standouts included Rocket Lab and nuclear energy plays Oklo and X-Energy. Rising oil prices (Brent above $91) and climbing Treasury yields (10-year near 4.64%), however, are reigniting inflation concerns and acting as a headwind for equities. In Asia, markets were mixed. South Korea's KOSPI pared early gains to close slightly higher as semiconductor stocks like SK Hynix gave back initial surges. Japan's Nikkei edged lower as the yen hit a fresh 38-year low against the dollar, raising fears of potential market intervention. Key events to watch include the Samsung Galaxy launch, AMD's AI event, and a slew of major tech earnings from Alphabet, Tesla, and IBM after the close on Wednesday, followed by the ECB meeting and Intel's earnings on Thursday.

marsbit22 saat önce

BIT Trading Moment: BTC Still Suppressed by Weekly 200 EMA, Rejection May Restart Decline; Storage and Semiconductors that Surged Last Night Begin Falling in Evening Trading

marsbit22 saat önce

Former CFTC Chairman, Circle President Tarbert: Preaching Long-Termism While Cashing Out $30 Million Himself

Former CFTC Chairman and Circle President Heath Tarbert has consistently advocated for a long-term vision in public, urging patience from investors as Circle’s stock price has fallen significantly from its peak. However, it has been revealed that since Circle’s IPO, Tarbert has continuously sold his CRCL shares through pre-arranged trading plans, cashing out approximately $30 million, without making any public market purchases. This contrast between his public messaging and personal actions has drawn criticism. Tarbert joined Circle in July 2023 as Chief Legal Officer, leveraging his regulatory experience to help guide the company through its IPO and expansion. Despite promoting stablecoins as long-term infrastructure, he established a 10b5-1 trading plan just before Circle went public, leading to substantial stock sales over the following year. In March 2026, he initiated another plan to sell more shares. His career trajectory highlights a pattern of moving between high-level regulatory roles and influential positions in the financial sector. After resigning as CFTC Chairman in early 2021, he joined Citadel Securities as Chief Legal Officer just 27 days later, during a period of intense regulatory scrutiny for the firm. He later joined Circle, aiding its efforts to navigate regulatory challenges for its public listing. While Tarbert's expertise in policy and compliance is valuable to companies like Circle, his actions—advocating long-term confidence while personally divesting—raise questions about the alignment between his public statements and his private financial decisions, leaving investors who followed his advice to bear the market risks.

marsbit22 saat önce

Former CFTC Chairman, Circle President Tarbert: Preaching Long-Termism While Cashing Out $30 Million Himself

marsbit22 saat önce

Gate Research Institute: The 'Wall Street-ization' Wave of Crypto Financial Products – Competition or Integration?

The article titled "Gate Research Institute: Are Crypto Financial Products Sparking a 'Wall Street' Wave—Competition or Convergence?" explores the evolving relationship between the crypto ecosystem and traditional finance (TradFi). The piece begins by reflecting on Bitcoin's original 2009 vision of decentralization, disintermediation, and moving away from banks. It then contrasts this with the 2024 landscape, where key crypto assets like Bitcoin are increasingly held through Wall Street products like ETFs issued by giants like BlackRock. The article questions whether this signifies that TradFi is systematically taking over the rights to issue, price, custody, and distribute crypto financial assets. The core argument is that this is not a zero-sum takeover but rather a bidirectional convergence where each side addresses the other's weaknesses. Crypto offers 24/7 global markets, programmable settlement, and open access but lacks compliant channels, institutional-grade custody, deep fiat liquidity, and mainstream distribution. TradFi possesses these but is constrained by legacy systems, limited operating hours, and slow settlement. Two primary convergence paths are highlighted: * **Path A (CEX to TradFi):** Exemplified by Gate, which has progressed from offering tokenized stocks and CFDs to providing direct, real stock trading (US, Hong Kong, South Korea) within its platform, using USDT. * **Path B (TradFi to Crypto):** Exemplified by Robinhood, which has integrated crypto trading, acquired exchanges like Bitstamp, and is moving traditional assets like stocks onto the blockchain via tokenization and its own Layer 2. Both paths are ultimately competing to become the next-generation, unified financial account—a "super account" where users can seamlessly trade cryptocurrencies, stocks, ETFs, RWA (Real World Assets), and tokenized treasury products in one interface. The growth of RWA and tokenized treasuries (e.g., BlackRock's BUIDL) is presented as the asset-layer fusion, providing stable, yield-bearing assets on-chain and acting as a bridge between the two worlds. In conclusion, the "Wall Street-ization" of crypto is framed as a mutual transformation. Decentralized ideals persist in the protocol layer, while at the application layer, a more efficient, global, and accessible unified capital market is emerging from this convergence. The future competition lies not between crypto exchanges and stockbrokers, but between platforms vying to offer the most comprehensive asset coverage, liquidity, and user experience within a single account.

marsbit22 saat önce

Gate Research Institute: The 'Wall Street-ization' Wave of Crypto Financial Products – Competition or Integration?

marsbit22 saat önce

İşlemler

Spot

Popüler Makaleler

O Nasıl Satın Alınır

HTX.com’a hoş geldiniz! O1 exchange (O) satın alma işlemlerini basit ve kullanışlı bir hâle getirdik. Adım adım açıkladığımız rehberimizi takip ederek kripto yolculuğunuza başlayın. 1. Adım: HTX Hesabınızı OluşturunHTX'te ücretsiz bir hesap açmak için e-posta adresinizi veya telefon numaranızı kullanın. Sorunsuzca kaydolun ve tüm özelliklerin kilidini açın. Hesabımı Aç2. Adım: Kripto Satın Al Bölümüne Gidin ve Ödeme Yönteminizi SeçinKredi/Banka Kartı: Visa veya Mastercard'ınızı kullanarak anında O1 exchange (O) satın alın.Bakiye: Sorunsuz bir şekilde işlem yapmak için HTX hesap bakiyenizdeki fonları kullanın.Üçüncü Taraflar: Kullanımı kolaylaştırmak için Google Pay ve Apple Pay gibi popüler ödeme yöntemlerini ekledik.P2P: HTX'teki diğer kullanıcılarla doğrudan işlem yapın.Borsa Dışı (OTC): Yatırımcılar için kişiye özel hizmetler ve rekabetçi döviz kurları sunuyoruz.3. Adım: O1 exchange (O) Varlıklarınızı SaklayınO1 exchange (O) satın aldıktan sonra HTX hesabınızda saklayın. Alternatif olarak, blok zinciri transferi yoluyla başka bir yere gönderebilir veya diğer kripto para birimlerini takas etmek için kullanabilirsiniz.4. Adım: O1 exchange (O) Varlıklarınızla İşlem YapınHTX'in spot piyasasında O1 exchange (O) ile kolayca işlemler yapın.Hesabınıza erişin, işlem çiftinizi seçin, işlemlerinizi gerçekleştirin ve gerçek zamanlı olarak izleyin. Hem yeni başlayanlar hem de deneyimli yatırımcılar için kullanıcı dostu bir deneyim sunuyoruz.

177 Toplam GörüntülenmeYayınlanma 2026.06.19Güncellenme 2026.06.29

O Nasıl Satın Alınır

PROS Nasıl Satın Alınır

HTX.com’a hoş geldiniz! Pharos (PROS) satın alma işlemlerini basit ve kullanışlı bir hâle getirdik. Adım adım açıkladığımız rehberimizi takip ederek kripto yolculuğunuza başlayın. 1. Adım: HTX Hesabınızı OluşturunHTX'te ücretsiz bir hesap açmak için e-posta adresinizi veya telefon numaranızı kullanın. Sorunsuzca kaydolun ve tüm özelliklerin kilidini açın. Hesabımı Aç2. Adım: Kripto Satın Al Bölümüne Gidin ve Ödeme Yönteminizi SeçinKredi/Banka Kartı: Visa veya Mastercard'ınızı kullanarak anında Pharos (PROS) satın alın.Bakiye: Sorunsuz bir şekilde işlem yapmak için HTX hesap bakiyenizdeki fonları kullanın.Üçüncü Taraflar: Kullanımı kolaylaştırmak için Google Pay ve Apple Pay gibi popüler ödeme yöntemlerini ekledik.P2P: HTX'teki diğer kullanıcılarla doğrudan işlem yapın.Borsa Dışı (OTC): Yatırımcılar için kişiye özel hizmetler ve rekabetçi döviz kurları sunuyoruz.3. Adım: Pharos (PROS) Varlıklarınızı SaklayınPharos (PROS) satın aldıktan sonra HTX hesabınızda saklayın. Alternatif olarak, blok zinciri transferi yoluyla başka bir yere gönderebilir veya diğer kripto para birimlerini takas etmek için kullanabilirsiniz.4. Adım: Pharos (PROS) Varlıklarınızla İşlem YapınHTX'in spot piyasasında Pharos (PROS) ile kolayca işlemler yapın.Hesabınıza erişin, işlem çiftinizi seçin, işlemlerinizi gerçekleştirin ve gerçek zamanlı olarak izleyin. Hem yeni başlayanlar hem de deneyimli yatırımcılar için kullanıcı dostu bir deneyim sunuyoruz.

182 Toplam GörüntülenmeYayınlanma 2026.06.22Güncellenme 2026.06.29

PROS Nasıl Satın Alınır

VERONA Nedir

I. Proje Tanıtımı VERONA, zincir soyutlaması aracılığıyla herkes için, her yerde inşa edilmiş bir blok zinciridir. Genel Soyutlama katmanını kullanarak, VERONA, hesaplar, imzalar ve birlikte çalışabilirlik gibi karmaşık blok zinciri işlevlerini doğrudan protokol seviyesinde entegre ederek kendini ayırt eder. Bu yaklaşım, temel teknolojileri anlamaya gerek kalmadan blok zinciri uygulamalarıyla etkileşimde bulunmayı sağlar.1) Temel Bilgiler İsim: VERONA (VERONA)III. İlgili Bağlantılar Resmi web sitesi bağlantısı: https://xion.burnt.com/ Whitepaper: https://xion.burnt.com/whitepaper.pdf Keşif Araçları: https://explorer.burnt.com/ Sosyal Medya: https://x.com/burnt_xion Not: Proje tanıtımı, resmi proje ekibi tarafından yayımlanan veya sağlanan materyallerden alınmıştır, yalnızca referans içindir ve yatırım tavsiyesi teşkil etmez. HTX, ortaya çıkan doğrudan veya dolaylı kayıplardan sorumluluk kabul etmez.

175 Toplam GörüntülenmeYayınlanma 2026.06.22Güncellenme 2026.06.22

VERONA Nedir

Tartışmalar

HTX Topluluğuna hoş geldiniz. Burada, en son platform gelişmeleri hakkında bilgi sahibi olabilir ve profesyonel piyasa görüşlerine erişebilirsiniz. Kullanıcıların A (A) fiyatı hakkındaki görüşleri aşağıda sunulmaktadır.

活动图片