17 Desember: Analisis Pasar BTC, ETH, SOL, PTB, IR

金色财经2025-12-17 tarihinde yayınlandı2025-12-17 tarihinde güncellendi

Özet

Analisis Pasar Kripto 17 Desember: BTC, ETH, SOL, PTB, dan IR Data non-farm AS terbaru menunjukkan sinyal campuran, dengan fokus utama pada data Januari terkait potensi pemotongan suku bunga. Pasar prediksi menunjukkan sedikit kenaikan probabilitas pemotongan suku bunga Januari, namun tidak signifikan. BTC menunjukkan tren lemah dengan breakdown dari tren bullish. MACD death cross mengonfirmasi momentum bearish. Support kunci berada di $77.250-$78.800 untuk entri awal, dengan area beli utama di $74.600-$75.000 jika $77.000 tembus. ETH berada dalam siklus koreksi dengan support terdekat di $2.228. Support berikutnya di EMA52 ($2.508) dan low Juni ($2.112). Area bottoming diperkirakan di $2.112-$2.222. SOL berpotensi uji support di $102-$114, dengan EMA52 bulanan di $109.5. Break di bawah $100 bisa picu penurunan ke $84.85-$86.25. PTB dinilai sangat berisiko (high risk, low reward) dengan volatilitas ekstrem dan potensi penurunan drastis hingga 40%. IR (dengan harga pool $0.1) memiliki latar belakang pendanaan kuat dan revenue protocol, namun tokenomics tidak transparan dan minat komunitas rendah. Disarankan hindari pembelian saat peluncuran dan tunggu stabilisasi pasca-penjualan. Saran umum: Tunggu reaksi pasar setelah kenaikan suku bunga Jepang (19 Des) untuk konfirmasi arah. Fokus pada support-level kunci untuk akumulasi aset berkualitas.

Data terkait NFP tadi malam, satu menguntungkan dan satu merugikan, saling menetralisir. Wall Street saat ini benar-benar memfokuskan pada data bulan Januari karena terkait dengan kemungkinan penurunan suku bunga pada Januari. Setelah data NFP dirilis, pasar prediksi mengenai penurunan suku bunga pada Januari mengalami kenaikan, tetapi tidak signifikan.

Bitcoin terus melakukan penyesuaian lemah dalam 4 jam terakhir, saat ini belum ada sinyal penghentian penurunan atau dukungan yang efektif. Tunggu hingga tanggal 19 setelah kenaikan suku bunga Jepang untuk melihat reaksi pasar.
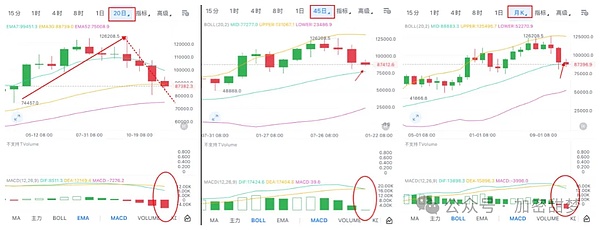
BTC

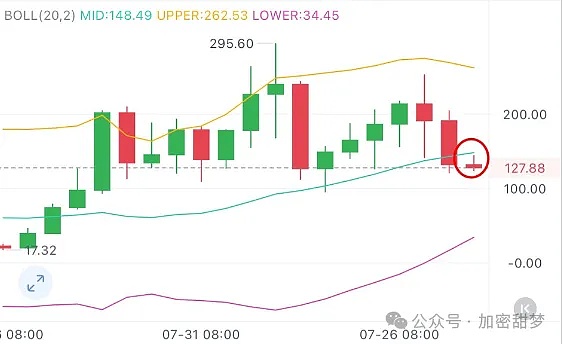
Dari segi pola level harian, BTC telah menembus di bawah tren, MACD dead cross, berpotensi turun lebih lanjut, level harian masih dalam pola bearish, lakukan short pada level resistance.

Bollinger Band tengah bulanan BTC di 88800 tembus minggu ini, sekarang telah menjadi resistance, jadi perhatikan Bollinger Band tengah 45 hari di 77250. Jadi bulan ini, beli kepala di 78800-77250 untuk posisi awal.

Sedangkan level 20 hari membentuk top bulat, momentum penurunan menunjukkan tren penguatan, titik dukungnya adalah Bollinger Band bawah di 80250 dan EMA52 (sekitar 75000). Jadi setelah tembus 7.7w, 75000-74600 adalah range beli utama kali ini.
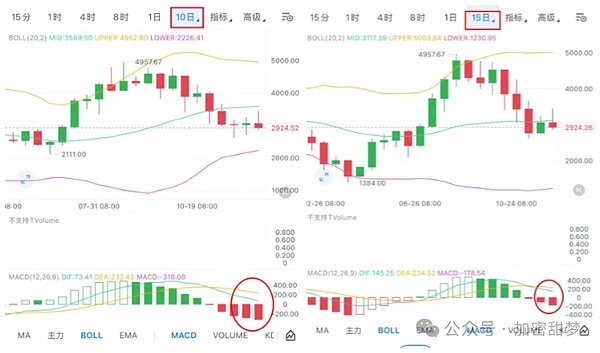
ETH

Saat ini berada dalam tahap penyesuaian level 10-15 hari dalam siklus penyesuaian bulanan. Penyesuaian 10 hari belum berakhir, garis cepat MACD hampir mencapai nol, mungkin akan mempercepat penurunan saat menyentuh nol; EMA7/30/52 semua tembus, dukungan jangka pendek hanya Bollinger Band bawah di 2228.

20 hari dead cross kemudian muncul 5 bearish berturut-turut, harga sedikit di bawah tengah, jauh dari bawah; dukungan utama EMA52 (2752), jika tembus maka titik terendah melihat rendah Juni 2112 (penyesuaian jarak sama tercapai, penyesuaian kanan berakhir). Bollinger Band tengah bulanan telah tembus, tetapi bawah 1620 terlalu jauh tidak efektif; dukungan efektif EMA52 (2508).

Range dasar bertahap kali ini: 2222-2112. Di antaranya 2752-2680 memiliki dukungan tertentu, tanpa berita buruk ekstrem yang menyebabkan penurunan, dapat dijadikan titik beli jangka pendek.

SOL

Saat ini berjalan di antara 10, 15, 20 hari dan Bollinger Band tengah-bawah bulanan, Bollinger Band bawah mereka均在 114-102, range ini dapat dijadikan referensi beli. Sekaligus EMA7-30 10, 15, 20 hari semua tembus, tidak ada dukungan.

EMA52 bulanan harganya 109.5. Jadi range beli sebelum 100 tembus adalah 114-102.

Mempertimbangkan kemungkinan jarum besar dalam kondisi ekstrem yang mungkin membuat 100 tembus virtual, titik setelah 100 tembus virtual adalah 96.25-95.65. Jika tembus di bawah 95 termasuk tembus nyata, maka pertimbangkan turun hingga 86.25-84.85.
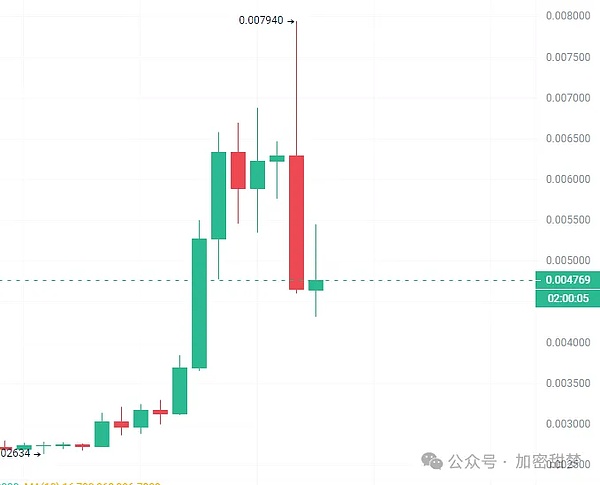
PTB

Koin seperti PTB ini tidak berani sentuh, seperti koin tunggal, long atau short mudah kena pukul, rasio harga-kinerja sangat rendah, mungkin lari cepat bisa jilat sedikit, tetapi lari lambat pasti kena pukul, singkatnya selama serakah akhirnya harus dikembalikan, terbang dulu kemudian satu jarum turun langsung 40% lebih.

IR

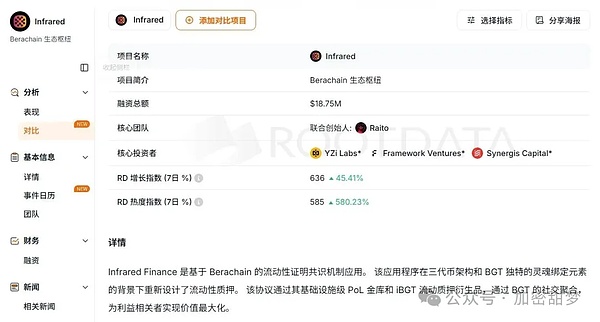
Total suplai 1 miliar, sirkulasi awal 20.5%, harga pool 0.1

Keuntungan: 1. Latar belakang pendanaan bagus, diinvestasikan Yzi Lab, co-founder Bera 2. Pendapatan protokol tahun ini lebih dari 8 juta dollar, TVL masih 210M 3. Harga pool tidak mahal, 0.1, 100M 4. Airdrop di dalam CEX, teman yang berpartisipasi bilang airdrop tidak banyak

Kerugian: 1. Pendapatan protokol karena bear chain tidak bagus terus menurun, puncak tidak keluarkan token sekarang keluarkan, puncak Maret sebulan 2.81 juta, bulan ini sampai sekarang hanya lebih dari 10 ribu 2. Tokenomics tidak diumumkan, komunitas juga tidak banyak diskusi

Satu-satunya kesempatan proyek adalah mengumpulkan chip saat semua orang jual, kemudian balik komunitas, mencapai kontrol chip, dapatkan posisi kontrak sepenuhnya, sehingga masih bisa untung一波 melalui kontrak, kalau tidak基本上 tidak ada kesempatan Buka tidak ingin接, tunggu setelah jual habis bisa stabil再说, dengan efek赚钱几个 proyek sebelumnya, perhatian pasar kembali ke ALPHA, proyek-proyek terakhir mulai panen, lebih猥琐一点吧.

Jika merasa konten kami bagus, bagikan akun publik kami ke teman-teman Anda! Selamat bergabung dan follow, pahami informasi terbaru dunia kripto!Setiap gelombang jatuh diikuti oleh lautan bintang, yang sangat bingung dengan tata布局 selanjutnya bisa follow Tianmeng,交硫葳:RFGH8689

İlgili Sorular

QApa yang menjadi fokus utama Wall Street terkait data ekonomi saat ini dan mengapa?

AWall Street saat ini lebih memfokuskan pada data bulan Januari karena berkaitan dengan kemungkinan penurunan suku bunga pada bulan tersebut. Data NFP terbaru memang memicu sedikit kenaikan dalam prediksi pasar tentang potensi penurunan suku bunga Januari, tetapi pergerakannya tidak signifikan.

QApa sinyal teknis untuk BTC berdasarkan analisis level daily, dan apa rekomendasi tradingnya?

APada level daily, BTC menunjukkan sinyal bearish: harga telah menembus below tren line, MACD mengalami death cross, dan terdapat potensi penurunan lebih lanjut. Rekomendasi tradingnya adalah melakukan short (jual) saat harga mencapai level resistance.

QDi level harga berapa analis merekomendasikan untuk mulai accumulation (akumulasi) BTC, dan mengapa level-level tersebut dipilih?

AAnalis merekomendasikan akumulasi pertama di range 78.800 - 77.250 USDT, yang merupakan area Bollinger Bands Middle Band pada chart 45-day. Jika harga jatuh di bawah 77.000 USDT, area akumulasi utama adalah di 75.000 - 74.600 USDT, yang merupakan level support dari Bollinger Bands lower band dan EMA52 pada chart 20-day.

QApa saja level support kunci untuk ETH dan di mana interval bottom (dasar) stagewise-nya diperkirakan?

ASupport penting untuk ETH termasuk Bollinger Lower Band (2.228 USDT) pada chart 10-15 day, EMA52 (2.752 USDT) pada chart 20-day, dan EMA52 (2.508 USDT) pada monthly chart. Interval bottom stagewise diperkirakan berada antara 2.222 - 2.112 USDT.

QBagaimana analis menilai potensi risiko dan imbal hasil untuk koin PTB?

AAnalis menilai PTB sebagai koin dengan risiko sangat tinggi dan imbal hasil (risk-reward ratio) yang buruk. Koin ini digambarkan seperti 'single-player coin' yang berbahaya baik untuk posisi long maupun short, dengan potensi penurunan drastis lebih dari 40% setelah kenaikan singkat, sehingga sangat tidak disarankan untuk trading.

İlgili Okumalar

The Trillion-Yuan Market Cap 'Yi Zhong Tian': Who is the True Value King?

The article analyzes the three leading Chinese optical module companies, collectively nicknamed "Yi Zhong Tian": Xinyisheng, Zhongji Innolight, and TFC Optical Communication. It evaluates their "cost-performance" not by current stock price, but through three lenses: PEG ratio (growth vs. valuation), earnings quality, and premium/discount for certainty. Xinyisheng shows the most attractive PEG ratio and high profitability, but its valuation reflects discounts for risks like high customer concentration and reliance on overseas markets. Zhongji Innolight, the most expensive, commands a premium for its market leadership, dominant share in key products like 800G/1.6T modules, and higher earnings certainty, though it faces geopolitical risks. TFC Optical, as an upstream component supplier ("water seller"), has the highest gross margin and bets on the long-term CPO/NPO architecture trend, but trades at a high valuation with more stable, less explosive growth. The core argument is that while these companies dominate module assembly, the true profit pool and technological moat lie upstream in laser and switch chips, currently controlled by U.S. firms like Lumentum and Coherent. The long-term "cost-performance" for these Chinese leaders hinges on whether the domestic industry, exemplified by companies like Yuanjie Technology, can successfully move up the value chain into high-power laser chips. Otherwise, their high growth may remain confined to the lower-margin assembly segment.

marsbit2 dk önce

The Trillion-Yuan Market Cap 'Yi Zhong Tian': Who is the True Value King?

marsbit2 dk önce

Has the Crypto Market Bottomed? Here's What Institutions Think

The crypto market is in a period of significant debate, with leading institutions offering differing views on whether a bottom has been reached. Three prominent firms have published detailed analyses: * **Galaxy Digital** argues Bitcoin has **not yet bottomed**. Their analysis of 13 historical indicators across six dimensions (valuation, profit-taking, miner pressure, etc.) shows only four are fully met. They project a potential bottom range between $30k and $54k. * **NYDIG** states a bottom is **possible but not likely**. While metrics are close to historic bear market extremes, they note the absence of a classic panic-selling event. They also suggest increased institutional adoption may have structurally altered the market cycle, potentially leading to a shallower downturn. * **Standard Chartered Bank** asserts the **bottom has already occurred** at around $59k. They cite two key factors: potential US-Iran diplomatic progress and the anticipated SpaceX IPO, which they believe absorbed capital and caused ETF selling pressure that is now subsiding. They forecast a year-end price target of $100k. Despite the surface-level disagreement, the reports share critical common ground more valuable for long-term investors: 1. All three believe the market bottom will form **within this year**. 2. All agree the current price is **closer to the bottom than to previous highs**. 3. All maintain a **bullish long-term outlook** for Bitcoin and a new cycle. The core takeaway is that while the exact bottom price ($40k, $50k, or $60k) is debated, the consensus is that a bottom is imminent. For long-term holders, the primary focus should not be pinpointing the absolute low, but on the future potential for prices to reach $100k, $200k, or higher. The fundamental thesis for Bitcoin—sovereign debt accumulation, inflation, declining trust in centralized institutions, global digitization, and improved accessibility—remains intact and is arguably strengthening. The overall landscape is viewed as more favorable than in previous crypto winters.

marsbit12 dk önce

Has the Crypto Market Bottomed? Here's What Institutions Think

marsbit12 dk önce

The 'Chip' Challenge and Breakthroughs in China's Optical Industry Chain

China's Photonics Industry: Bottlenecks and Breakthroughs In the global AI race, computing chips dominate the narrative, but the underlying bottleneck increasingly defining the scale of AI clusters is light—or more specifically, optical connectivity. Optical modules, which translate electrical signals to light and vice versa, are crucial for connecting thousands of GPUs in AI data centers, preventing data congestion and ensuring efficient model training. High-speed modules (800G, 1.6T) are now standard, with performance hinging on advanced DSP (Digital Signal Processor) chips. This is where a critical dependency lies. Two US giants—Marvell and Broadcom—collectively dominate over 90% of the high-end DSP chip market. Chinese optical module leaders like Zhongji Innolight and Eoptolink rely on these chips to manufacture modules for overseas AI customers, primarily in North America. While this creates a supply chain vulnerability, complete decoupling is difficult. Marvell derives over half its revenue from Greater China, and the US firms depend on Chinese partners for chip packaging and optical components. The risk from laser chips (e.g., from Lumentum), another key component, is considered more manageable due to multiple global suppliers and faster progress in domestic alternatives from companies like YOFC and Accelink. To mitigate risks, China's industry is pursuing a multi-pronged strategy: diversifying supply chains and locking in long-term orders; fostering a domestic market ecosystem to adopt homegrown DSPs from firms like Huawei HiSilicon and CETC; accelerating R&D in high-speed DSPs and advanced packaging; and investing in next-gen technologies like silicon photonics and Co-Packaged Optics (CPO) to reduce reliance on discrete DSPs. The ultimate solution lies not in short-term博弈 but in persistent advancement of domestic high-end chip R&D and manufacturing. While challenges remain in performance, certification, and ecosystem building, China's vast domestic market and manufacturing base provide a crucial buffer, buying time for the industry to achieve greater technological independence.

marsbit26 dk önce

The 'Chip' Challenge and Breakthroughs in China's Optical Industry Chain

marsbit26 dk önce

Behind SpaceX's $2 Trillion Market Cap: Why Does Musk Always Have the Next Move Planned?

On June 12th, SpaceX debuted on the Nasdaq, reaching a valuation that briefly touched $2 trillion. This marked the culmination of a 24-year journey from its founding in 2002, driven by Elon Musk's frustration at the high cost of buying rockets. The company's path was defined by early failures, with its first three Falcon 1 launches ending in explosions before a successful 2008 flight opened the era of commercial spaceflight. Key to its model was a fixed-price NASA contract, incentivizing cost reduction. SpaceX mastered rocket reusability, first achieving a Falcon 9 landing in 2015, which drastically cut launch costs. This enabled its profitable Starlink satellite internet constellation, envisioned years before reusability was proven, to create an internal market for frequent launches. Similarly, the next-generation Starship rocket was in development long before its first flight, with its business case evolving from Mars colonization to supporting the emerging concept of in-orbit data centers for AI—a story now central to its valuation. The company's recent IPO, a reversal of its long-standing "no IPO" stance, is funding this ambitious "space-based compute" vision. While major tech players like Google, Blue Origin, and others are investing heavily, significant technical and cost hurdles remain. Ultimately, SpaceX's history is one of creating its own demand: first with Starlink and now with space-based AI compute, betting that its next rocket will enable its next giant market.

marsbit28 dk önce

Behind SpaceX's $2 Trillion Market Cap: Why Does Musk Always Have the Next Move Planned?

marsbit28 dk önce

İşlemler

Spot
Futures

Popüler Makaleler

IR Nasıl Satın Alınır

HTX.com’a hoş geldiniz! Infrared Finance (IR) satın alma işlemlerini basit ve kullanışlı bir hâle getirdik. Adım adım açıkladığımız rehberimizi takip ederek kripto yolculuğunuza başlayın. 1. Adım: HTX Hesabınızı OluşturunHTX'te ücretsiz bir hesap açmak için e-posta adresinizi veya telefon numaranızı kullanın. Sorunsuzca kaydolun ve tüm özelliklerin kilidini açın. Hesabımı Aç2. Adım: Kripto Satın Al Bölümüne Gidin ve Ödeme Yönteminizi SeçinKredi/Banka Kartı: Visa veya Mastercard'ınızı kullanarak anında Infrared Finance (IR) satın alın.Bakiye: Sorunsuz bir şekilde işlem yapmak için HTX hesap bakiyenizdeki fonları kullanın.Üçüncü Taraflar: Kullanımı kolaylaştırmak için Google Pay ve Apple Pay gibi popüler ödeme yöntemlerini ekledik.P2P: HTX'teki diğer kullanıcılarla doğrudan işlem yapın.Borsa Dışı (OTC): Yatırımcılar için kişiye özel hizmetler ve rekabetçi döviz kurları sunuyoruz.3. Adım: Infrared Finance (IR) Varlıklarınızı SaklayınInfrared Finance (IR) satın aldıktan sonra HTX hesabınızda saklayın. Alternatif olarak, blok zinciri transferi yoluyla başka bir yere gönderebilir veya diğer kripto para birimlerini takas etmek için kullanabilirsiniz.4. Adım: Infrared Finance (IR) Varlıklarınızla İşlem YapınHTX'in spot piyasasında Infrared Finance (IR) ile kolayca işlemler yapın.Hesabınıza erişin, işlem çiftinizi seçin, işlemlerinizi gerçekleştirin ve gerçek zamanlı olarak izleyin. Hem yeni başlayanlar hem de deneyimli yatırımcılar için kullanıcı dostu bir deneyim sunuyoruz.

298 Toplam GörüntülenmeYayınlanma 2025.12.17Güncellenme 2026.06.02

IR Nasıl Satın Alınır

Tartışmalar

HTX Topluluğuna hoş geldiniz. Burada, en son platform gelişmeleri hakkında bilgi sahibi olabilir ve profesyonel piyasa görüşlerine erişebilirsiniz. Kullanıcıların IR (IR) fiyatı hakkındaki görüşleri aşağıda sunulmaktadır.

活动图片