Coinbase Wallet Rebalancing Creates False $68B LTH Distribution Signal – Details

bitcoinist2025-11-28 tarihinde yayınlandı2025-11-28 tarihinde güncellendi

Özet

The crypto market is facing a wave of misinterpretation as Coinbase’s large-scale wallet rebalancing, which began on November 22, 2025,...

Trusted Editorial content, reviewed by leading industry experts and seasoned editors. Ad Disclosure

The crypto market is facing a wave of misinterpretation as Coinbase’s large-scale wallet rebalancing, which began on November 22, 2025, continues to distort major on-chain indicators. Many dashboards now display what appears to be an unprecedented $68 billion Long-Term Holder (LTH) “sell” spike — but according to analysts, this is not real distribution. Instead, it’s the direct result of Coinbase transferring coins internally as part of its routine wallet restructuring process.

This distinction is critical. Several prominent analysts and market commentators have highlighted massive outflows, huge shifts in LTH supply, and unusual wallet movements, yet many have failed to mention the underlying cause: Coinbase’s internal reshuffling. Without this context, market participants might wrongly conclude that long-term holders are panic-selling at scale, reinforcing fear during an already fragile market environment.

These rebalancing events have happened before, but the size of Coinbase’s holdings means even normal internal operations can trigger dramatic spikes in on-chain metrics such as LTH Net Position Change, Exchange Netflow, and Spent Output Age Bands.

Coinbase Internal Transfers Distorted Key On-Chain Metrics

According to detailed analysis by Axel Adler, Coinbase’s internal migration of approximately 800,000 BTC created one of the largest distortions in on-chain data ever recorded — without a single coin being sold.

The exchange executed 286 transactions totaling 798,636 BTC, moving funds from legacy P2PKH (Pay-to-Public-Key-Hash) addresses to modern P2WPKH (SegWit) addresses. This technical reorganization produced an artificial $68 billion “realized profit” spike, misleading many market observers into interpreting it as massive long-term holder distribution.
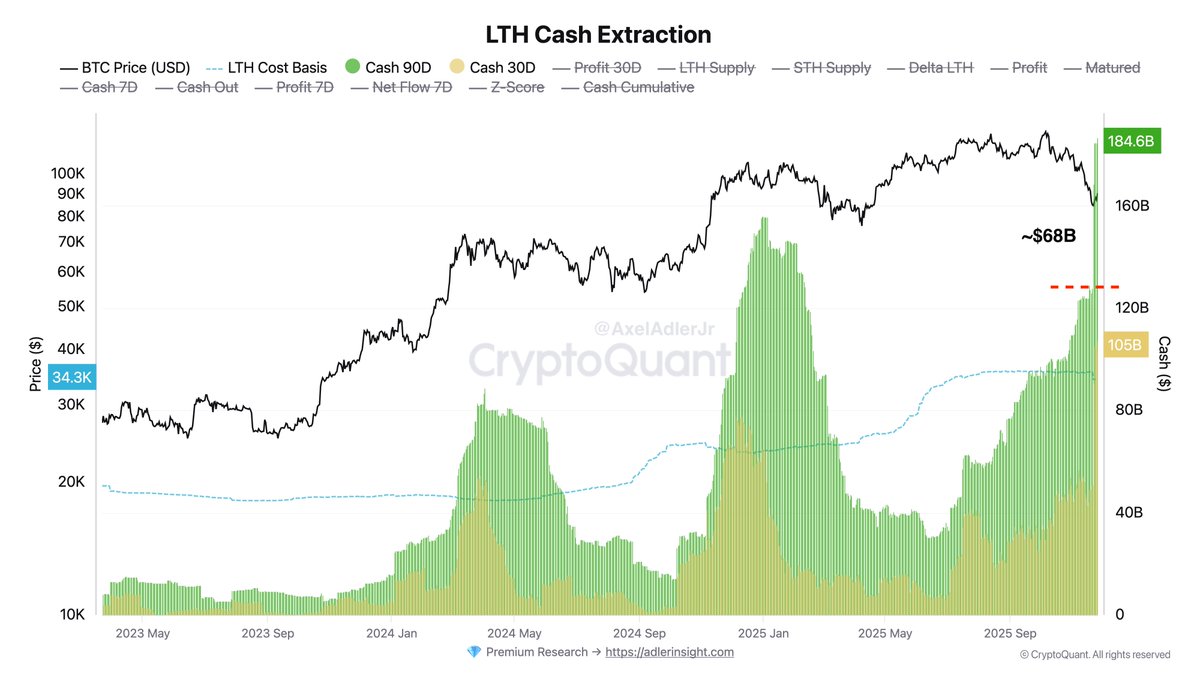
LTH Cash Extraction Chart | Source: Axel Adler

This large UTXO migration disrupted several major on-chain indicators. LTH and STH Supply metrics were temporarily skewed, showing a sharp drop in Long-Term Holder supply and a rise in Short-Term Holder supply — a pattern typically associated with heavy “smart money” selling. In reality, no distribution occurred; Coinbase simply restructured its internal wallets.

The distortion also affected LTH Realized Profit/Loss models, which reflected tens of billions in phantom gains, and HODL Waves, where UTXO ages were “reset,” suggesting long-term holders had suddenly spent old coins. Even Coin Days Destroyed (CDD) showed a significant spike, mimicking an “old coin awakening,” though the activity was entirely internal.

These disruptions highlight how exchange operations can temporarily break the reliability of on-chain metrics, requiring careful interpretation from analysts and investors.

Total Market Rebounds but Remains Under Critical Pressure

The Total Crypto Market Cap chart shows a sharp rebound after tagging the $2.88T zone, a level that aligns closely with the 100-week moving average (green), acting as a key structural support in previous cycles. This bounce has pushed total valuation back above the $3T mark, but the broader trend remains fragile after weeks of heavy selling across majors like BTC and ETH.
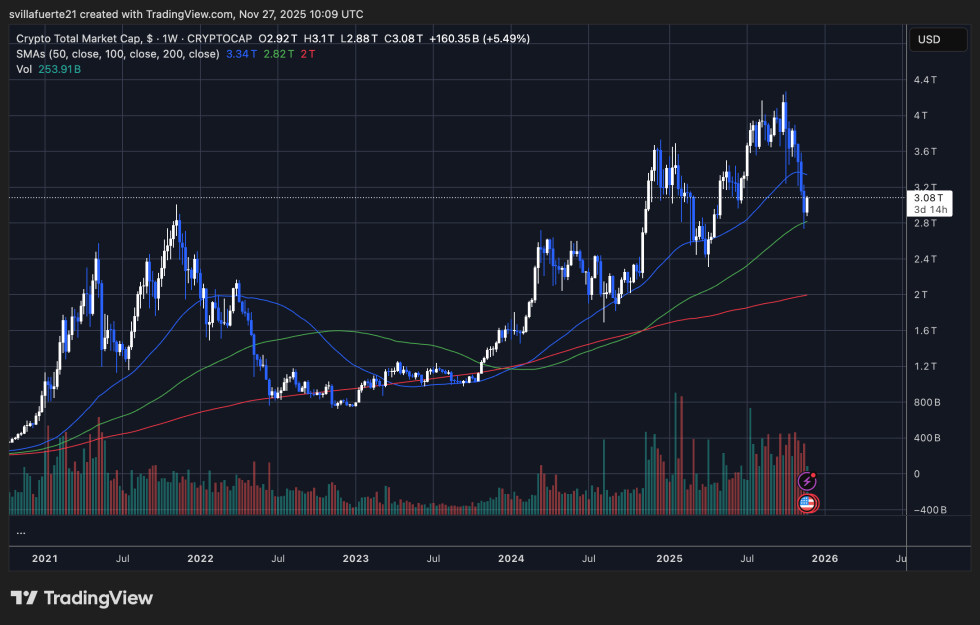
Total Crypto Market Cap | Source: TOTAL chart on TradingView

Price structure highlights a clear breakdown from the $3.6T–$3.8T consolidation zone, followed by a fast, impulsive decline—mirroring the speed of corrections seen during 2021 and mid-2022. Despite the latest recovery candle, the market remains below the 50-week moving average (blue), signaling that buyers must regain momentum quickly to avoid deeper downside toward the 200-week moving average near $2T.

Volume has surged on recent sell-offs, showing widespread forced selling and capitulation behavior—a pattern consistent with cycle mid-reset phases. The rebound, however, shows reduced sell volume, suggesting exhaustion from bearish participants. To confirm strength, total market cap must reclaim the $3.25T–$3.3T area, which currently acts as the first major resistance.

Failure to break above this zone risks further consolidation or a retest of the $2.8T support. For now, the market shows early signs of stabilization, but broader recovery depends on Bitcoin’s ability to sustain its own rebound and restore confidence across altcoins.

Featured image from ChatGPT, chart from TradingView.com

Editorial Process for bitcoinist is centered on delivering thoroughly researched, accurate, and unbiased content. We uphold strict sourcing standards, and each page undergoes diligent review by our team of top technology experts and seasoned editors. This process ensures the integrity, relevance, and value of our content for our readers.

Sebastian's journey into the world of crypto began four years ago, driven by a fascination with the potential of blockchain technology to revolutionize financial systems. His initial exploration focused on understanding the intricacies of various crypto projects, particularly those focused on building innovative financial solutions. Through countless hours of research and learning, Sebastian developed a deep understanding of the underlying technologies, market dynamics, and potential applications of cryptocurrencies. As his knowledge grew, Sebastian felt compelled to share his insights with others. He began actively contributing to online discussions on platforms like X and LinkedIn, focusing on fintech and crypto-related content. His goal was to expose valuable trends and insights to a wider audience, fostering a deeper understanding of the rapidly evolving crypto landscape. Sebastian's contributions quickly gained recognition, and he became a trusted voice in the online crypto community. To further enhance his expertise, Sebastian pursued a UC Berkeley Fintech: Frameworks, Applications, and Strategies certification. This rigorous program equipped him with valuable skills and knowledge regarding Financial Technology, bridging the gap between traditional finance (TradFi) and decentralized finance (DeFi). The certification deepened his understanding of the broader financial landscape and its intersection with blockchain technology. Sebastian's passion for finance and writing is evident in his work. He enjoys delving into financial research, analyzing market trends, and exploring the latest developments in the crypto space. In his spare time, Sebastian can often be found immersed in charts, studying 10-K forms, or engaging in thought-provoking discussions about the future of finance. Sebastian's journey as a crypto analyst and investor has been marked by a relentless pursuit of knowledge and a dedication to sharing his insights. His ability to navigate the complex world of crypto, combined with his passion for financial research and communication, makes him a valuable asset to the industry. As the crypto landscape continues to evolve, Sebastian remains at the forefront, providing valuable insights and contributing to the growth of this revolutionary technology.

İlgili Okumalar

Valuation $1 Billion, Nvidia Doubles Down! Is Prime Intellect Washing Off Its Web3 Label?

Prime Intellect, a decentralized AI infrastructure company founded in 2024, recently announced a $130 million Series A funding round at a $1 billion valuation, with investments from NVIDIA, Intel, and Dell's venture arms. The company claims its annualized recurring revenue (ARR) has exceeded $100 million within a year, serving over 6,000 enterprise clients. Initially rooted in Web3 and decentralized science (DeSci), Prime Intellect has evolved into a full-stack AI training and deployment platform. Its core technology enables distributed training of large language models across globally dispersed, heterogeneous GPU clusters. Key milestones include releasing open-source models like INTELLECT-1 and INTELLECT-3, and launching Prime Intellect Lab, a platform allowing users to train and optimize agentic models without managing their own GPU infrastructure. The company's deep collaboration with hardware giants, particularly NVIDIA, extends beyond investment to joint optimization of software (e.g., integrating NVIDIA Dynamo) and hardware systems. A notable commercial case involves fintech company Ramp using Prime Lab to train a specialized agent, demonstrating the platform's applied value. While achieving rapid commercial growth, Prime Intellect has systematically downplayed its earlier Web3 and token-based incentives from its official documentation, repositioning itself as a mainstream AI infrastructure provider focused on enterprise adoption and potential IPO.

Foresight News5 dk önce

Valuation $1 Billion, Nvidia Doubles Down! Is Prime Intellect Washing Off Its Web3 Label?

Foresight News5 dk önce

After 13% Daily Distribution, Why Did SATA Still Fall?

Strive Asset Management's BTC-linked preferred stock SATA transitioned from monthly to daily dividend distributions on June 16, with a current annualized yield of 13%. Despite this change, SATA's price fell approximately 9.9% from June 22 to June 26. The analysis highlights that this decline reflects fundamental credit and structural risks, not simply dividend frequency. SATA represents a perpetual, cumulative preferred equity interest in Strive, not a direct Bitcoin-backed bond. Its dividends depend on Strive's corporate credit and access to capital markets. While Strive's Bitcoin holdings grew from 15,009 to 19,864 BTC between May 12 and June 18, SATA's outstanding shares grew faster (from ~4.96 million to ~7.83 million). Coupled with a drop in BTC price, the pure Bitcoin coverage ratio for SATA's stated amount fell from ~2.44x to ~1.52x. A further ~34.3% decline in BTC to ~$39,416 would bring this coverage to 1.0x. Daily dividends smooth cash flow for investors and reduce dividend-capture trading, but do not eliminate price volatility or credit risk. SATA now trades at a ~12.25% discount to its $100 stated amount, implying a market yield of ~14.81% and a credit spread of ~1,117 bps over SOFR. Key risks include a negative feedback loop if SATA trades below par, making new issuance dilutive; reliance on capital markets for dividend funding despite a ~17-month cash buffer; and the perpetual nature of the security, where dividends can be deferred. In summary, SATA innovates by providing daily income from a Bitcoin-focused corporate balance sheet, but its recent price action underscores its exposure to Bitcoin valuation, company-specific financing risks, and perpetual duration. The market is repricing it from a near-par yield product to a deeply discounted high-risk credit instrument.

marsbit33 dk önce

After 13% Daily Distribution, Why Did SATA Still Fall?

marsbit33 dk önce

Unlocking 20%, $125 Million in Pressure, Can PUMP Hold Up?

"Pump.fun Faces Crucial Test with $125M Token Unlock Despite a cooldown in the meme coin market, Pump.fun remains one of Web3's top revenue-generating protocols, earning $28.4 million in the past 30 days. The platform has accumulated approximately $1.05 billion in total revenue from over 12 million tokens created. The protocol now faces its biggest challenge: the first unlock of team and investor tokens. A total of 82.5 billion PUMP tokens (8.25% of total supply, 20.23% of previous circulating supply), valued at around $125 million, have been unlocked. This potential selling pressure is significant compared to the token's 24-hour trading volume of only $28 million. While Pump.fun uses a portion of its revenue to buy back and burn PUMP tokens, creating buy-side pressure, this support has weakened. The buyback rate was reduced from 100% to 50% of net fees in April 2024. In June 2024, monthly buybacks totaled just $9.2 million, an over 80% drop from its peak. At this rate, selling just 7% of the newly unlocked tokens would offset a full month of buybacks. Furthermore, this unlock is only the first batch; team and investors still hold another 247.5 billion locked PUMP tokens, with 240 billion community tokens awaiting a release schedule. Despite these headwinds, PUMP is argued to be a relatively scarce asset in the current market. With a $610 million market cap against $28.4 million in monthly revenue, its valuation is lower than competitors like Hyperliquid. The investment thesis for PUMP is not betting on a single meme coin but on the persistent activity of the meme market and Pump.fun's ability to maintain its position as a key platform. The conclusion suggests that while the unlock tests short-term price resilience, the protocol's underlying revenue strength will determine PUMP's long-term trajectory, potentially making the current dip a viable entry point for long-term accumulation."

Odaily星球日报46 dk önce

Unlocking 20%, $125 Million in Pressure, Can PUMP Hold Up?

Odaily星球日报46 dk önce

Aave Withdrawal, TVL Plunges: Where is MegaETH's Valuation Anchor?

MegaETH, once a highly anticipated new blockchain, has seen a dramatic decline in its Total Value Locked (TVL) and token price. According to DefiLlama data, its TVL plummeted nearly 60% in 24 hours, falling to just over $30 million from a May peak, with the Aave V3 protocol withdrawing 80% of its liquidity. The MEGA token price dropped to around $0.048, with a market cap of ~$54 million and a fully diluted valuation (FDV) of ~$480 million. The analysis identifies three key mismatches between MegaETH's valuation and its fundamentals. First, its high FDV contrasts with minimal real usage: low protocol revenue (~$90k/30 days) and few daily active addresses. Second, its DeFi narrative is contradicted by its revenue structure, where a collectible card game (Monster) generates most income, not major DeFi protocols like Aave. Third, initial hype from VC backing and airdrop farming has faded without sustained user adoption or clear applications. The TVL was heavily concentrated in Aave and largely driven by cyclical arbitrage strategies involving stablecoins like USDm and USDe. As the yield for these strategies diminished, funds rapidly exited. The departure of this speculative capital has exposed a lack of substantial, organic ecosystem activity. While the sharp drop could be seen as a correction from inflated expectations, the article suggests MegaETH's valuation lacks a solid foundation. Future price movements may rely on short-term market sentiment rather than genuine improvement in network fundamentals, such as increased real usage, a diversified application ecosystem, and consistent user growth. The situation reflects a broader market trend of demanding clearer value propositions beyond just high TVL figures.

marsbit1 saat önce

Aave Withdrawal, TVL Plunges: Where is MegaETH's Valuation Anchor?

marsbit1 saat önce

İşlemler

Spot
活动图片