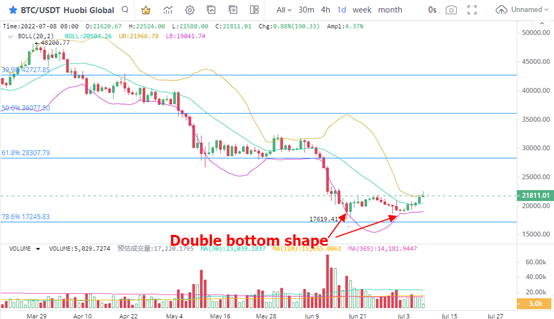
1、 BTC further confirms the double bottom
In the daily K-line chart of BTC, after the price increase of BTC expanded below $22500, the authenticity of the double bottom pattern was further verified. From the perspective of volume and price performance, the rising process of BTC is relatively conservative and does not continue to pull up strongly. The trading volume is always near the login line, which means that there is no signal of continuous and significant improvement in investor participation. Nevertheless, the value of BTC is expected to strengthen. Considering that the support of $17245 corresponding to 78.6% Fibonacci is effective, from the perspective of range fluctuation, BTC is far from releasing $28307 corresponding to 61.8% Fibonacci, and there is room for further rise.
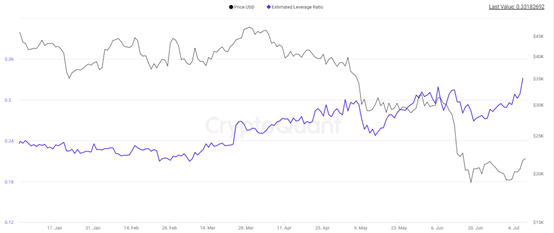
2. BTC leverage increase
With the increase of BTC price rebound space and growth participation, one of its manifestations is the upward leverage. From the figure, the trading leverage ratio of BTC has rebounded to around 0.3318, which has significantly exceeded the peak leverage ratio in May and June. After the leverage ratio picks up, BTC volatility is expected to further strengthen. The price of BTC is expected to reach around $25000 within the week. Increased leverage will also increase volatility opportunities. In the near future, investors can still hold money and wait for the market to pick up.
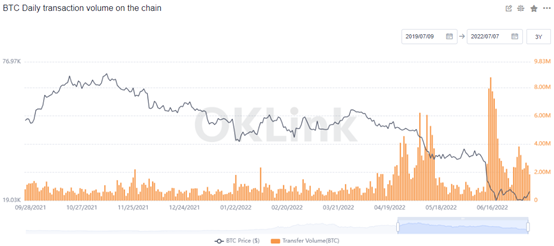
3. Strong data performance on BTC chain
BTC's trading volume on the chain has continued to rise in the near future. Even after BTC bid farewell to the strong earthquake in June, investors' trading heat on the chain remains unabated. The figure shows that the trading volume on the chain is maintained at more than 1.85 million within a day, with an average of more than 2.2 million. Compared with the dull period, the online trading volume is less than 600000. At present, the online trading volume has increased by more than 200%. The trading volume on the chain remains high, indicating that the cost of holding money for investors may have changed. In other words, the high trading volume on the chain indicates that the turnover rate is at a high level, and the bottom confirmation process of BTC continues. Short term price rebound requires vigilance against possible price shocks.
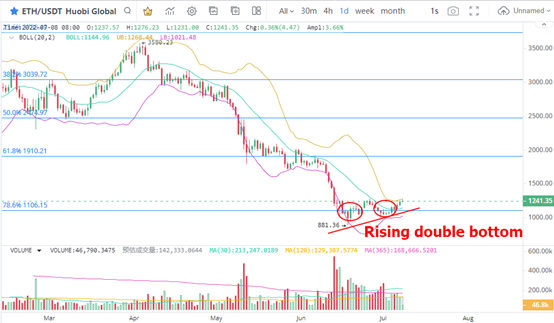
4. Double bottom shape verification of eth recovery
In the daily K-line chart of eth, after the bottom of the price rises, the double bottom reversal of the rebound is being confirmed. Although the trading volume contracted, the price trend of eth was still strong, reaching the pressure level below $1300. At present, the price has not effectively exceeded $1300. Below this point, the support effect is further verified during the period of price shock. Fibonacci 78.6% of the corresponding $1106 support is still effective, low absorption can refer to this point to buy eth.
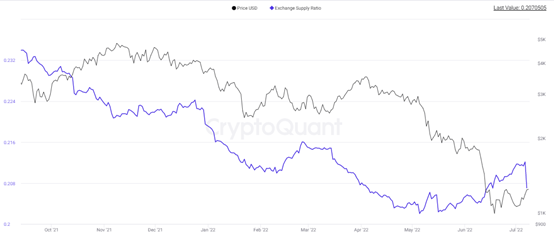
5. Eth selling pressure is significantly low
Recently, the number of eth inflows into exchanges has continued to grow, but the data on July 7 showed a reversal signal. The number of eth in the exchange quickly retreated from 0.212 to around 0.207. Judging from the trend of the index, it has almost become the largest change in the value of the year. Based on this judgment, the short-term price rebound of eth has been recognized by investors. The decline in the proportion of eth in the number of exchanges indicates that the selling pressure has decreased significantly, which means that the possibility of eth price rise has increased. At present, volume and price support eth to further rise. In absolute terms, the number of eth in the exchange fell from 25.22 million to 24.6 million in July, a decrease of 620000 eth, worth 744million US dollars. In other words, as much as $744million of eth flowed out of the exchange, and the selling pressure was reduced accordingly.