[Key interpretation] Panic fell and the bottom of BTC strengthened again

Huobi Research2022-07-07 tarihinde yayınlandı2022-07-08 tarihinde güncellendi

Özet

BTC is expected to strengthen better, and the market is about to give an answer.

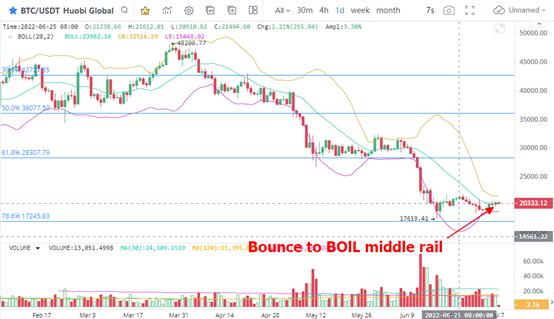
1、 The rebound trend of BTC remains unchanged

In the daily K-line chart of BTC, the price fluctuation space is relatively limited, and the amplitude remains within 7%. The trading volume performance was relatively mild, which failed to promote BTC to significantly expand its increase. At this time, the competition for long and short trading is not fierce, and the market is in the brewing stage. Due to the narrower fluctuation, the difference between BTC and the corresponding $21659 of brin online rail is $1326. Therefore, the price is more likely to reach this point in the short term. Next, BTC will remain relatively strong, and the space for price rise will continue to increase.

2. BTC panic index rebounded slightly

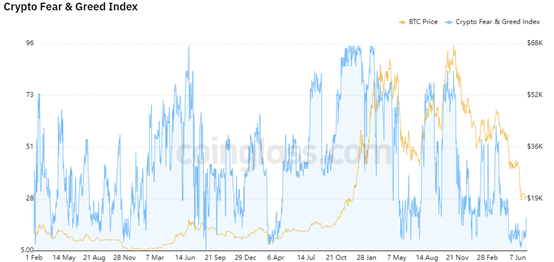
The BTC panic index continued to show a clear rebound signal. Numerically, the panic index reached 17.21 on July 6. Although it is still in a panic state, with the rebound of the value, investors' trading enthusiasm is picking up.

From the performance of the panic index in the past few months, during the low-level operation of the panic index in the BTC decline stage, only the short-term rebound to the high level will significantly prompt the selling signal. In other words, only when the panic index rises to around 50 will investors be vigilant. Before that, the rebound signal of the panic index and the rebound trend of prices were basically the same.

3. BTC another bottom signal

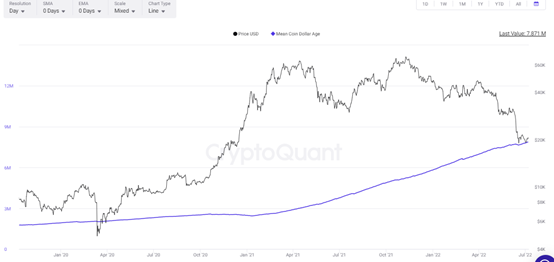
The unused transaction output indicator MCA of BTC can be used to judge the strength and bottom characteristics of price adjustment. At present, the BTC price is very close to the unused transaction output indicator MCA, and indicates a rebound signal. In the past three years, the stage where BTC price is closest to MCA continues in 2020. In March, 2020, the BTC price appeared below this indicator, which effectively verified the oversold bottom.

At present, the BTC price not only touches the MCA, but also continues to rebound. Based on this, it is judged that the bottom feature is still being confirmed. Therefore, at present, the risk of low BTC absorption is reduced, and the possibility of profit is increased.

4. Eth selling pressure limited rebound continued

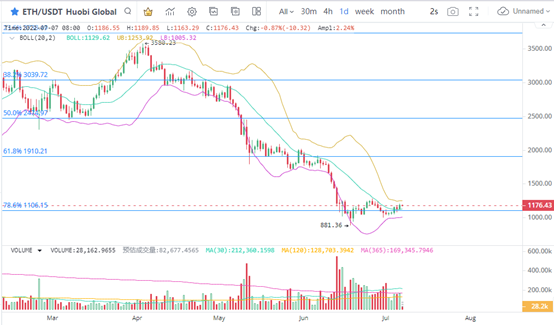
In the daily K-line chart of eth, the possibility of US $1106 reversal corresponding to 78.6% of the price in Fibonacci has increased, and the double bottom expectation in the rebound stage has strengthened.

In terms of trading volume, it is clear that the daily trading volume of eth is at the low level since June, but the sign of shrinking trend is not obvious. When the price fluctuation intensity is weak, ETH's brin line has a good closing effect, and the distance from brin line to off track is significantly lower than the level in early June. Therefore, the space for eth to change its disk in the near future may be increased. Short term selling pressure is not large, and further rise may expand the room for growth. In terms of pressure level, pay attention to the cash holding opportunities below $1500.

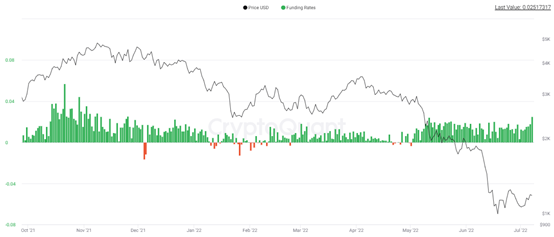
5. Eth financing interest rate continues to rise

Recently, the financing interest rate of eth has continued to climb to a short-term high, reaching a high of 0.025 on July 7. In terms of relative value, the current financing interest rate of eth is the highest in the year, which means that investors have more clear signs of being bullish. The increase in the cost of long financing to buy eth means that the market is developing in a good direction. Since May 2022, ETH financing interest rate has continued to maintain a short-term high operation. At present, the signs of eth financing interest rate rising are clear, and it has lasted for five transactions. Therefore, the possibility of accelerating the rise of eth prices in the short term cannot be ruled out.

İlgili Okumalar

The Value Distribution of Stablecoins

**Summary: The Value Distribution of Stablecoins** The article argues that stablecoins are evolving from mere trading tools into broader channels for dollar access. It divides the stablecoin ecosystem into four layers to analyze how value is distributed: 1. **Issuance Layer:** Mints stablecoins, holds reserve assets, and captures the spread between reserve yield and user costs (e.g., Tether, Circle). This layer currently earns the largest profit margin. 2. **Infrastructure Layer:** Connects stablecoins to the traditional financial system, handling fiat on/off-ramps, banking integration, compliance (KYC/AML), and asset management (e.g., Bridge, BVNK). This is the "unglamorous" but critical work, building the essential bridges between crypto and real-world finance. 3. **Acquiring/Distribution Layer:** Integrates stablecoins into merchant systems, manages payment flows, and provides enterprise financial software (e.g., Stripe, Coinbase). They act as the access point for businesses. 4. **Application Layer:** The end-users and businesses that ultimately use stablecoins for payments, settlements, or as a store of value. They benefit from convenience but have little pricing power. The core thesis is that while the issuance layer currently dominates profits, the often-overlooked **infrastructure layer holds significant long-term potential**. The real challenge and barrier to mass adoption is not the on-chain transfer of stablecoins (which is simple), but the complex "last mile" integration into existing business workflows, banking systems, and regulatory frameworks across different countries. Companies in this layer are currently in a "land grab" phase, investing heavily to build networks, secure bank partnerships, and establish compliance pathways. While their position is currently pressured by the profitable issuers above and distribution platforms below, the article suggests that if stablecoins become a default financial rail for businesses, the infrastructure providers who have done the hard work of integration will ultimately gain strong pricing power and become entrenched, essential players.

marsbit6 saat önce

The Value Distribution of Stablecoins

marsbit6 saat önce

The Value Distribution of Stablecoins

The Value Distribution of Stablecoins The article argues that stablecoins are evolving from a mere trading tool into a broad "dollar channel." It analyzes the industry's value chain through four layers: 1. **Issuance Layer (e.g., Tether, Circle):** The top layer that mints stablecoins, holds reserve assets, and captures the thickest interest rate spread. 2. **Infrastructure Layer (e.g., Bridge, BVNK):** Connects stablecoins to the traditional financial system, handling critical but complex "dirty work" like fiat on/off-ramps, banking integration, compliance (KYC/AML), and cross-border settlement. 3. **Acquiring/Distribution Layer (e.g., Stripe, Coinbase):** Embeds stablecoins into merchant systems, manages payment flows, and integrates with enterprise software. 4. **Application Layer:** End-users and businesses that ultimately use stablecoins for payments, settlement, or storing value. The author posits that while the issuance layer currently captures the most profit, the most overlooked and potentially critical layer is infrastructure. The core challenge for stablecoin adoption isn't the on-chain transfer (which is simple), but bridging the gap between blockchain and the real-world financial system. This involves solving practical problems for businesses: fiat conversion, reconciliation, tax handling, and user onboarding. Infrastructure companies are currently in a difficult "land-grab" phase—building networks, securing banking relationships, and achieving compliance country-by-country. They face pressure from both the profitable issuance layer above and distribution platforms below. However, the author suggests this layer is building a crucial moat. Once stablecoins become a default business rail, the infrastructure players who have done the hard work of integration may gain significant, durable value and pricing power.

链捕手6 saat önce

The Value Distribution of Stablecoins

链捕手6 saat önce

İşlemler

Spot
Futures
活动图片