Stuck in Limbo

insights.glassnode2025-11-11 tarihinde yayınlandı2025-11-12 tarihinde güncellendi

Executive Summary

  • Bitcoin remains in a mild bearish phase, trading between $97K and $111.9K, with resistance near $116K marked by top-buyers’ supply cluster.
  • Seller exhaustion and renewed accumulation near $100K provide short-term support but lack strong follow-through demand.
  • A dense supply cluster between $106K–$118K continues to cap rallies as investors exit near breakeven.
  • ETF flows have turned modestly negative, reflecting fading institutional demand and a cautious risk appetite.
  • Futures markets show muted funding rates and low open interest, signalling subdued speculative activity across both Bitcoin and altcoins.
  • Options traders maintain a defensive stance, with put protection concentrated around $100K, while the 25-delta skew remains a key gauge for sentiment shifts.
  • Overall, the market is consolidating within a defined range, awaiting stronger inflows or macro catalysts to break out of the current equilibrium.

Over the past week, Bitcoin briefly slipped below $100K, extending the broader downtrend that has persisted since early October. This move pushed the market into a mild bearish regime, with prices now trading beneath the short-term holder cost basis.

In this edition, we analyze the forces driving the rebound toward $106K using on-chain cost-basis models and accumulation–distribution dynamics. We then pivot to off-chain indicators, exploring ETFs, futures markets and options market sentiment to assess whether this recovery reflects genuine demand or a short-lived relief rally.

On-chain Insights

Grinding Lower

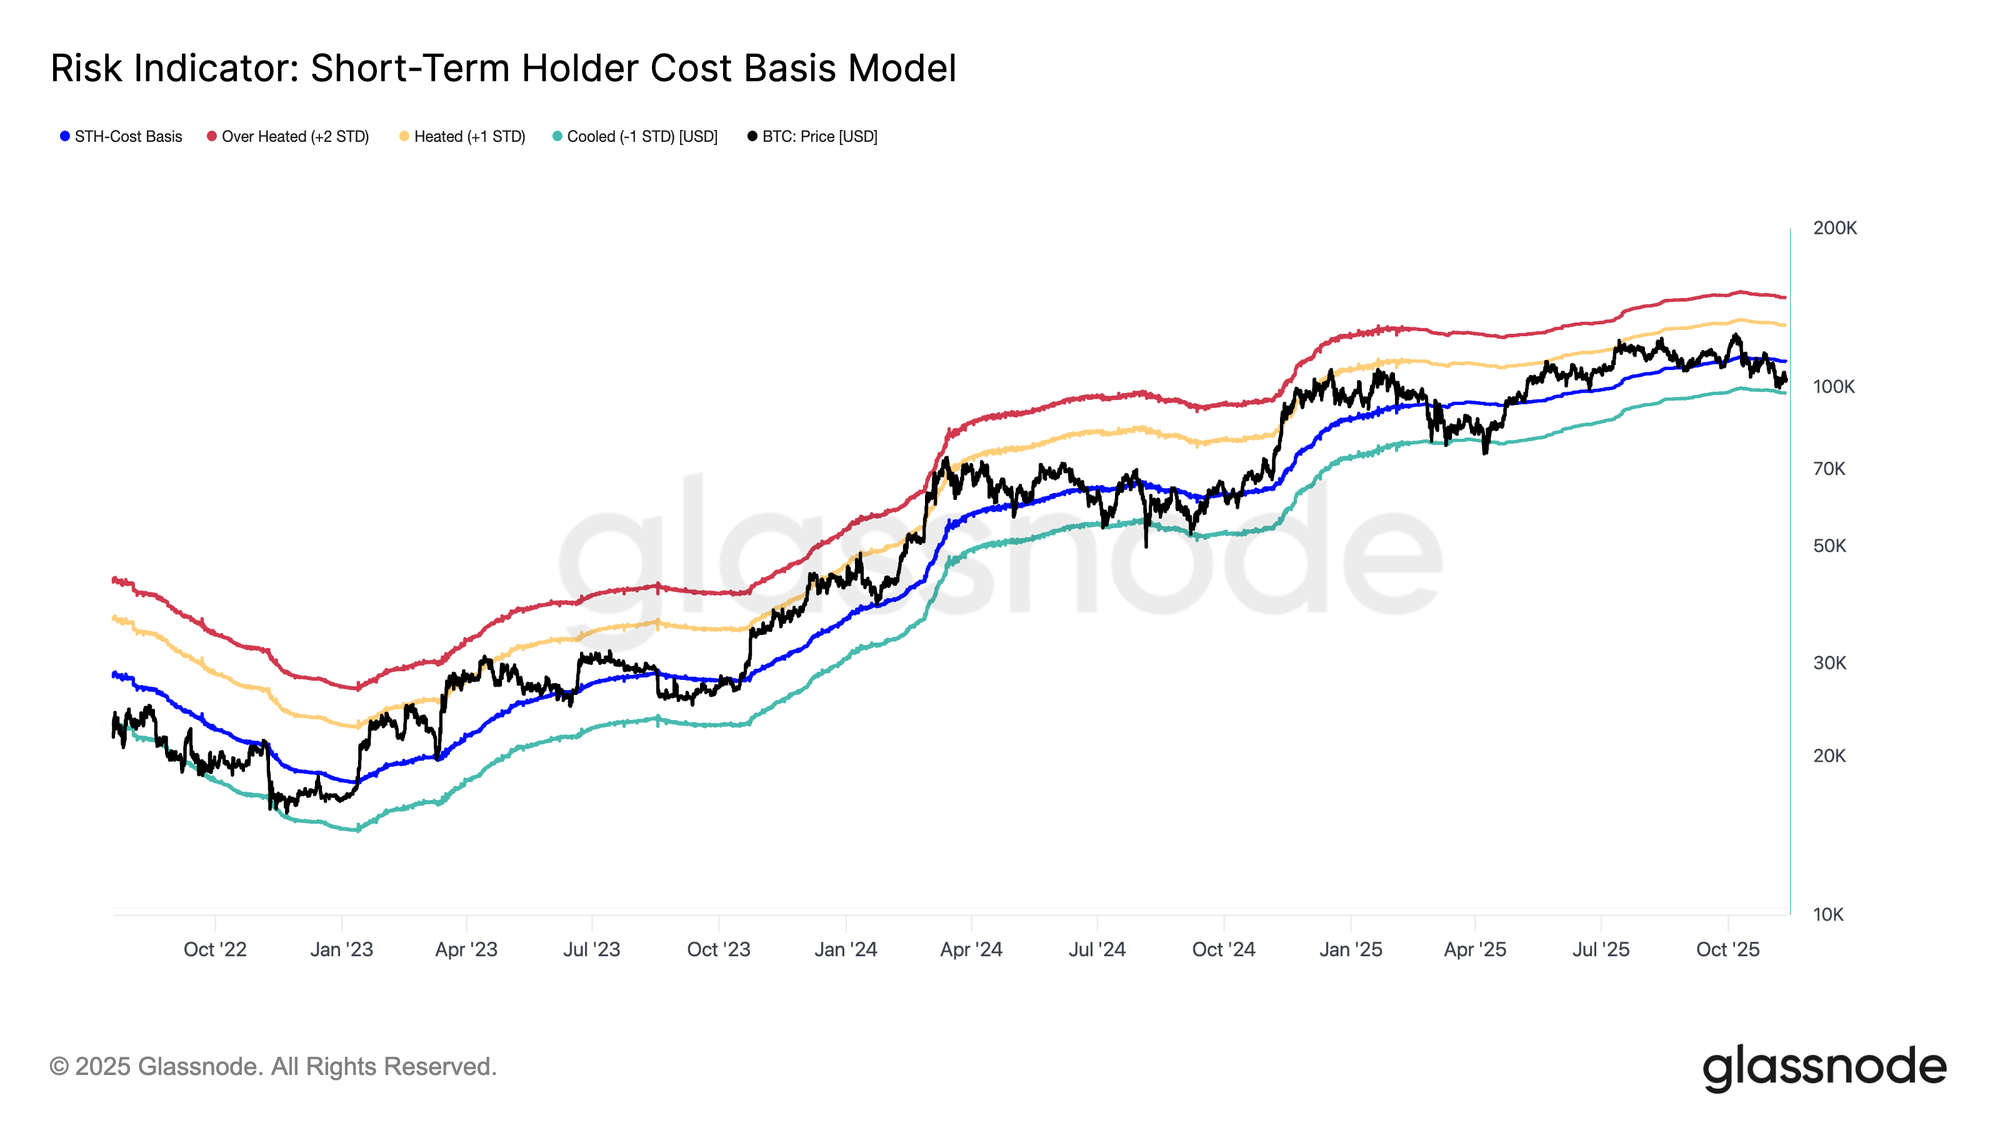
Since early October, with Bitcoin breaking below the short-term holder cost basis (🔵), a range suffering from the lack of conviction and low liquidity has been confirmed. Since then, price action has trended lower, approaching the -1 STD band near $97.5K.

This recent drawdown resembles the contraction phases seen during June–October 2024 and February–April 2025, where prices oscillated within a defined lower range before recovery. Consequently, unless Bitcoin reclaims the short-term holder cost basis (~$111.9K) as support, the probability of revisiting the lower bound of this range remains elevated.
Live Chart

Seller Exhaustion Near $100K

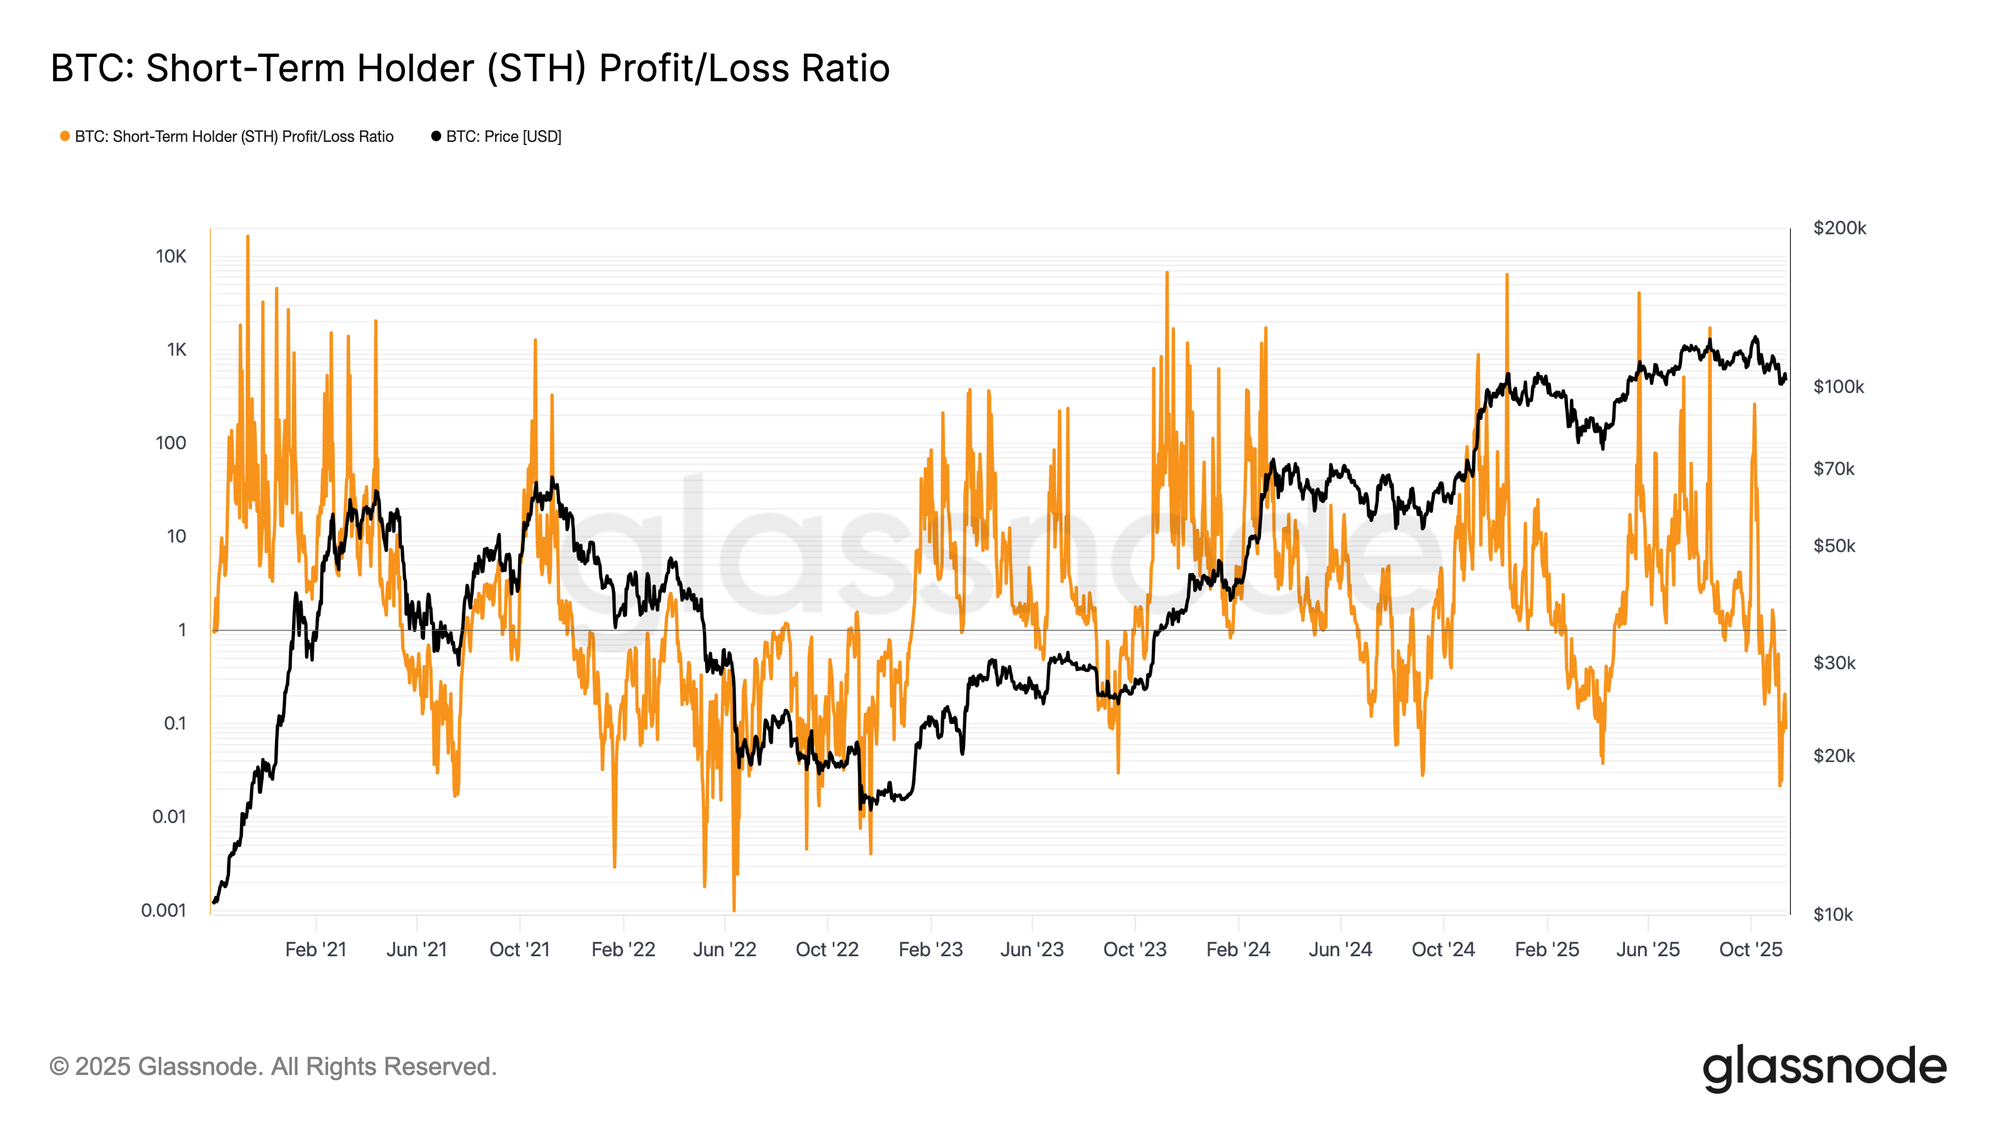
Building on this structural setup, the sub-$100K zone has emerged as a critical battleground where seller exhaustion is beginning to take shape. Much of the downward pressure stems from top buyers among short-term holders, who have been realizing heavy losses during the decline.

As Bitcoin tested $98K, the STH Realized Profit-Loss Ratio fell below 0.21, meaning over 80% of realized value came from coins sold at a loss. This intensity of capitulation briefly exceeded the last three major washouts of this cycle, underscoring how top-heavy the market has become and how pivotal the $100K level remains for near-term stability.
Live Chart

Fueling the Bounce Back

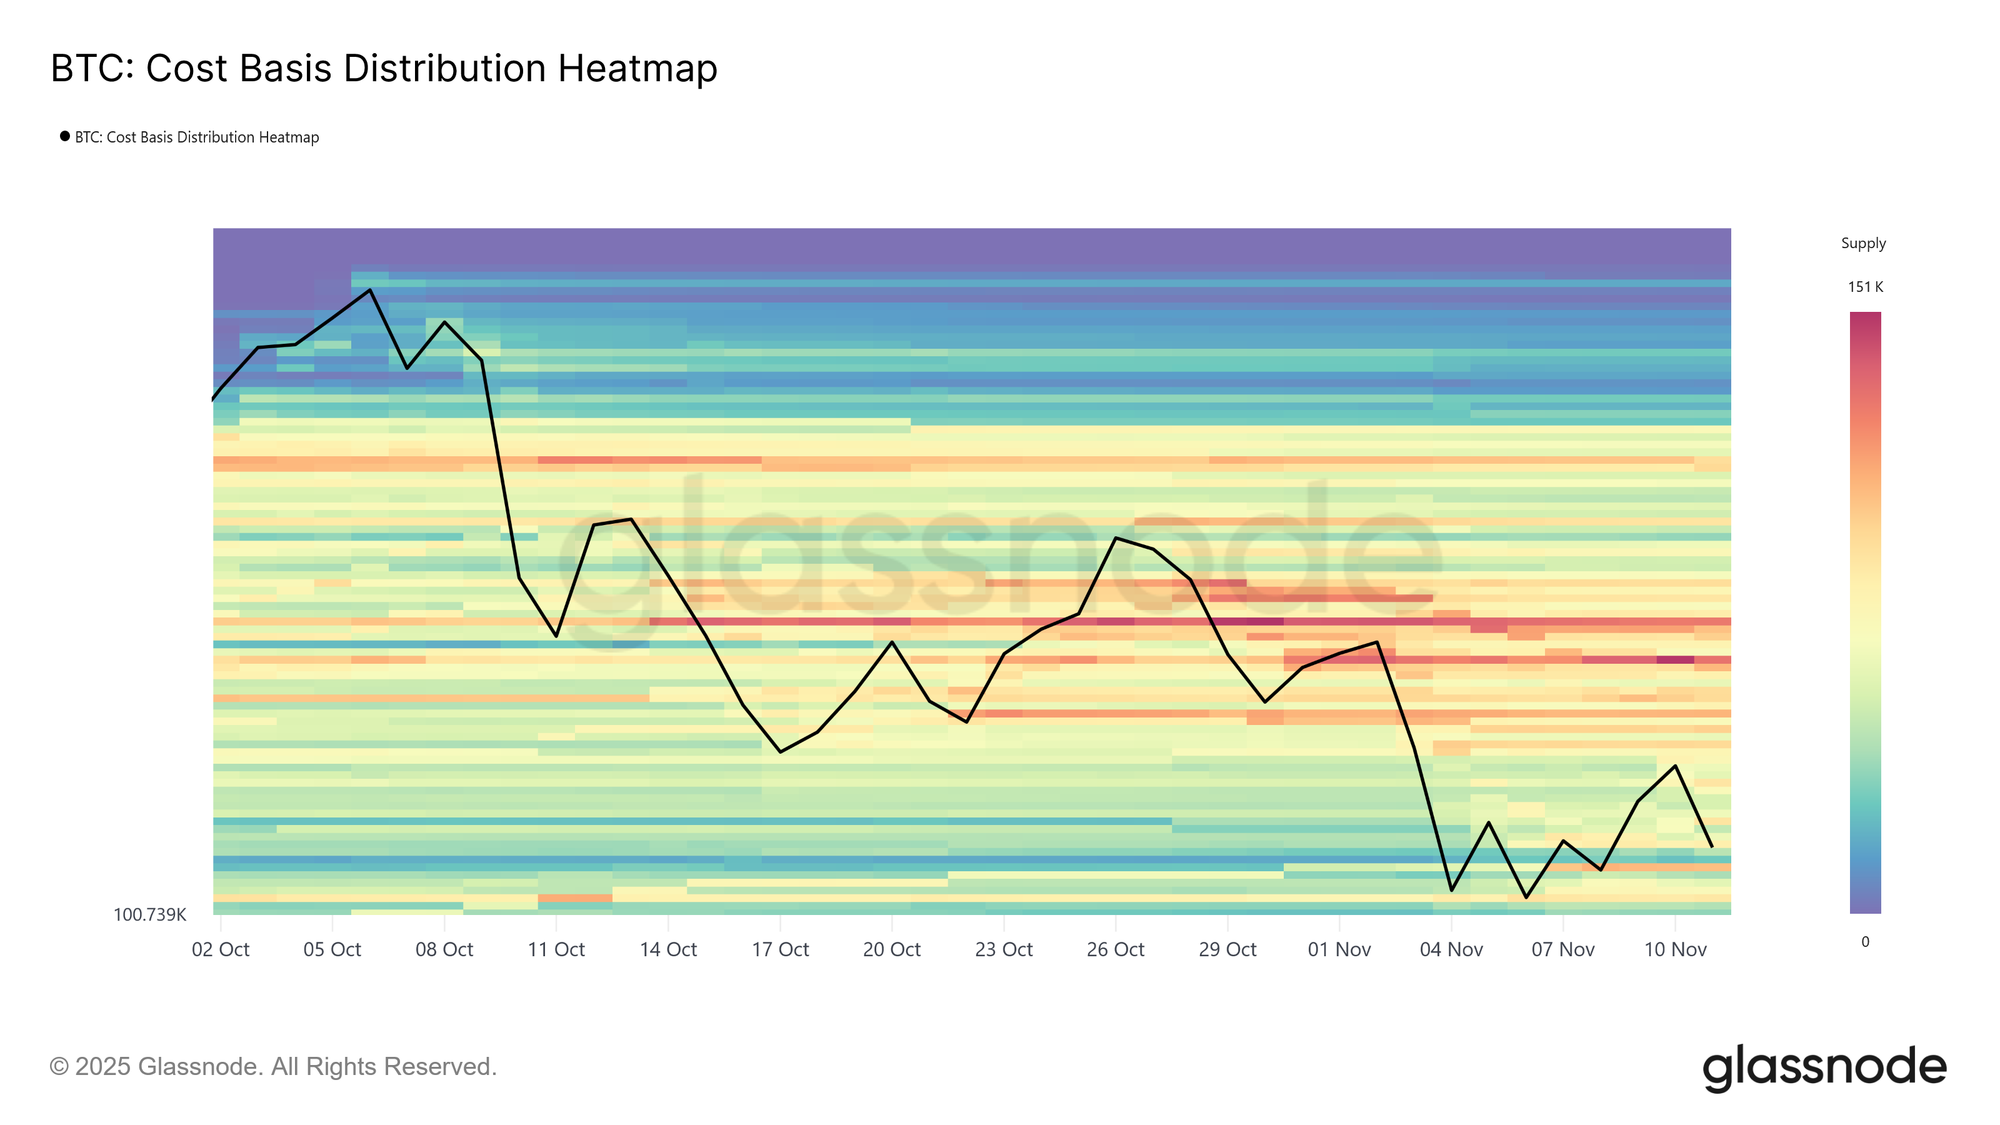
Turning to the demand side, the Cost Basis Distribution Heatmap reveals a clear buildup of realized supply around the sub-$100K zone, both before and after the rebound to $106K. The intensifying heat in this range signals renewed accumulation by buyers absorbing capitulation flows. This dynamic completes the picture; pairing seller exhaustion with steady accumulation, creating the foundation for a short-term recovery even within a broader bearish structure.

Conversely, a dense supply cluster between $106K and $118K continues to cap upward momentum, as many investors use this range to exit near breakeven. This overhang of latent supply creates a natural resistance zone where rallies may stall, suggesting that sustained recovery will require renewed inflows strong enough to absorb this wave of distribution.
Live Chart

Demand Fades, Resistance Builds

The current market structure confirms a continuation of the downtrend that began in early October. A dense supply zone above $106K continues to exert sell pressure, and reclaiming the short-term holder cost basis (~$111.9K) remains a key prerequisite for any sustainable shift toward recovery.

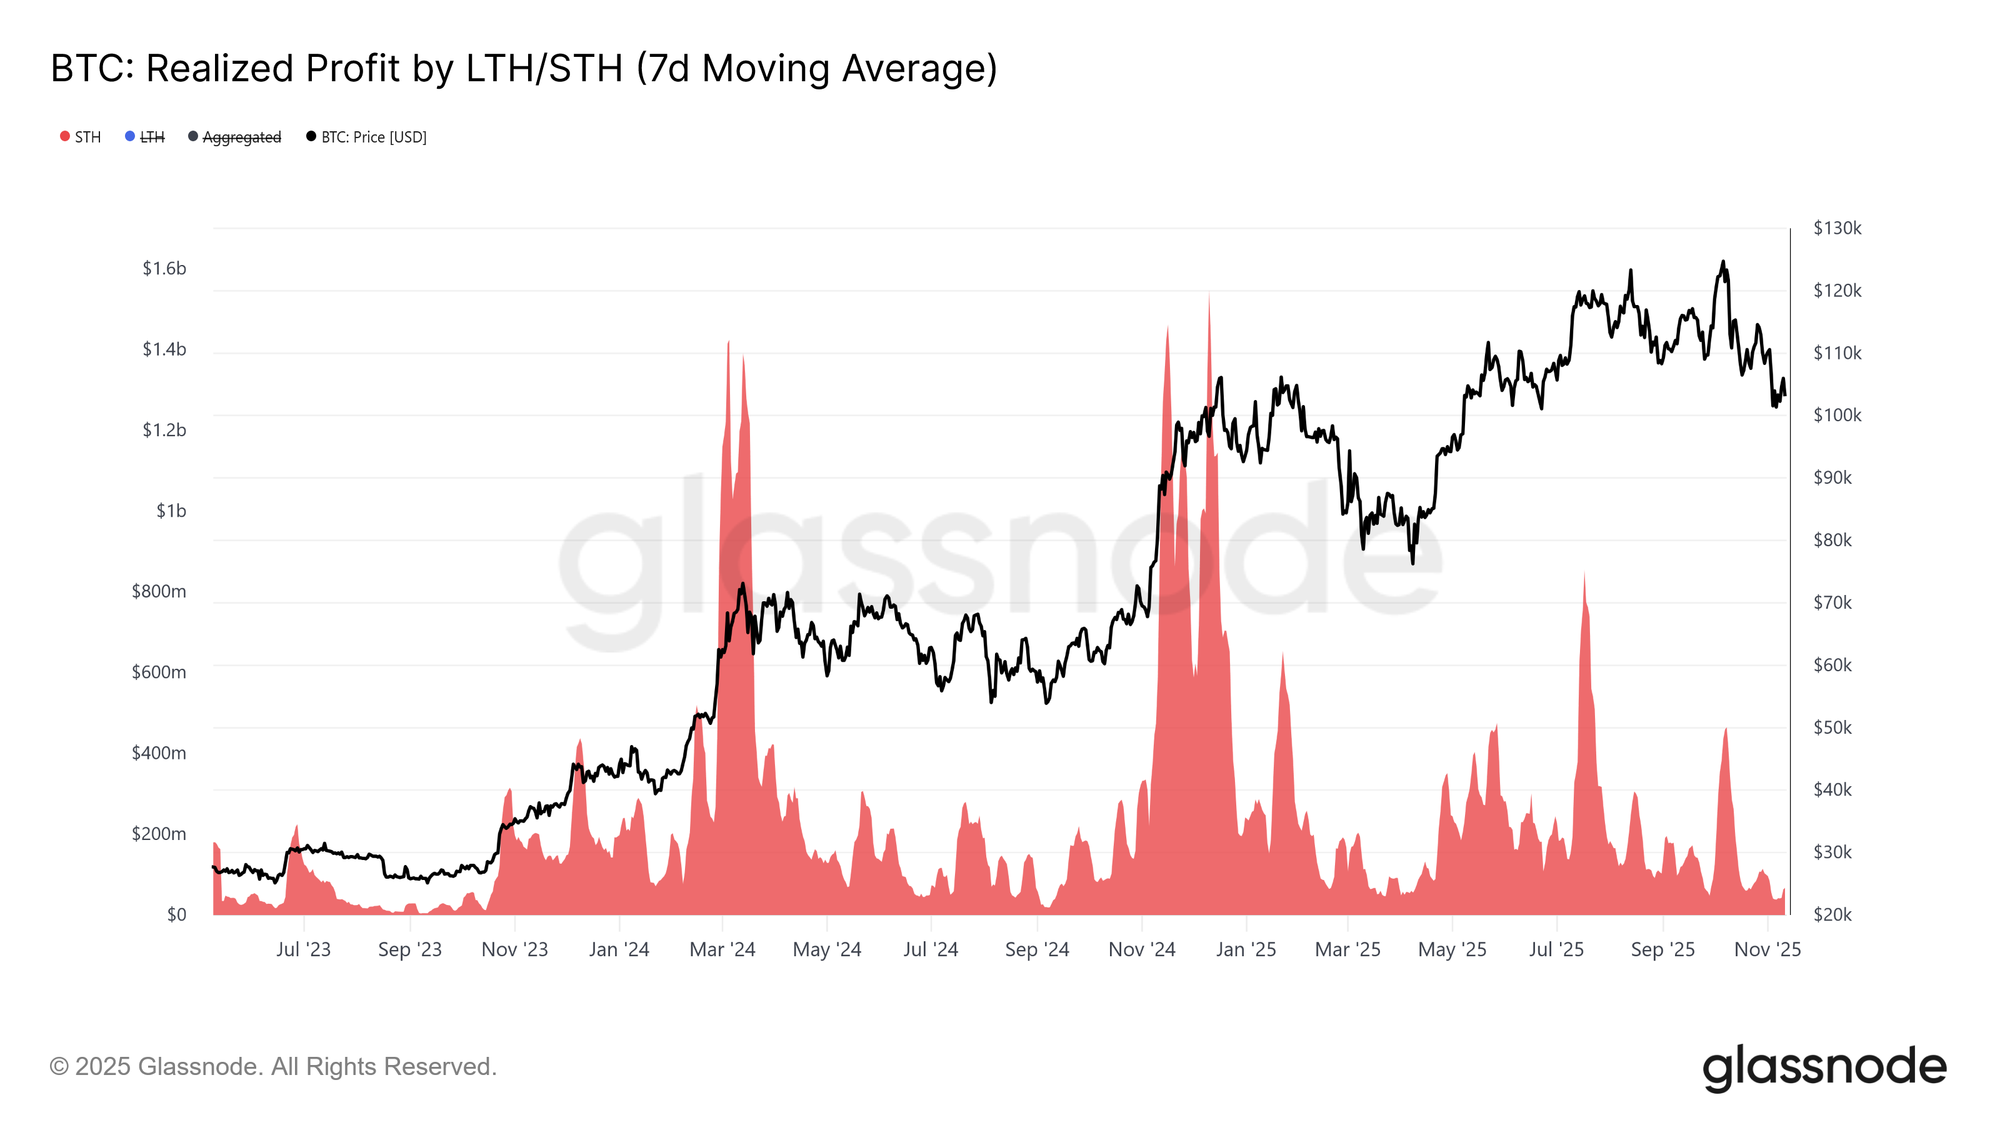
On the demand side, the Realized Profit of Short-Term Holders (a proxy for new investor momentum) has been notably weak since June 2025, reflecting a lack of fresh inflows. For Bitcoin to push through the $106K–$118K top-buyer cluster, this metric must reverse higher, signalling renewed conviction and stronger demand from new market entrants.
Live Chart

Off-Chain Insights

ETF Outflows Resurface

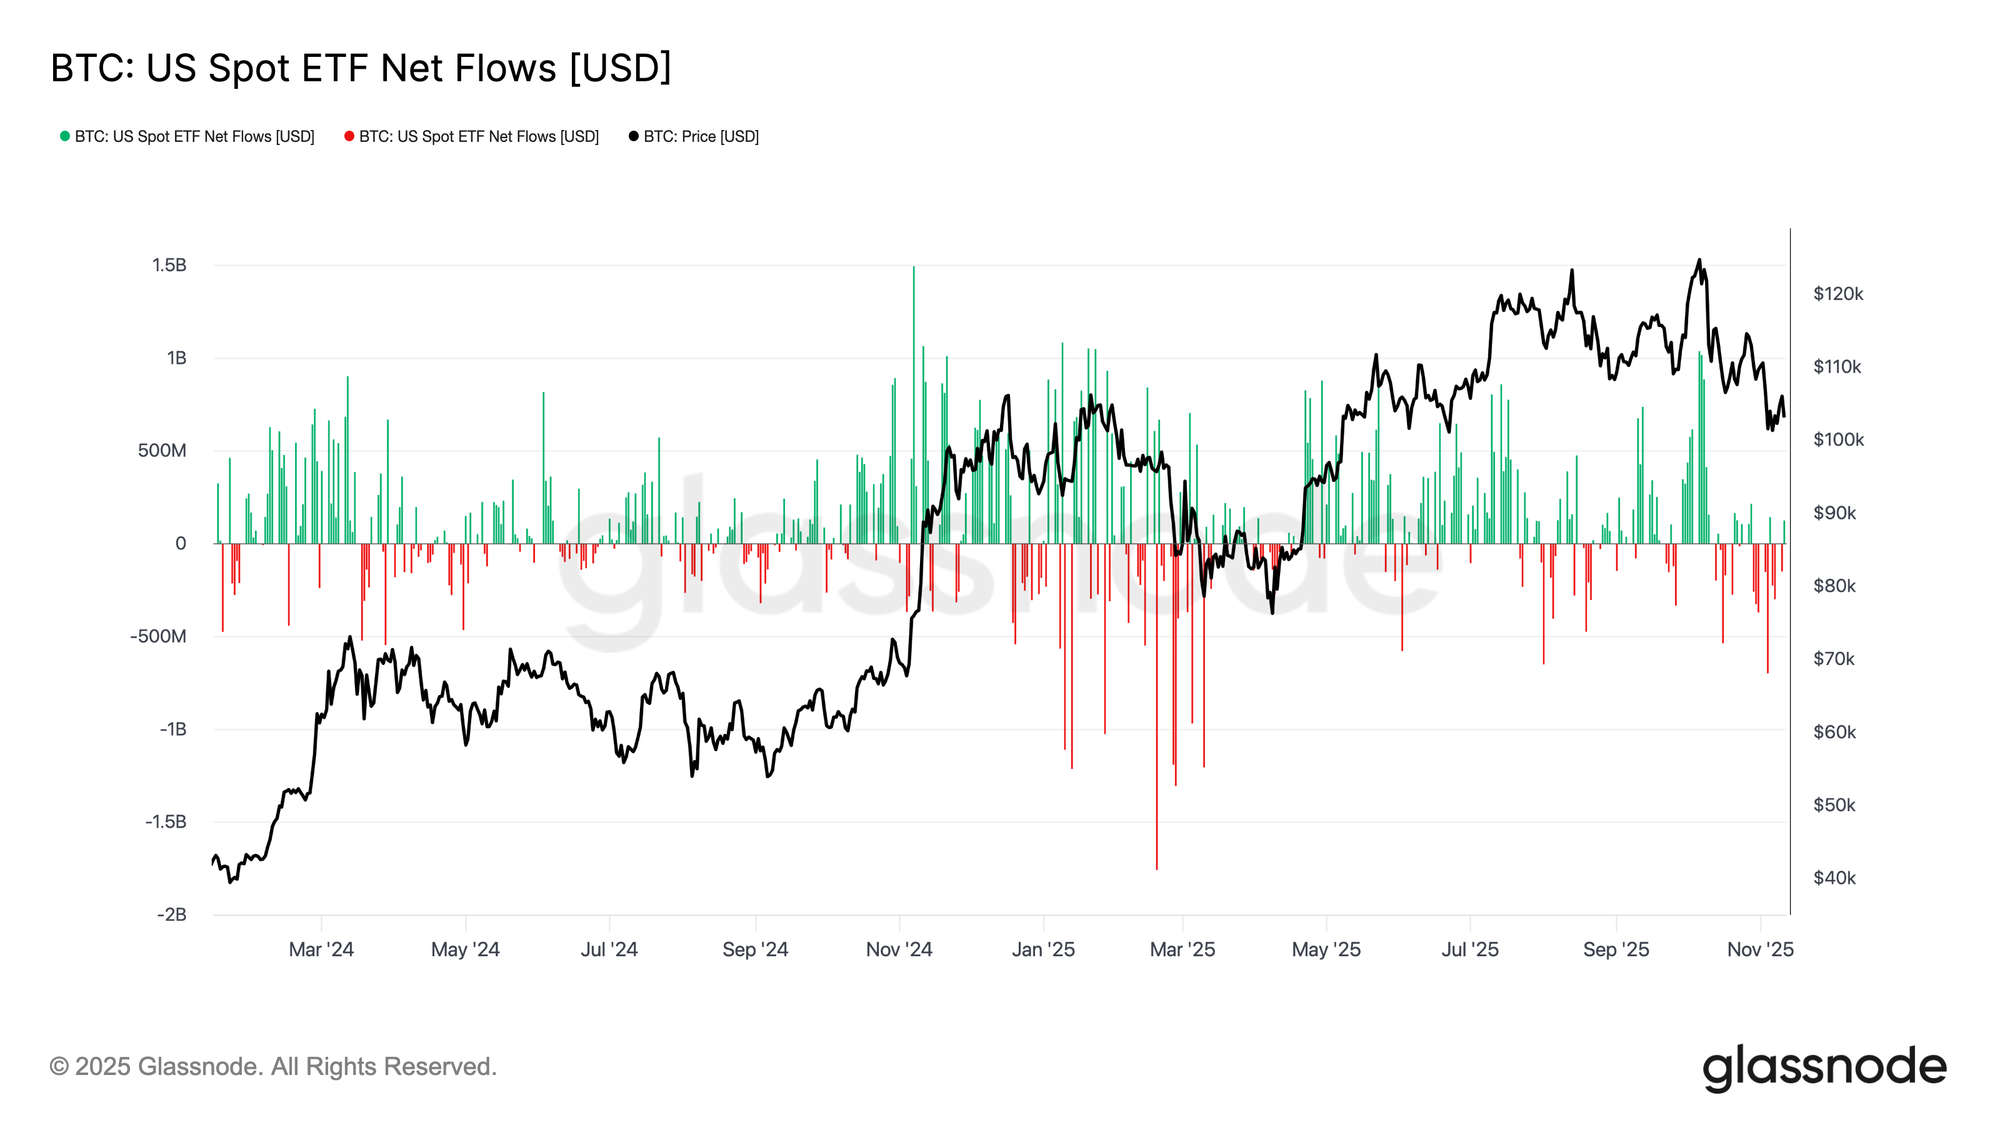
Transitioning to the off-chain section, we first gauge the U.S. spot Bitcoin ETF markets. US spot Bitcoin ETFs have shifted to modest outflows in recent weeks, mirroring muted price action and waning momentum. After strong mid-year inflows, aggregate demand has flattened, suggesting a pause in institutional accumulation.

Historically, such neutral flow regimes align with market consolidation, where conviction rebuilds before the next directional move. A decisive return of inflows would signal renewed institutional confidence, while prolonged outflows could reinforce a more defensive market tone.
Live Chart

Leverage Dries Up

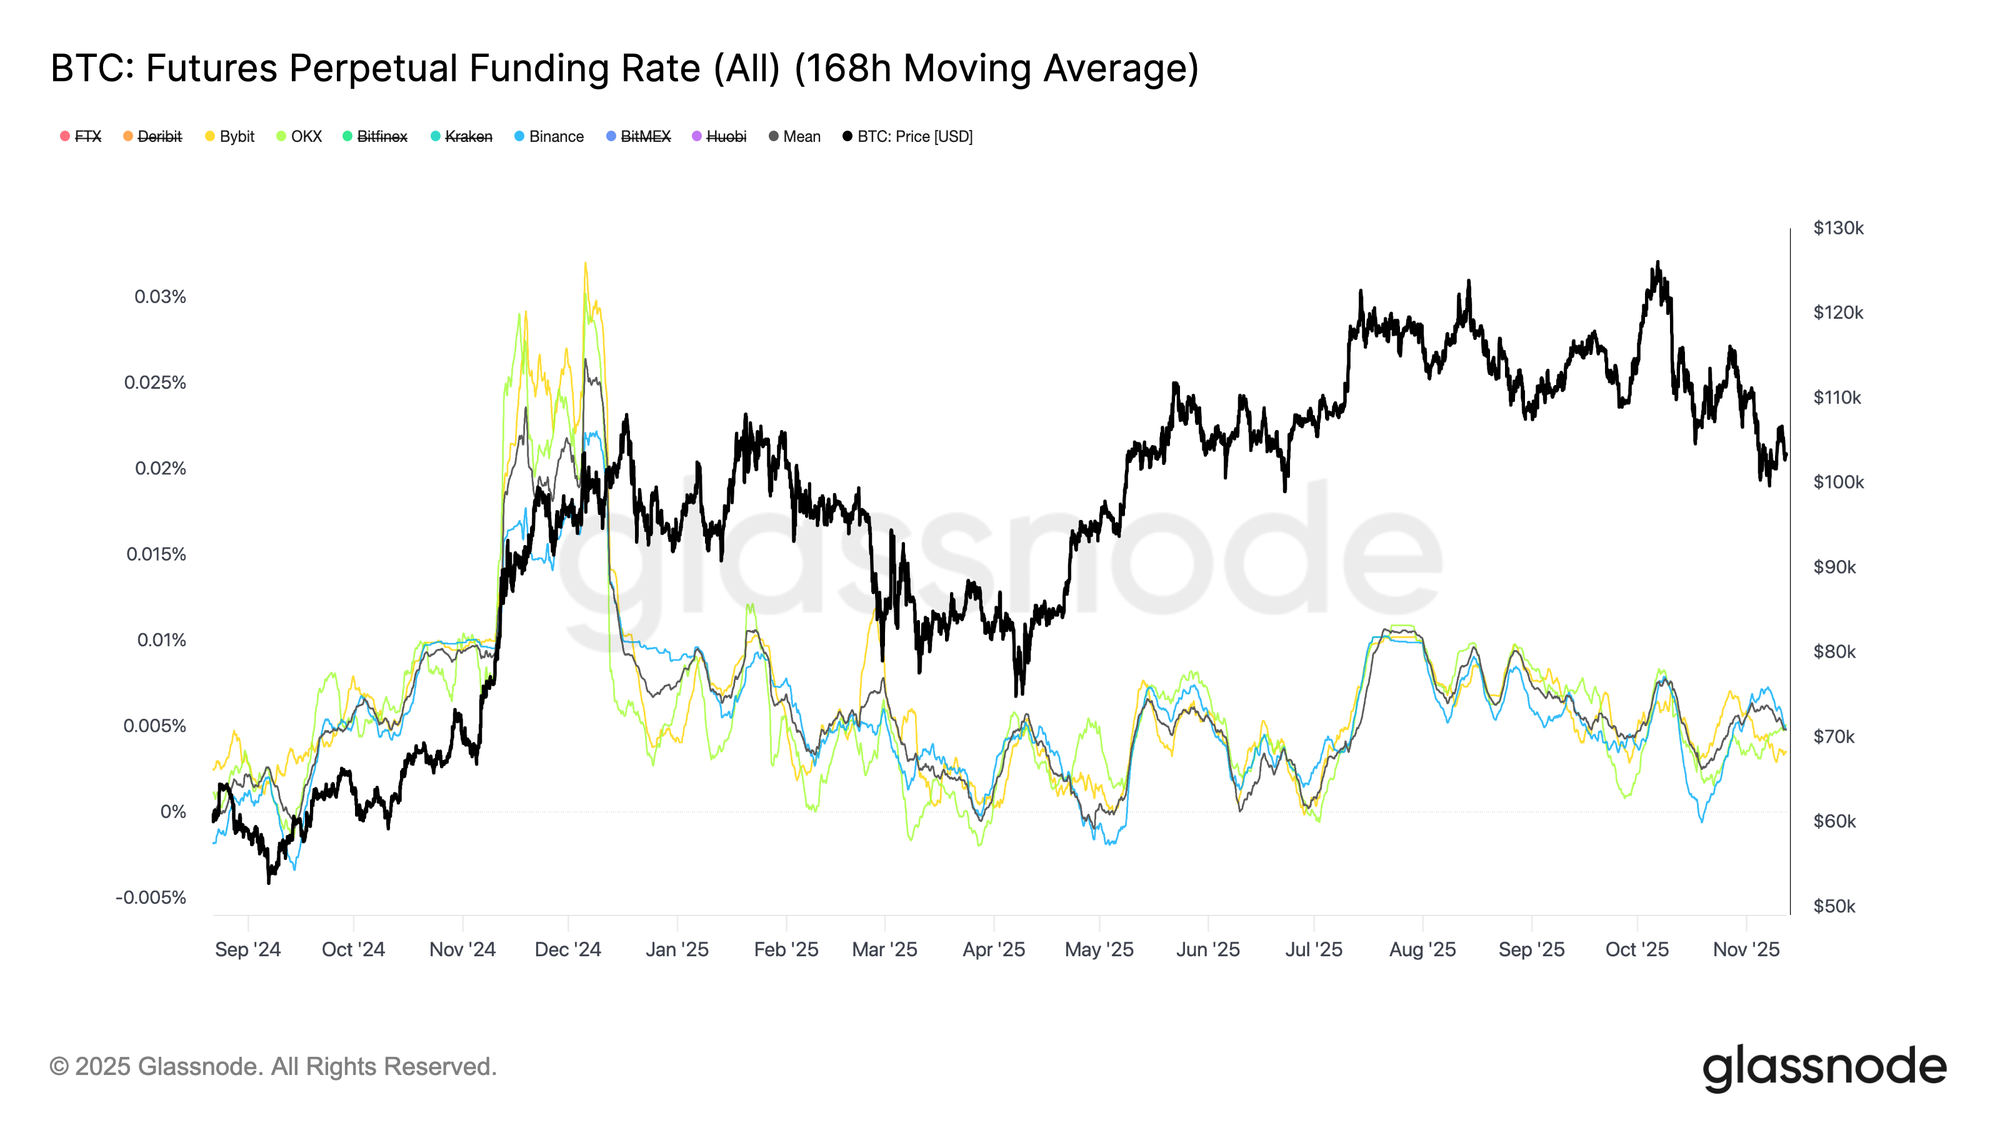
Bitcoin perpetual futures funding rates remain subdued across major exchanges, highlighting the lack of speculative appetite in derivatives markets. Since the leverage flush in October, both funding rates and open interest have drifted lower, signalling that traders are staying cautious with limited directional exposure.

This absence of aggressive positioning reflects a phase of market hesitation, often seen before volatility re-emerges. For now, the derivatives landscape remains quiet and balanced, leaning toward neutral sentiment rather than speculation-driven momentum.
Live Chart

Speculation Cools Broadly

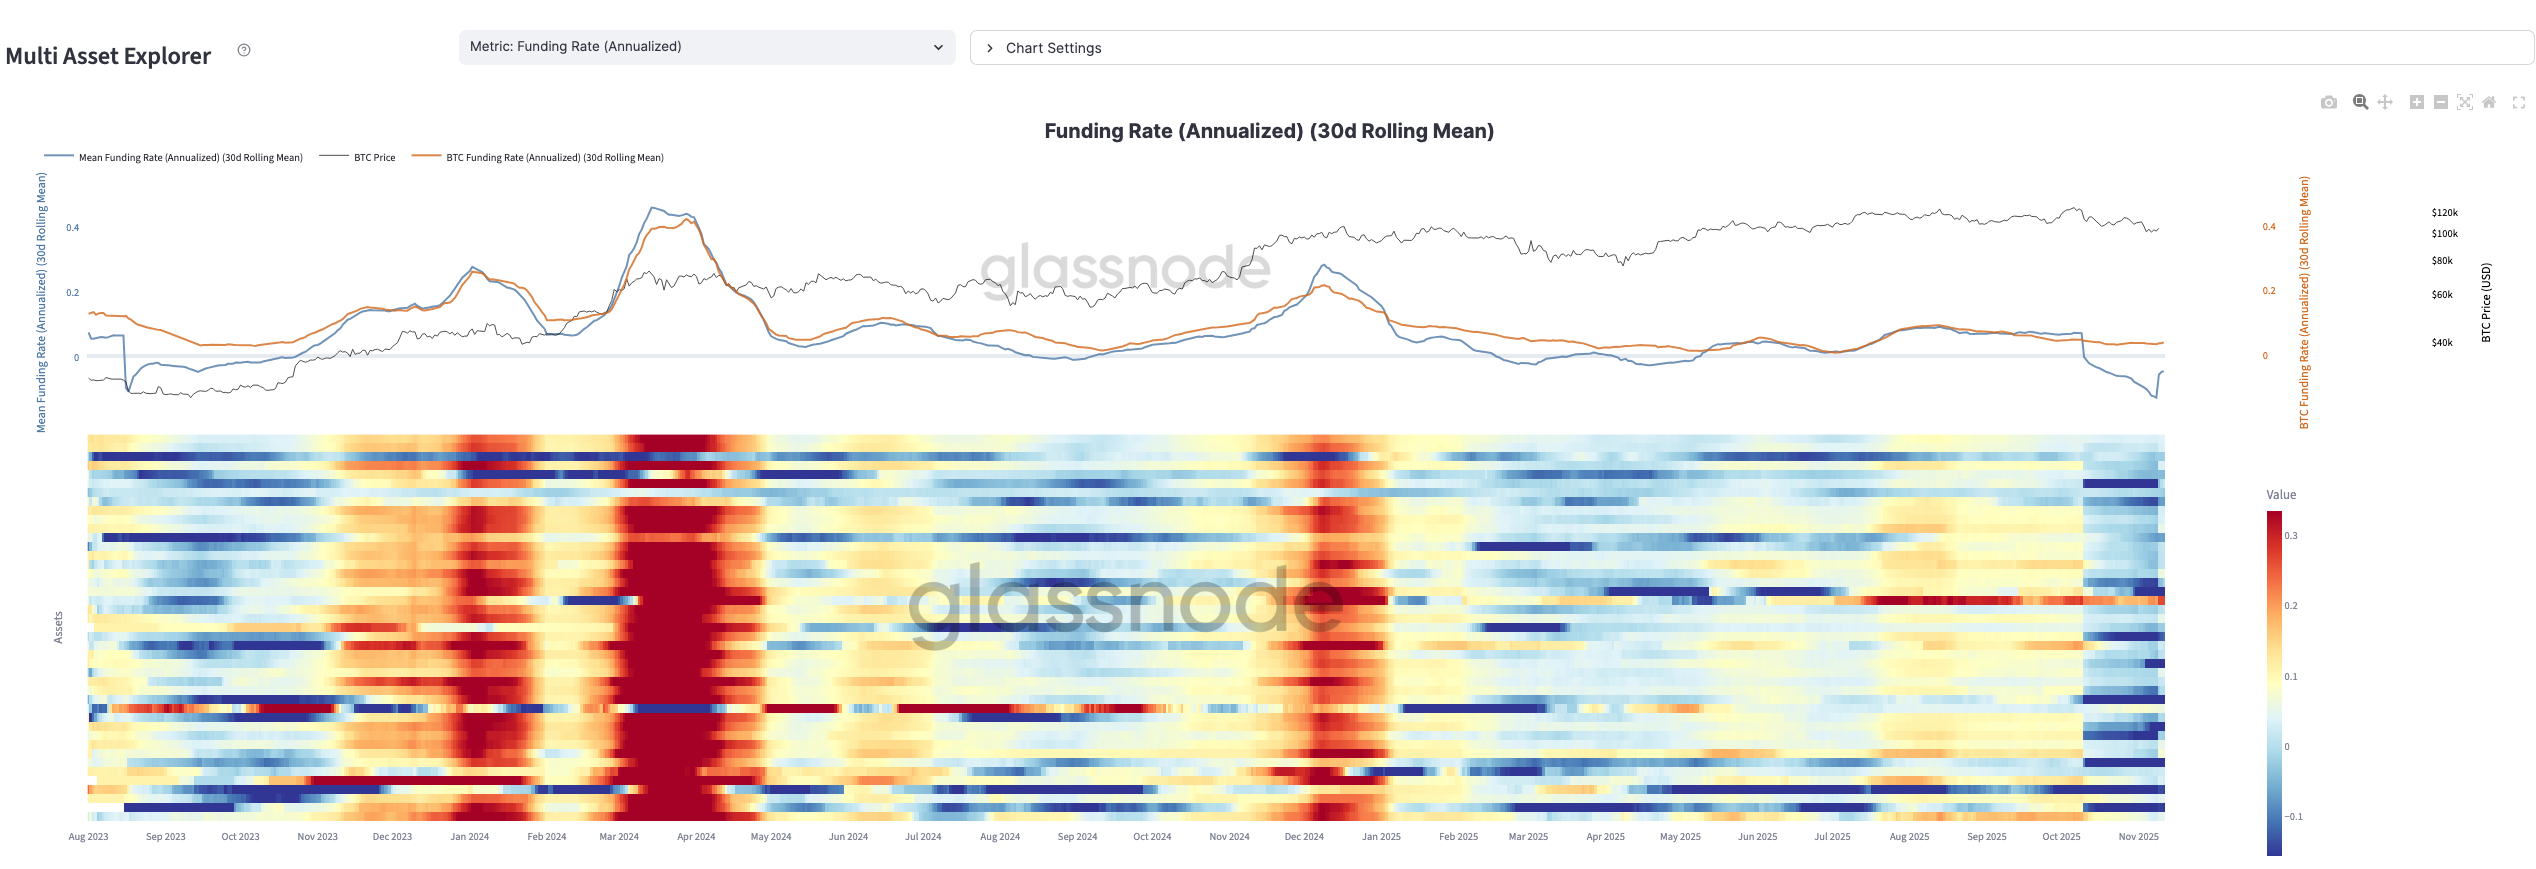
Speculators’ reluctance to use leverage for directional bets extends beyond Bitcoin. Using our newly launched Multi-Asset Explorer, we can assess key futures indicators, funding rates and open interest across the top 100 digital assets.

The first heatmap shows a clear cooling in market-wide funding intensity since mid-year, interrupted only by brief spikes. This broad moderation suggests that traders have de-risked, with leverage and conviction subdued across both Bitcoin and altcoins. Overall, derivatives sentiment remains cautious, and liquidity continues to thin across the board.
Live Chart

Open interest trends across digital asset futures reveal a sharp decline in speculative engagement, most evident in altcoin markets. The heatmap shows a sustained dominance of blue tones, reflecting ongoing contraction in open interest and a clear absence of risk appetite.

While Bitcoin maintains relatively stable positioning, leverage in altcoins has unwound to near cycle lows, with little sign of fresh capital rotation. This pattern underscores a defensive stance among traders, prioritizing capital preservation over speculation. In essence, altcoin derivatives activity has thinned materially—positioning remains light, conviction low, and market attention firmly centred on Bitcoin.

Live Chart

Put Protection Still in Demand

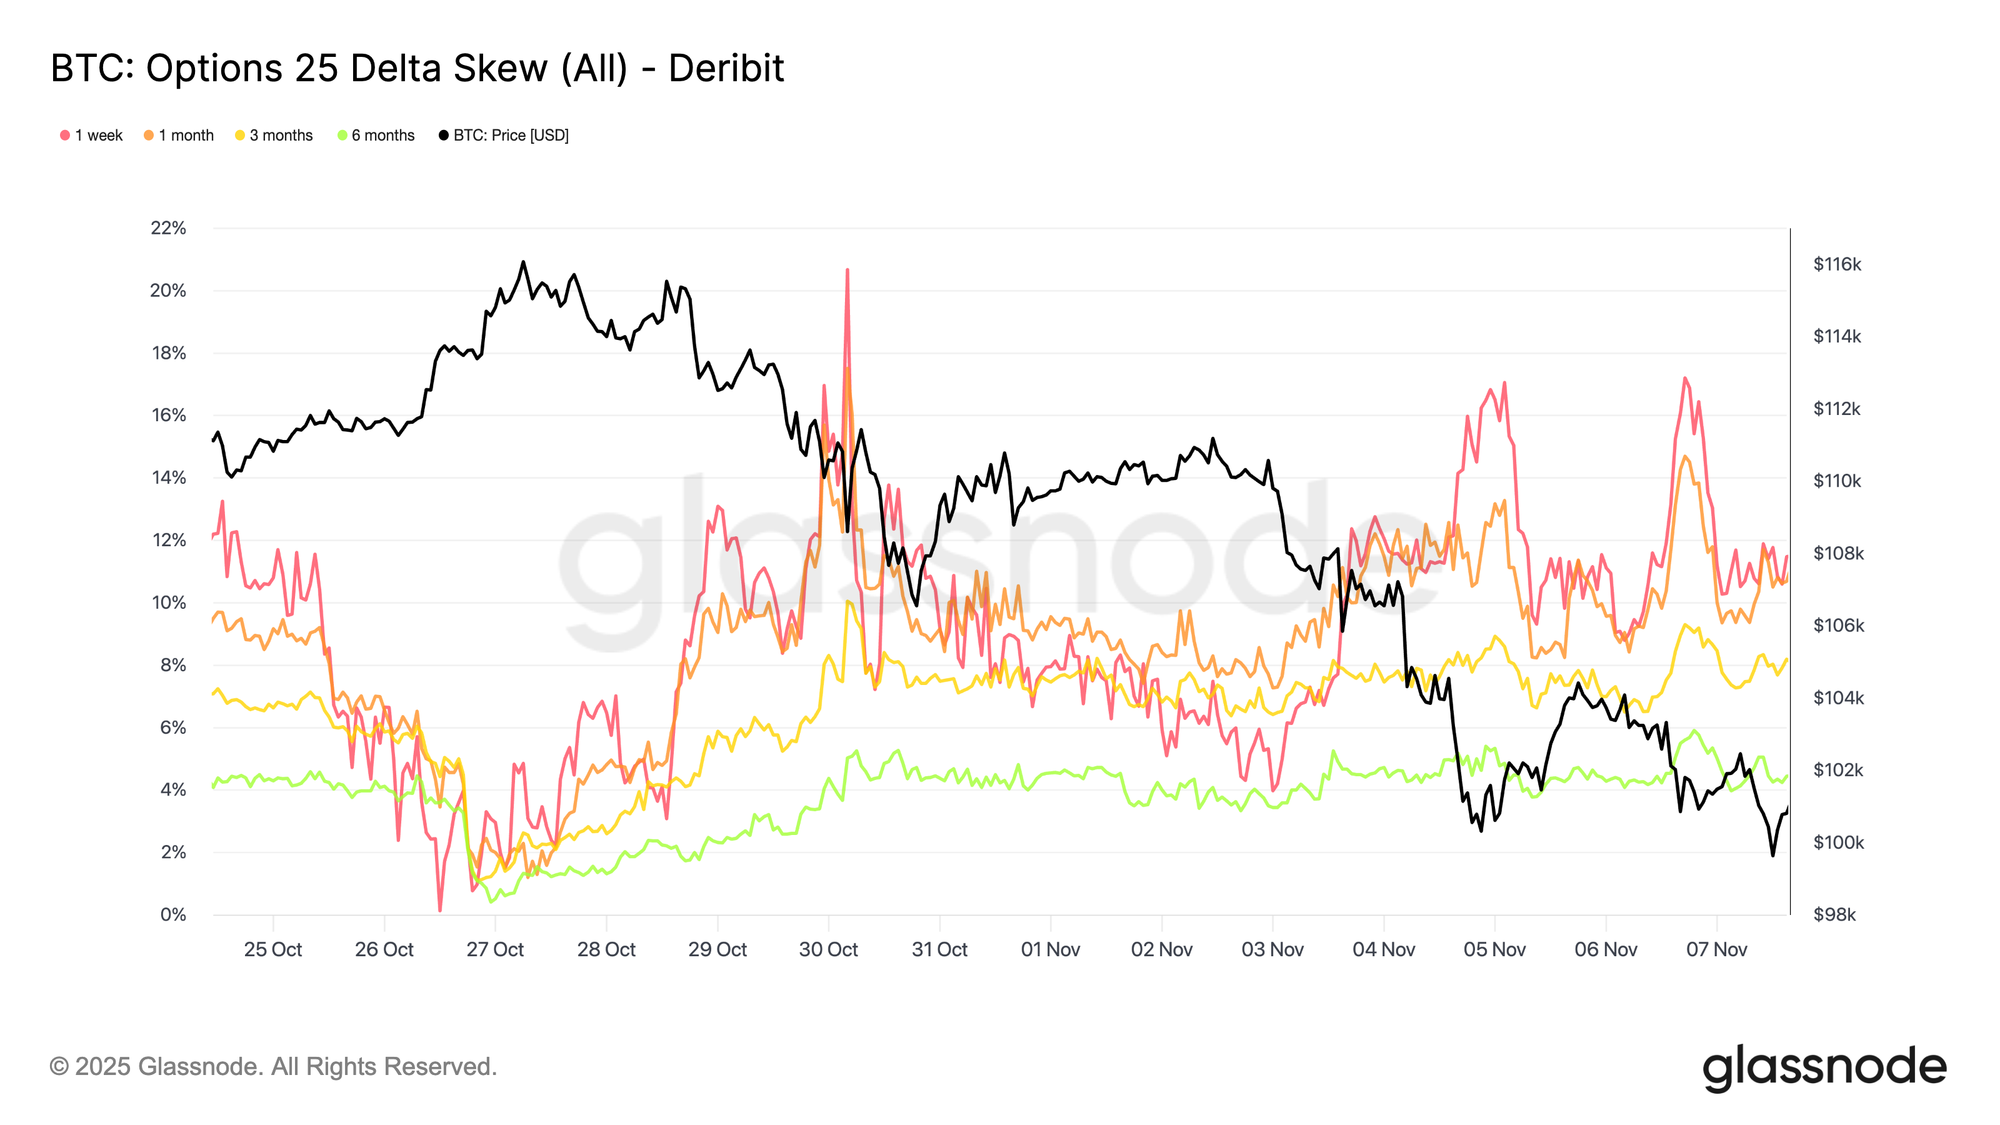
Put protection remains elevated, indicating traders continue to pay a premium for downside insurance. Hedging remains the dominant theme, with short-term expiries pricing roughly 11% implied volatility skew in favour of puts. Three-month and six-month expiries show a softer bias, with 8 and 4 volatility points of downside preference, respectively.

For now, the absence of a clear catalyst limits the potential for skew to shift in favor of calls. The options market continues to price in a retest of the $100K level and a potential break below. However, what will ultimately matter is how the market reacts if that test occurs, rather than the mere pricing of the event.
Live Chart

Implied Volatility in a Range

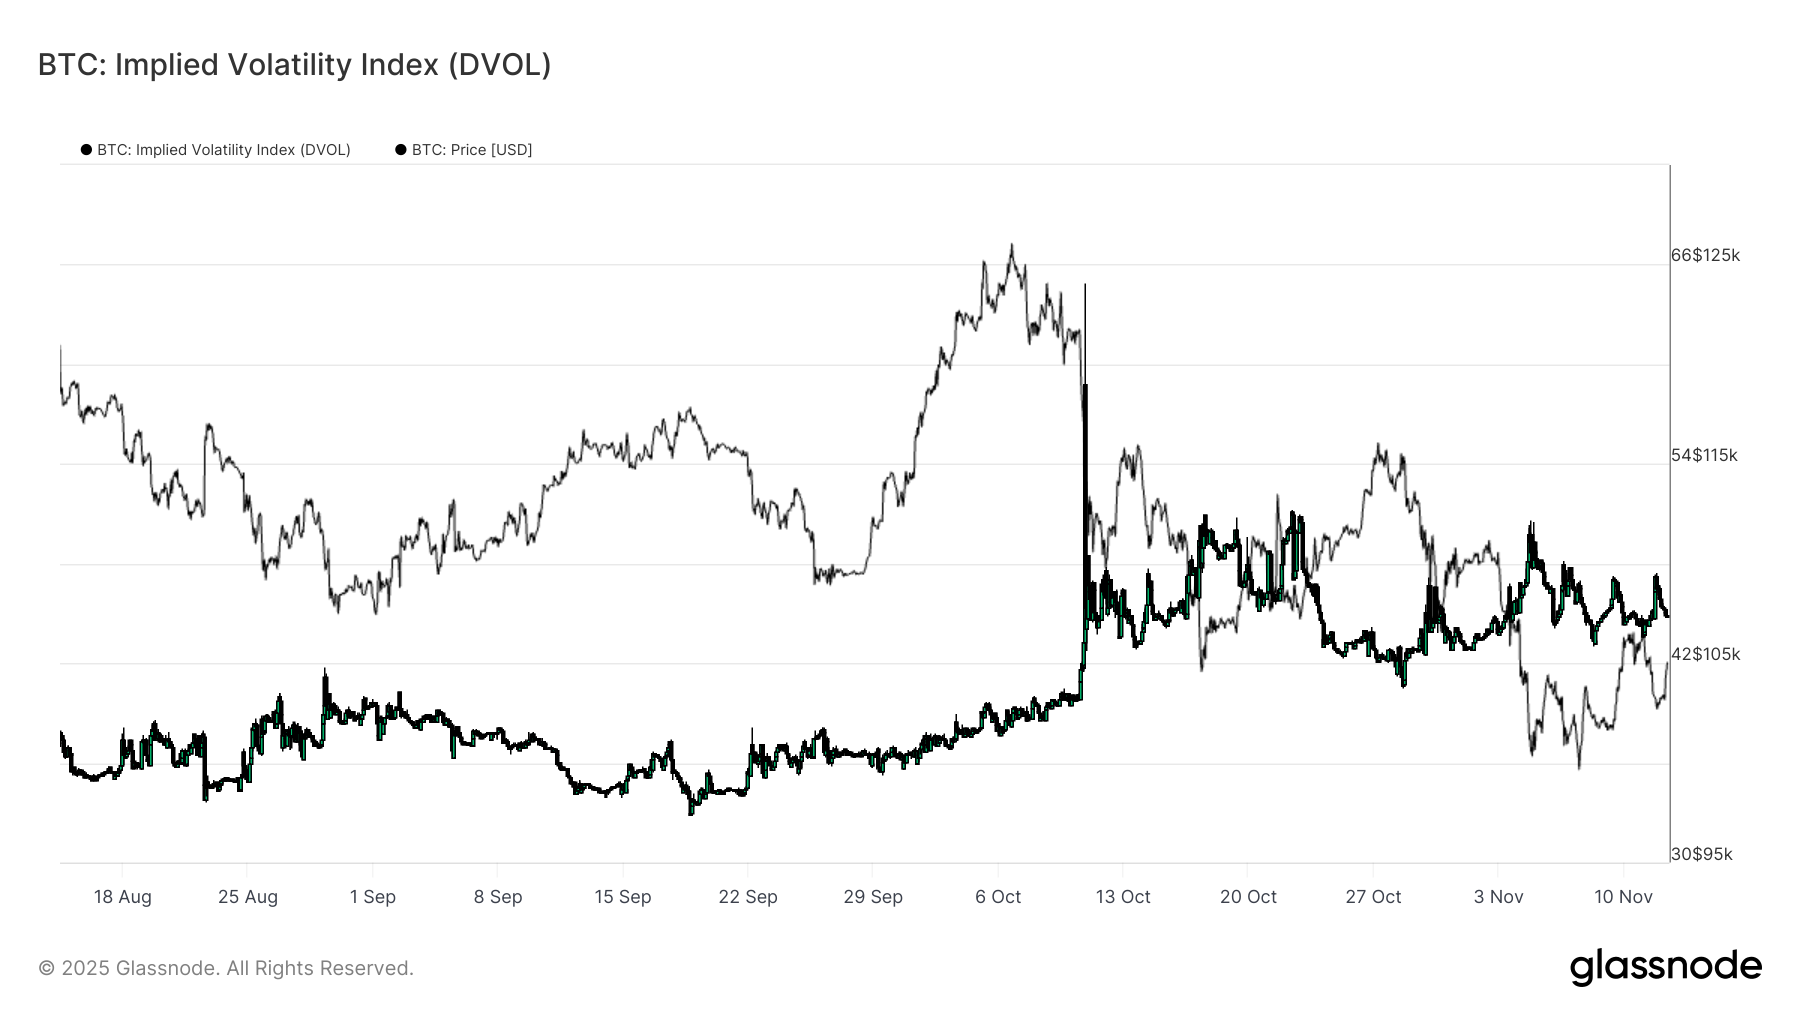
Transitioning from skew to volatility, the broader volatility environment has settled into a holding pattern. The DVOL, Bitcoin’s implied volatility index that measures the market’s expectation of future volatility derived from options prices, remains elevated but range-bound.

Since the October 10 liquidation event, volatility has shifted to a higher regime, oscillating between 40 and 50. This range suggests that the market has adjusted to a higher baseline of uncertainty without entering a state of panic. Volatility remains supported by macroeconomic risk factors and cautious sentiment; however, the absence of further expansion points to consolidation rather than capitulation.
Live Chart

The $100K Line of Defense

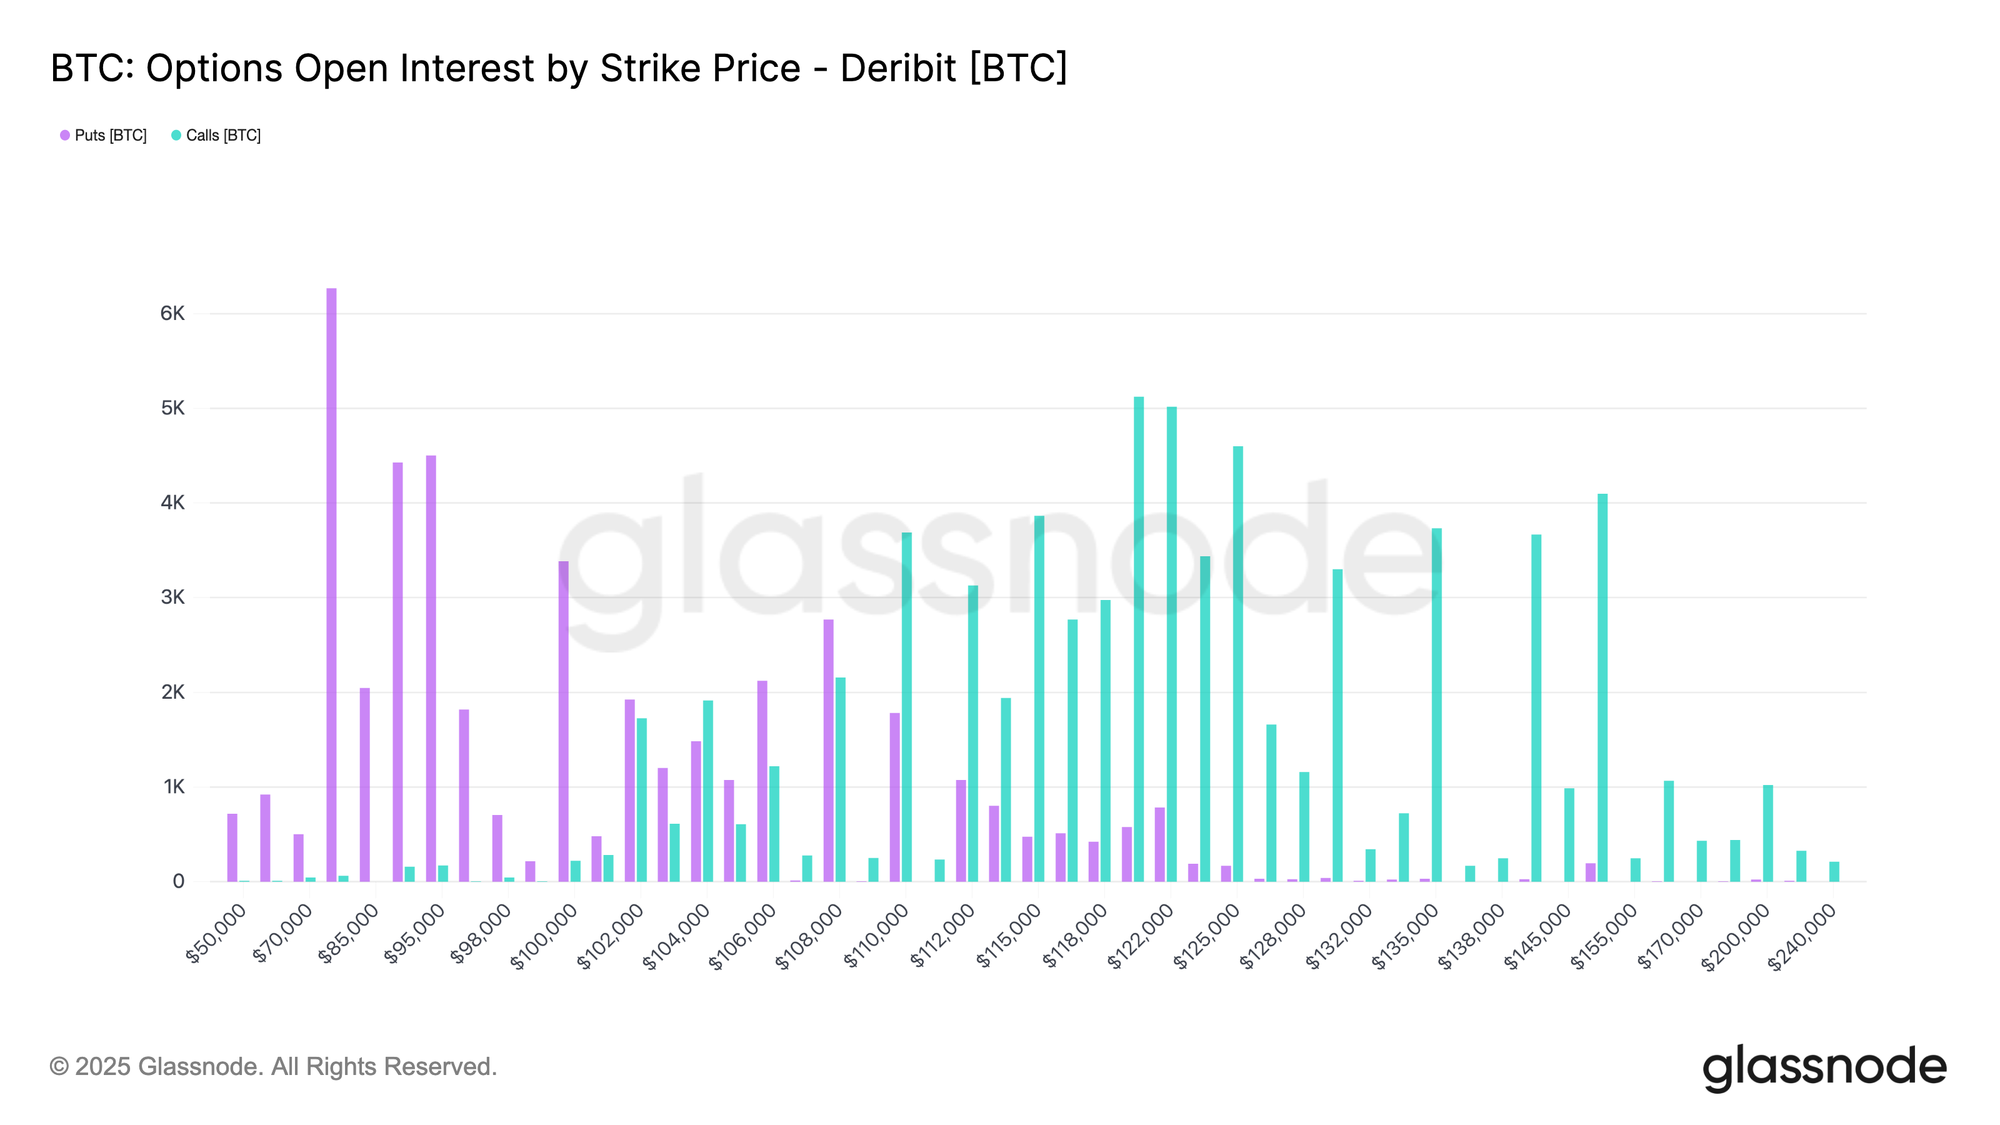
Looking at the end-of-November expiry, open interest clusters heavily around and just below the $100K strike, making it a critical battleground. A decisive break below this level could trigger dealer hedging flows that amplify downside volatility.

If spot retests the $100K area, brief intraday dips below are possible, but a sustained close beneath this threshold would likely mark a shift toward extreme bearish sentiment and potentially ignite another wave of volatility.
Live Chart

Flows Reflect Short-Term Protection Bias

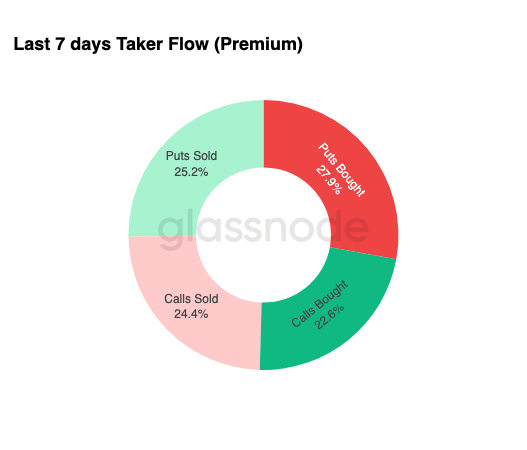
Finally, option flows over the past week reinforce this cautious positioning. Activity was concentrated on the put side, with notable buying between the 108K and 95K strikes.

Some flows reflected outright long protection, such as the 100K strike expiring November 28, while others were structured as calendar spreads, for example, buying the 108K November expiry while selling the 108K December expiry. This pattern effectively captures the current stance; traders anticipate near-term turbulence but remain neutral to moderately optimistic over the longer term.
Live Chart

Options Traders’ Psychology

The next potential catalyst is the resolution of the U.S. government shutdown, an outcome that would likely be welcomed by markets. However, ongoing tariff tensions are expected to keep volatility elevated through Q4. Until the December 10 FOMC meeting, risk appetite is likely to remain muted, as the event is broadly perceived as neutral.

For traders, the 25-delta skew remains the primary gauge for tracking shifts in sentiment. A sustained flattening or reversal toward call bias would signal that market participants are beginning to regain confidence in the upside.

Conclusion

Bitcoin continues to trade within a mild bearish range, defined by strong resistance between $106K–$118K and key structural support near $97.5K–$100K. The market remains under the influence of top-heavy supply, with short-term holders still realizing losses. On-chain data highlighted a brief accumulation near $100K, suggesting localized support, yet without a decisive reclaim of the short-term holders’ cost basis (~$111.9), upside momentum is likely to stay constrained.

Off-chain indicators also echo this cautious tone. ETF outflows, muted funding rates, and low open interest point to subdued speculative engagement, while options traders continue to favor downside protection around the $100K line.

Overall, both on-chain and off-chain signals portray a market in a state of consolidation, stabilizing yet not yet ready to confirm a bullish reversal. Until renewed inflows or a clear macro catalyst emerge, Bitcoin appears bound to oscillate within this $97K–$111.9K corridor, with $100K remaining the psychological line of defence.


Disclaimer: This report does not provide any investment advice. All data is provided for informational and educational purposes only. No investment decision shall be based on the information provided here, and you are solely responsible for your own investment decisions.

Exchange balances presented are derived from Glassnode’s comprehensive database of address labels, which are amassed through both officially published exchange information and proprietary clustering algorithms. While we strive to ensure the utmost accuracy in representing exchange balances, it is important to note that these figures might not always encapsulate the entirety of an exchange’s reserves, particularly when exchanges refrain from disclosing their official addresses. We urge users to exercise caution and discretion when utilizing these metrics. Glassnode shall not be held responsible for any discrepancies or potential inaccuracies. 

Please read our Transparency Notice when using exchange data.

Trend Kriptolar

İlgili Okumalar

30 Years After Being Crushed by AI, People Have Fallen Back in Love with Chess

On May 11, 1997, IBM's "Deep Blue" defeated chess champion Garry Kasparov, marking the first time a machine triumphed in a top-level intellectual game. The narrative of human defeat by AI seemed cemented when AlphaGo beat Lee Sedol in Go in 2016, a game once considered AI's final frontier. Yet, nearly 30 years after AI's dominance began, chess is experiencing unprecedented popularity. Chess.com boasts over 250 million registered users and 10 million daily active players. Its CEO, Erik Allebest, attributes this resurgence to several waves: the pandemic, the Netflix series *The Queen's Gambit*, and viral AI chess bots like "Mittens" on social media. Crucially, each surge left a permanently higher user base. The key insight is that AI liberated the game. When machines unequivocally became the best, the pressure to "win" as the ultimate human was removed. Chess returned to its core: the intrinsic joy of play—the thrill of a tactical combo, the tension of a time scramble, the curiosity of post-game analysis. AI, now serving as an always-available coach and anti-cheat tool, became infrastructure that enhanced rather than killed the experience. In contrast, Go, deeply rooted in East Asian elite culture and often pursued for mastery and status, suffered a "collapse of meaning" at the professional level after AlphaGo. Players began mimicking AI moves, erasing distinctive styles and narrative. While some Go players gained fame as online personalities, it didn't translate to widespread engagement with the game itself. The divergence highlights a fundamental question in the age of AI: is the motivation for an activity about *winning* or *playing*? Activities where the process itself is the reward, like chess, can thrive when the pressure of being the best is gone. AI may rightly take over tasks done purely for outcome, but it cannot replace the human experience of simply enjoying the game.

marsbit3 dk önce

30 Years After Being Crushed by AI, People Have Fallen Back in Love with Chess

marsbit3 dk önce

Exiting Top Ten Shareholders of Kweichow Moutai, 'Long-term Capital' Portfolio Adjustments Revealed: National Social Security Fund Enters 12 New Stocks, Invests in Hard Tech Mthreads

With the ongoing release of semi-annual reports, the second-quarter investment moves of long-term institutional investors like the National Social Security Fund (NSSF) and insurance capital are becoming clear. Central Huijin Asset Management and China Securities Finance Corp., often referred to as the "national team," are no longer among the top ten shareholders of Kweichow Moutai. Data shows that as of August 14th, the NSSF held positions in 33 A-share companies, with a total portfolio value exceeding 11 billion yuan. It added 12 new stocks in Q2, spanning sectors like chemicals, food & beverage, and semiconductors. The NSSF maintains its stable investment style, favoring companies with solid performance and attractive valuations. Apart from exiting Moutai, Huijin and China Securities Finance also left the top ten shareholder lists of companies like Ping An Bank and Dahua Technology. Insurance capital heavily invested in 41 companies in Q2, with a total holding value over 26 billion yuan. They showed a continued preference for cyclical sectors like non-ferrous metals and chemicals, as well as high-dividend-yield stocks. Analysts note that these long-term funds act as market stabilizers and investment bellwethers. Their presence is reshaping the market ecology, steering focus towards fundamental corporate value and away from speculative trading. A notable move was the NSSF's new investment in Moore Threads, a loss-making but leading domestic GPU design company listed on the STAR Market, indicating interest in hard technology sectors. Looking ahead, analysts expect long-term capital to continue a dual-strategy: maintaining a foundation in high-dividend-value stocks while gradually increasing exposure to growth areas aligned with industrial upgrading, such as advanced manufacturing and tech self-sufficiency. The market's recovery is seen as gaining a firmer footing after recent adjustments.

marsbit13 dk önce

Exiting Top Ten Shareholders of Kweichow Moutai, 'Long-term Capital' Portfolio Adjustments Revealed: National Social Security Fund Enters 12 New Stocks, Invests in Hard Tech Mthreads

marsbit13 dk önce

Data of 54,000 wallet users leaked, Clarity odds just 10%: Hodler’s Digest, Aug. 16

Galaxy Digital has slashed the odds of the CLARITY Act passing in 2026 from 75% to just 10%, citing limited Senate session days. If it fails, the SEC and CFTC plan to issue their own crypto rules, though an SEC meeting was abruptly cancelled. High-profile meetings at the White House are planned to discuss the bill. Amid growing hack fears, crypto companies are urging AI labs to grant developers early access to advanced AI models for cybersecurity, following a $116M Coldcard wallet theft. Data breaches at Trezor and SafePal have exposed over 54,000 users' personal information. The CFTC is clashing with states over regulating prediction markets like Kalshi, ordering it to ignore a New York restraining order to maintain a national market, while a Washington state judge ruled against it. The Ethereum Foundation is revising its post-quantum plan, moving away from the Poseidon hash function, and scoping its next major upgrade, Hegotá, for next year. Tether received its first full clean audit opinion from KPMG, showing reserves exceeding liabilities by $6.814 billion. Marketwise, major cryptos saw weekly declines. Predictions include a possible Bitcoin bottom in October, while analysts dispute the feasibility of BTC reaching $1M by 2030. Glassnode notes Bitcoin is in its longest capitulation phase since FTX's collapse. Three men were charged for an alleged Bitcoin kidnapping plot in Missouri.

cointelegraph1 saat önce

Data of 54,000 wallet users leaked, Clarity odds just 10%: Hodler’s Digest, Aug. 16

cointelegraph1 saat önce

50 Billion, Sichuan Brothers Have Struck It Rich

A new king of Sichuan stocks has emerged. This week, Chengdu Chaochun Applied Materials Co., Ltd. (Chaochun Yingcai) debuted on the ChiNext board, with its stock price surging over 700% intraday and its market value exceeding 50 billion yuan. Opening at 450 yuan per share, it surpassed New Easun to become the highest-priced stock in Sichuan's A-share market. This marks the success of a 21-year entrepreneurial journey by brothers Chai Jie and Chai Lin. Younger brother Chai Jie founded the company in 2005 in Chengdu, initially focusing on特种陶瓷. Elder brother Chai Lin, an expert in精密光学 and特种涂层, joined in 2008 to lead R&D. Facing a market monopolized by giants like KoMiCo and TOCALO, the company persisted. A breakthrough came in 2011 when its products entered the supply chain of AMEC (中微公司), a major domestic etching equipment maker. By 2020, its components reached the technical threshold for supporting 5nm process etching equipment. Revenue grew from 169 million yuan in 2023 to 496 million yuan in 2025, with semiconductor coating parts accounting for over 95% of sales. The IPO created significant wealth. The Chai brothers, holding a combined 46.88% stake, saw their paper wealth reach approximately 24 billion yuan. It also became the most profitable ChiNext IPO this year for retail investors. Employees benefited through two layers of持股平台, covering over 200 core technical and business staff. Early investors like SDIC Venture Capital, AMEC, and BYD (which invested 126.9 million yuan and now has a paper gain exceeding 1.8 billion yuan) also reaped substantial returns. The company represents a wave of tech leaders choosing to build their businesses in their hometown of Sichuan. Examples include New Easun in optoelectronics and Baili Tianheng in biopharmaceuticals. This trend shows that inland cities like Chengdu, with talent and industrial patience, can incubate specialized leaders that break foreign monopolies, offering an alternative model to the coastal hubs.

marsbit1 saat önce

50 Billion, Sichuan Brothers Have Struck It Rich

marsbit1 saat önce

Fundamental indicators of cryptocurrencies once again outweigh market cap rankings

Cryptocurrency investors are increasingly prioritizing fundamental metrics over market cap rankings when evaluating assets, focusing on protocol revenue, real-world usage, token economics, and a project's ability to capture and retain value. Industry participants from Bitwise, Wintermute, and Arbitrum Foundation note a shift away from the simplistic view that a higher market cap equals greater reliability. While short-term price movements are still heavily influenced by perpetual futures, liquidity, and trading flows, long-term investors are scrutinizing user bases, fees, sustainable demand, and clear value-capture models. Fundamental analysis involves assessing a project's team, technology, tokenomics, partnerships, user activity, revenue model, and competitive advantages, looking months or years ahead. Technical analysis remains relevant for short-term trading. Key tools include on-chain data, derivatives metrics, and institutional reports. Market cap is no longer the primary benchmark. Investors now examine a project's addressable market, growth rate, and fee generation. Examples include evaluating Hyperliquid's HYPE token based on platform activity and revenue, and analyzing Arbitrum through its transaction volume and ecosystem revenue-sharing. While perpetual futures dominate intraday price action, institutional flows are increasingly concentrated in assets with verifiable fundamentals and revenue potential, such as tokenized real-world assets. Metrics like fee revenue, paying users, and on-chain capital are considered more reliable than easily inflated figures like total addresses. Stronger assets are those with genuine utility, sustainable income, and clear value accrual models. Bitcoin remains a distinct macro asset. Ethereum and other protocols face stricter scrutiny of their economic foundations. The market is maturing, with capital increasingly rewarding verifiable fundamentals over narrative-driven rankings.

cryptonews.ru2 saat önce

Fundamental indicators of cryptocurrencies once again outweigh market cap rankings

cryptonews.ru2 saat önce

İşlemler

Spot

Popüler Makaleler

SAMSUNGEM Nasıl Satın Alınır

HTX.com’a hoş geldiniz! Samsung Electro-Mechanics (SAMSUNGEM) satın alma işlemlerini basit ve kullanışlı bir hâle getirdik. Adım adım açıkladığımız rehberimizi takip ederek kripto yolculuğunuza başlayın. 1. Adım: HTX Hesabınızı OluşturunHTX'te ücretsiz bir hesap açmak için e-posta adresinizi veya telefon numaranızı kullanın. Sorunsuzca kaydolun ve tüm özelliklerin kilidini açın. Hesabımı Aç2. Adım: Kripto Satın Al Bölümüne Gidin ve Ödeme Yönteminizi SeçinKredi/Banka Kartı: Visa veya Mastercard'ınızı kullanarak anında Samsung Electro-Mechanics (SAMSUNGEM) satın alın.Bakiye: Sorunsuz bir şekilde işlem yapmak için HTX hesap bakiyenizdeki fonları kullanın.Üçüncü Taraflar: Kullanımı kolaylaştırmak için Google Pay ve Apple Pay gibi popüler ödeme yöntemlerini ekledik.P2P: HTX'teki diğer kullanıcılarla doğrudan işlem yapın.Borsa Dışı (OTC): Yatırımcılar için kişiye özel hizmetler ve rekabetçi döviz kurları sunuyoruz.3. Adım: Samsung Electro-Mechanics (SAMSUNGEM) Varlıklarınızı SaklayınSamsung Electro-Mechanics (SAMSUNGEM) satın aldıktan sonra HTX hesabınızda saklayın. Alternatif olarak, blok zinciri transferi yoluyla başka bir yere gönderebilir veya diğer kripto para birimlerini takas etmek için kullanabilirsiniz.4. Adım: Samsung Electro-Mechanics (SAMSUNGEM) Varlıklarınızla İşlem YapınHTX'in spot piyasasında Samsung Electro-Mechanics (SAMSUNGEM) ile kolayca işlemler yapın.Hesabınıza erişin, işlem çiftinizi seçin, işlemlerinizi gerçekleştirin ve gerçek zamanlı olarak izleyin. Hem yeni başlayanlar hem de deneyimli yatırımcılar için kullanıcı dostu bir deneyim sunuyoruz.

88 Toplam GörüntülenmeYayınlanma 2026.08.14Güncellenme 2026.08.14

SAMSUNGEM Nasıl Satın Alınır

LGELECTRONICS Nedir

Sözleşmenin dayanak varlığı LG Electronics Inc.'dir. LG Electronics Inc., tüketici elektroniği, beyaz eşyalar ve araç bileşenleri ile uğraşan, Güney Kore merkezli küresel bir elektronik şirketidir.

120 Toplam GörüntülenmeYayınlanma 2026.08.14Güncellenme 2026.08.14

LGELECTRONICS Nedir

LGELECTRONICS Nasıl Satın Alınır

HTX.com’a hoş geldiniz! LG Electronics (LGELECTRONICS) satın alma işlemlerini basit ve kullanışlı bir hâle getirdik. Adım adım açıkladığımız rehberimizi takip ederek kripto yolculuğunuza başlayın. 1. Adım: HTX Hesabınızı OluşturunHTX'te ücretsiz bir hesap açmak için e-posta adresinizi veya telefon numaranızı kullanın. Sorunsuzca kaydolun ve tüm özelliklerin kilidini açın. Hesabımı Aç2. Adım: Kripto Satın Al Bölümüne Gidin ve Ödeme Yönteminizi SeçinKredi/Banka Kartı: Visa veya Mastercard'ınızı kullanarak anında LG Electronics (LGELECTRONICS) satın alın.Bakiye: Sorunsuz bir şekilde işlem yapmak için HTX hesap bakiyenizdeki fonları kullanın.Üçüncü Taraflar: Kullanımı kolaylaştırmak için Google Pay ve Apple Pay gibi popüler ödeme yöntemlerini ekledik.P2P: HTX'teki diğer kullanıcılarla doğrudan işlem yapın.Borsa Dışı (OTC): Yatırımcılar için kişiye özel hizmetler ve rekabetçi döviz kurları sunuyoruz.3. Adım: LG Electronics (LGELECTRONICS) Varlıklarınızı SaklayınLG Electronics (LGELECTRONICS) satın aldıktan sonra HTX hesabınızda saklayın. Alternatif olarak, blok zinciri transferi yoluyla başka bir yere gönderebilir veya diğer kripto para birimlerini takas etmek için kullanabilirsiniz.4. Adım: LG Electronics (LGELECTRONICS) Varlıklarınızla İşlem YapınHTX'in spot piyasasında LG Electronics (LGELECTRONICS) ile kolayca işlemler yapın.Hesabınıza erişin, işlem çiftinizi seçin, işlemlerinizi gerçekleştirin ve gerçek zamanlı olarak izleyin. Hem yeni başlayanlar hem de deneyimli yatırımcılar için kullanıcı dostu bir deneyim sunuyoruz.

80 Toplam GörüntülenmeYayınlanma 2026.08.14Güncellenme 2026.08.14

LGELECTRONICS Nasıl Satın Alınır

Tartışmalar

HTX Topluluğuna hoş geldiniz. Burada, en son platform gelişmeleri hakkında bilgi sahibi olabilir ve profesyonel piyasa görüşlerine erişebilirsiniz. Kullanıcıların A (A) fiyatı hakkındaki görüşleri aşağıda sunulmaktadır.

活动图片