Excerpt
Bitcoin trades below key cost basis levels, signalling demand exhaustion and fading momentum. Long-term holders are selling into strength, while the options market turns defensive, with rising put demand and elevated volatility, marking a cautious phase before any sustainable recovery.
Executive Summary
- Bitcoin trades below the short-term holders’ cost basis and the 0.85 quantile, signalling fading momentum and growing market fatigue. Repeated failures to reclaim these levels raise the risk of a longer consolidation phase.
- Long-term holders have ramped up spending since July, now exceeding 22K BTC/day, marking sustained profit-taking that continues to pressure market stability.
- Open interest hit a new ATH, but sentiment leans bearish as traders favour puts over calls. Short-term rallies are being met with hedging rather than renewed optimism.
- Implied volatility remains elevated, while realized volatility has caught up, ending the calm, low-volatility regime. Dealers’ short gamma positioning amplifies selloffs and tempers rallies.
- Both on-chain and options data suggest a cautious, transitional phase. Market recovery is likely to hinge on renewed spot demand and easing volatility.
Bitcoin has gradually drifted away from its recent all-time high, stabilizing below the short-term holders’ cost basis of around $113.1k. Historically, this structure often precedes the onset of a mid-term bearish phase, as weaker hands begin to capitulate.
In this edition, we assess the market’s current profitability, examine the scale and persistence of long-term holder spending, and conclude by evaluating sentiment in the options market to gauge whether the correction reflects a healthy consolidation or signals deeper exhaustion ahead.
On-chain Insights
Testing Conviction
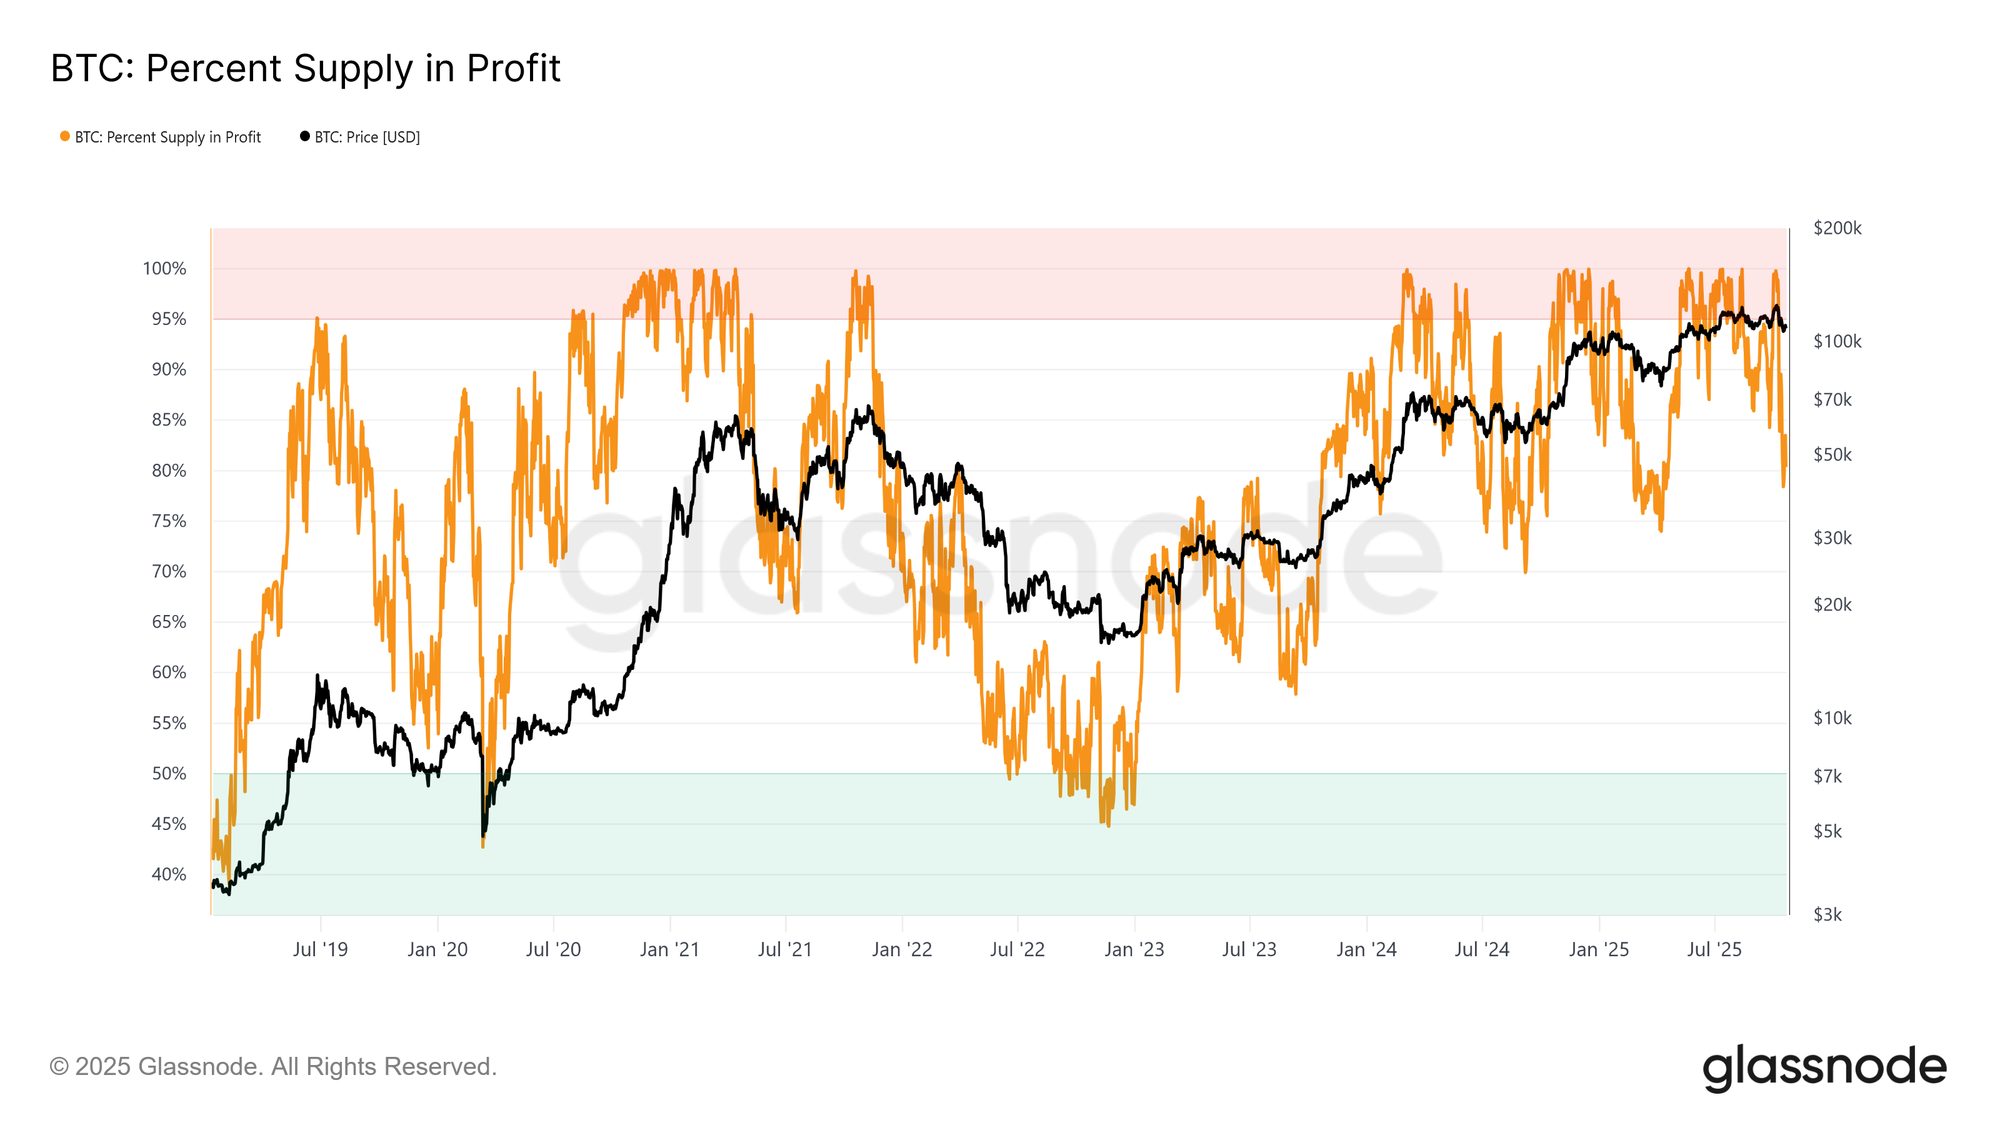
Trading around the short-term holders’ cost basis marks a pivotal phase where the market tests the conviction of investors who bought near recent highs. Historically, a breakdown below this level following a new ATH has driven the Percent of Supply in Profit down to roughly 85%, implying that over 15% of supply sits at a loss.
We are now witnessing this pattern for the third time in the current cycle. If Bitcoin fails to recover above the ~113.1k, a deeper contraction could push a larger share of supply into loss, amplifying stress among recent buyers and potentially setting the stage for broader capitulation across the market.
Critical Thresholds
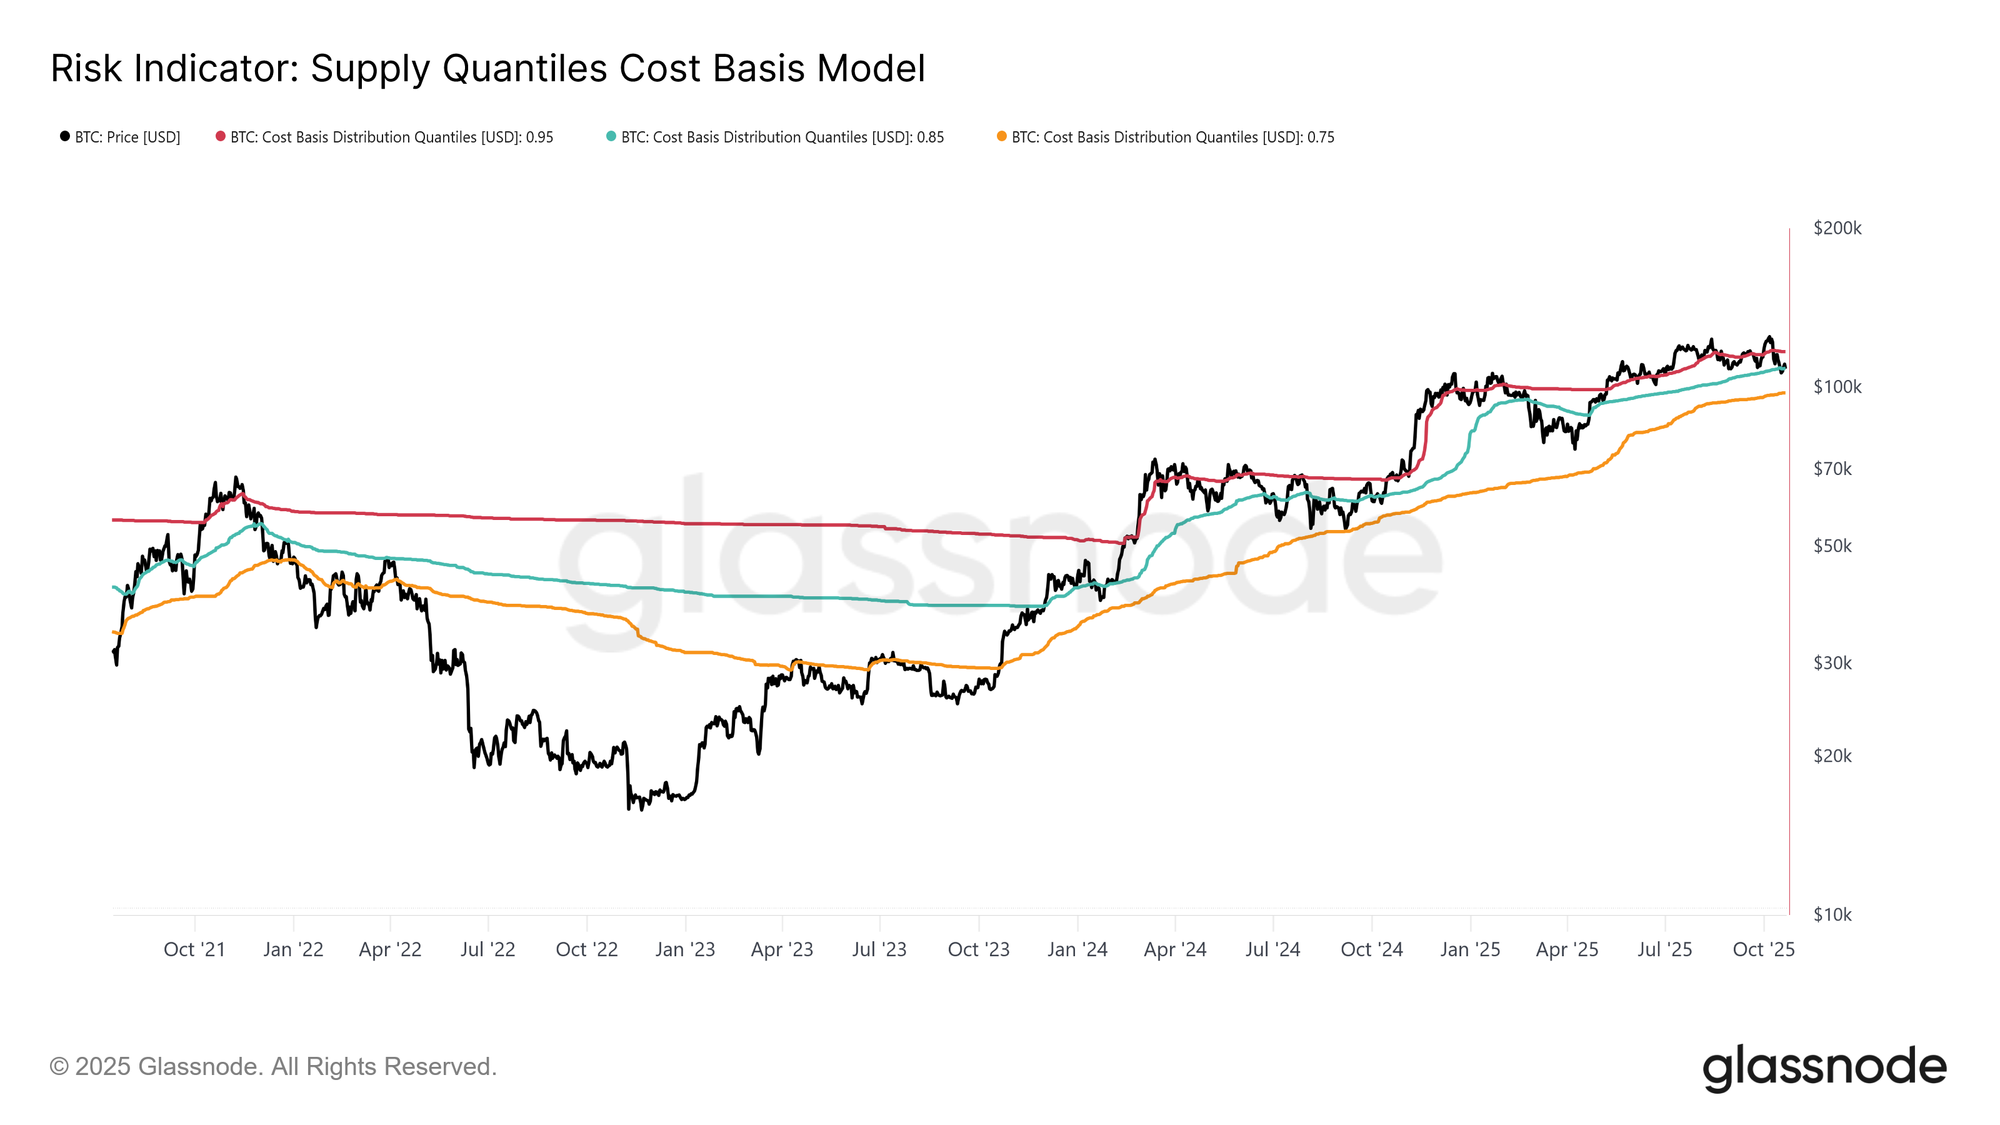
To further contextualize this structure, it’s essential to understand why reclaiming the short-term holders’ cost basis is pivotal for sustaining a bullish phase. The Supply Quantile Cost Basis model provides a clear framework by mapping the 0.95, 0.85, and 0.75 quantiles, indicating levels where 5%, 15%, and 25% of the supply is held at a loss.
Currently, Bitcoin trades not only below the short-term holder cost basis ($113.1k) but is also struggling to stay above the 0.85 quantile at $108.6k. Historically, failure to hold this threshold has signalled structural market weakness and often preceded deeper corrections toward the 0.75 quantile, which now aligns near $97.5k.
Exhausted Demand
Contracting below both the short-term holders’ cost basis and the 0.85 quantile for the third time this cycle raises structural concerns. From a macro perspective, repeated demand exhaustion suggests the market may require a longer consolidation phase to rebuild strength.
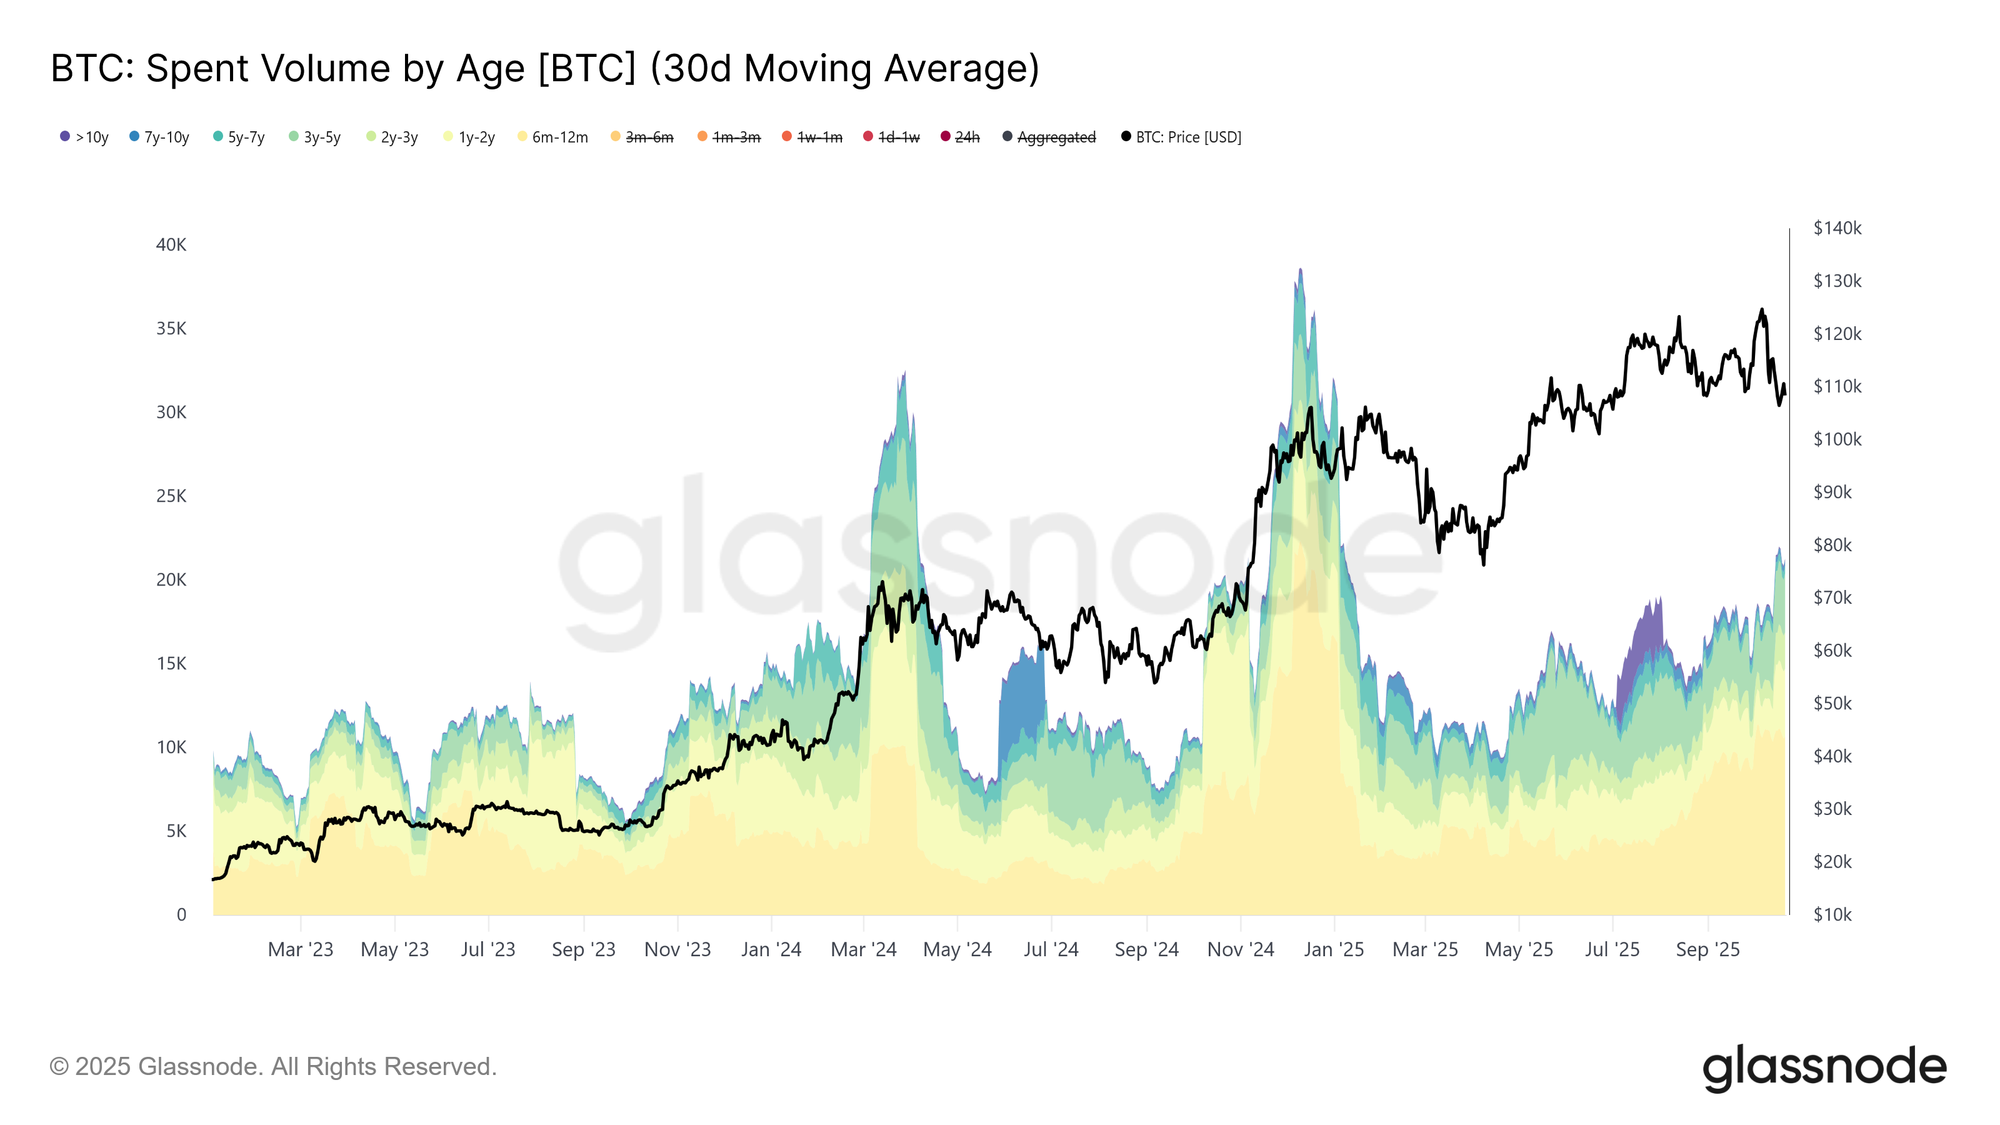
This exhaustion becomes clearer when examining Long-Term Holder Spend Volume. Since the market peak in July 2025, long-term holders have steadily increased their spending, with the 30D-SMA rising from the 10K BTC (baseline) to over 22K BTC per day. Such persistent distribution indicates profit-taking pressure from seasoned investors, which has been a key factor behind the market’s current fragility.
After evaluating the risk of a prolonged bearish phase from demand exhaustion, we now turn to the options market to gauge short-term sentiment and see how speculators are positioning amid rising uncertainty.
Off-chain Insights
Open Interest Rising
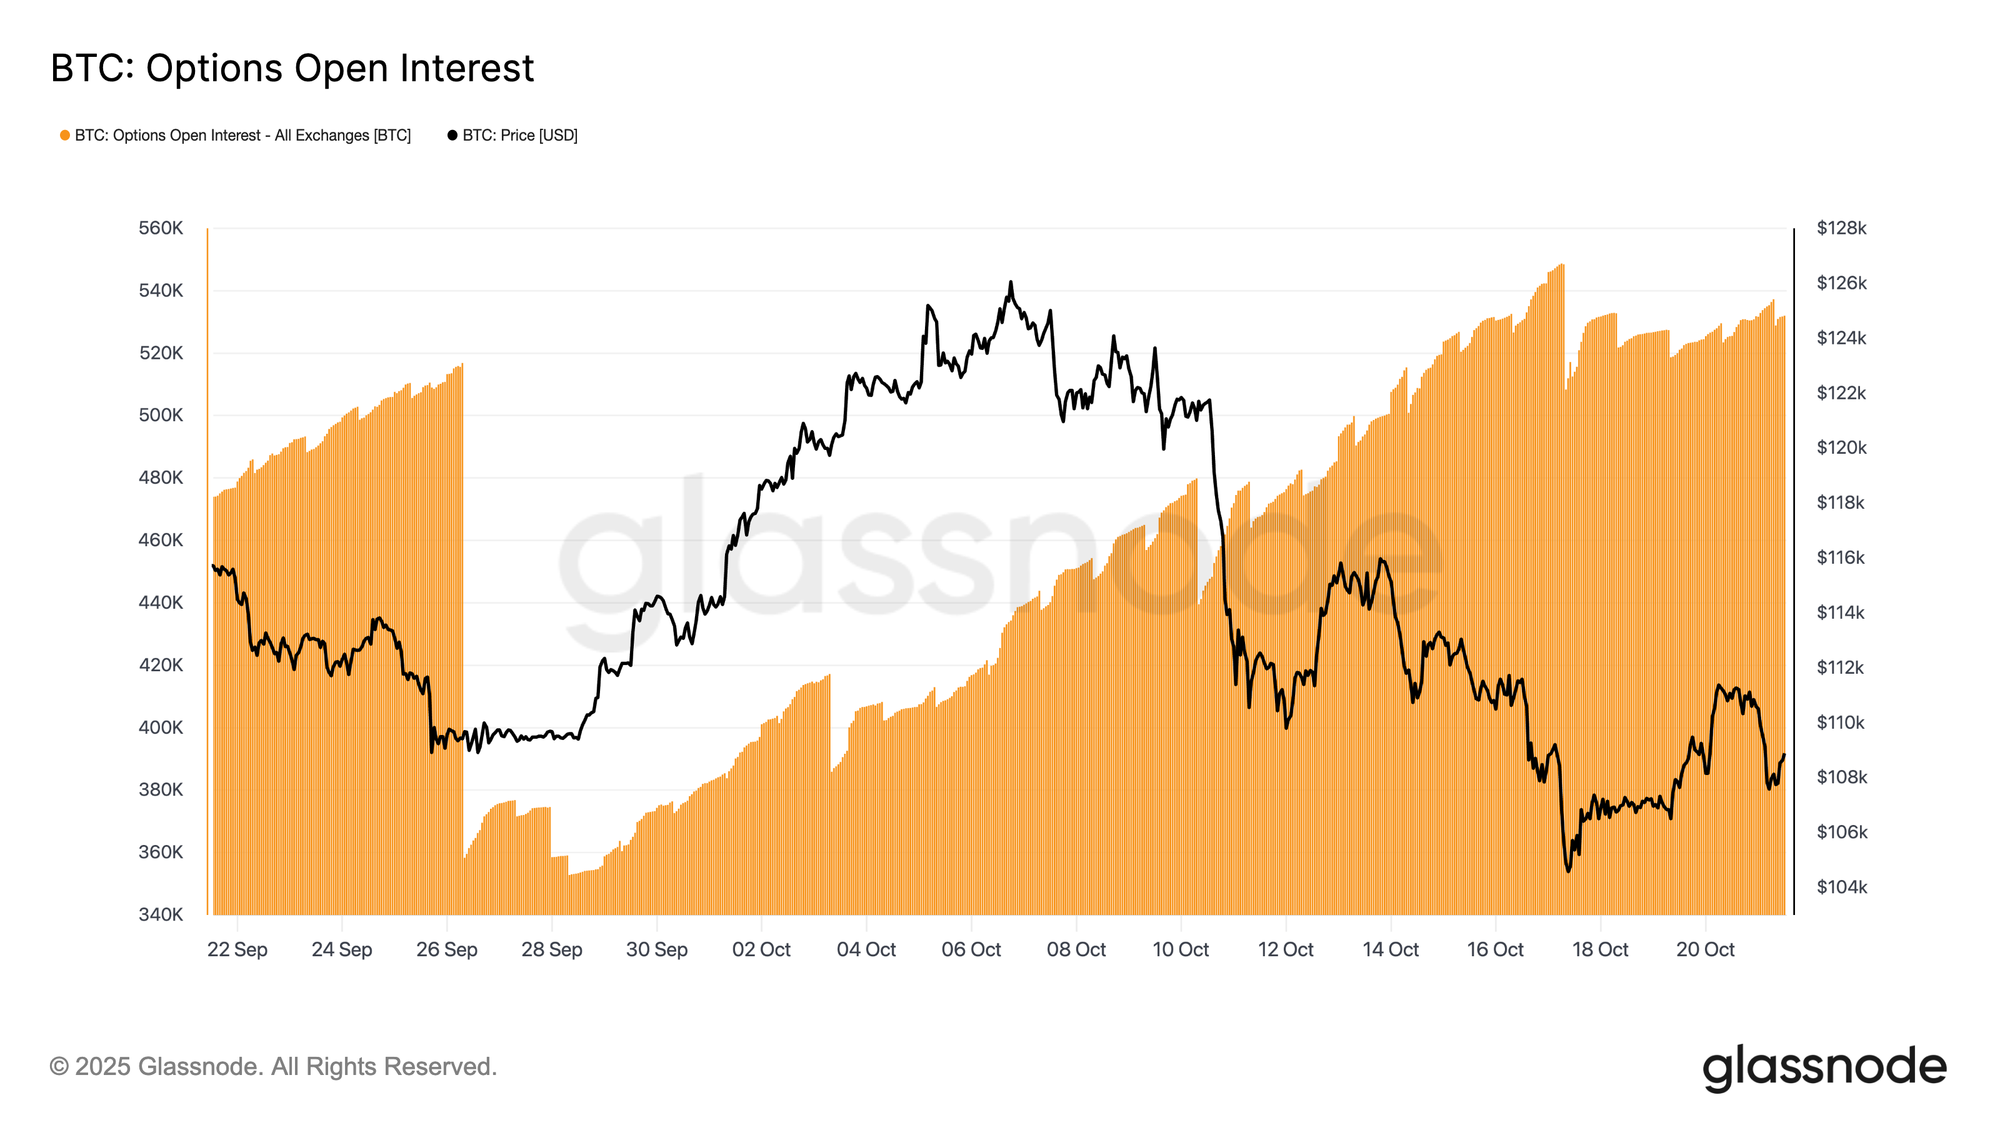
Bitcoin options open interest has reached a new all-time high and continues to expand, marking a structural evolution in market behaviour.
Rather than selling spot, investors are increasingly using options to hedge exposure or speculate on volatility. This shift reduces direct sell pressure in the spot market, but amplifies short-term volatility driven by dealer hedging activity.
As open interest grows, price swings are more likely to originate from delta- and gamma-driven flows in futures and perpetual markets. Understanding these dynamics is becoming crucial, as options positioning now plays a dominant role in shaping short-term market movements and amplifying reactions to macro and on-chain catalysts.
Volatility Regime Shift
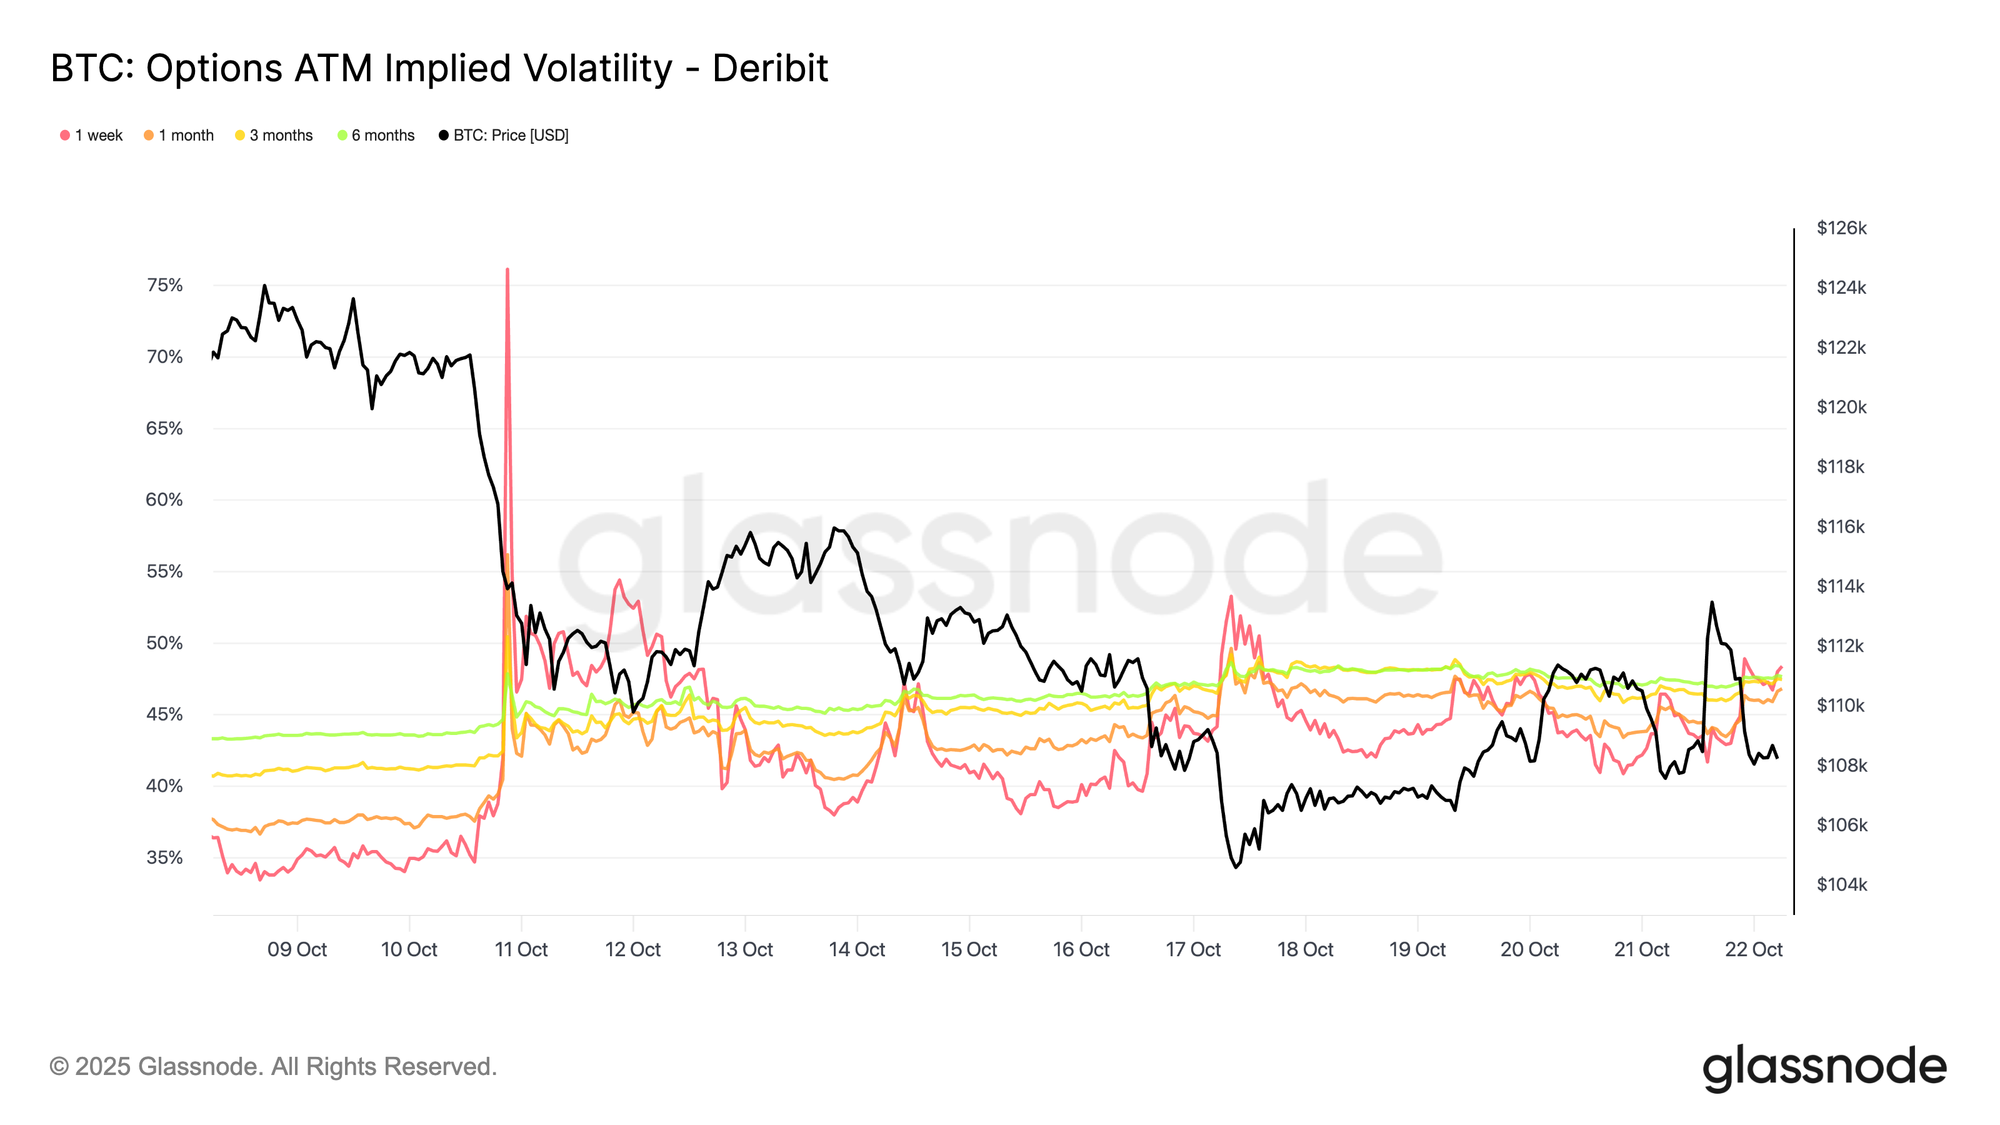
Since the liquidation event on the 10th, Bitcoin’s volatility landscape has shifted notably. Implied volatility (IV) now hovers around 48 across maturities, up from 36–43 two weeks earlier. Market makers remain cautious, keeping volatility pricing elevated as they avoid selling it cheaply.
Meanwhile, realized volatility has cooled, with the 30-day at 44.1% and 10-day at 27.9%, suggesting the market is gradually stabilizing. Unless new shocks emerge, IV is likely to normalize in the coming weeks. For now, volatility remains elevated but reflects a short-term repricing rather than the onset of a sustained high-vol regime.
Put Skew Builds
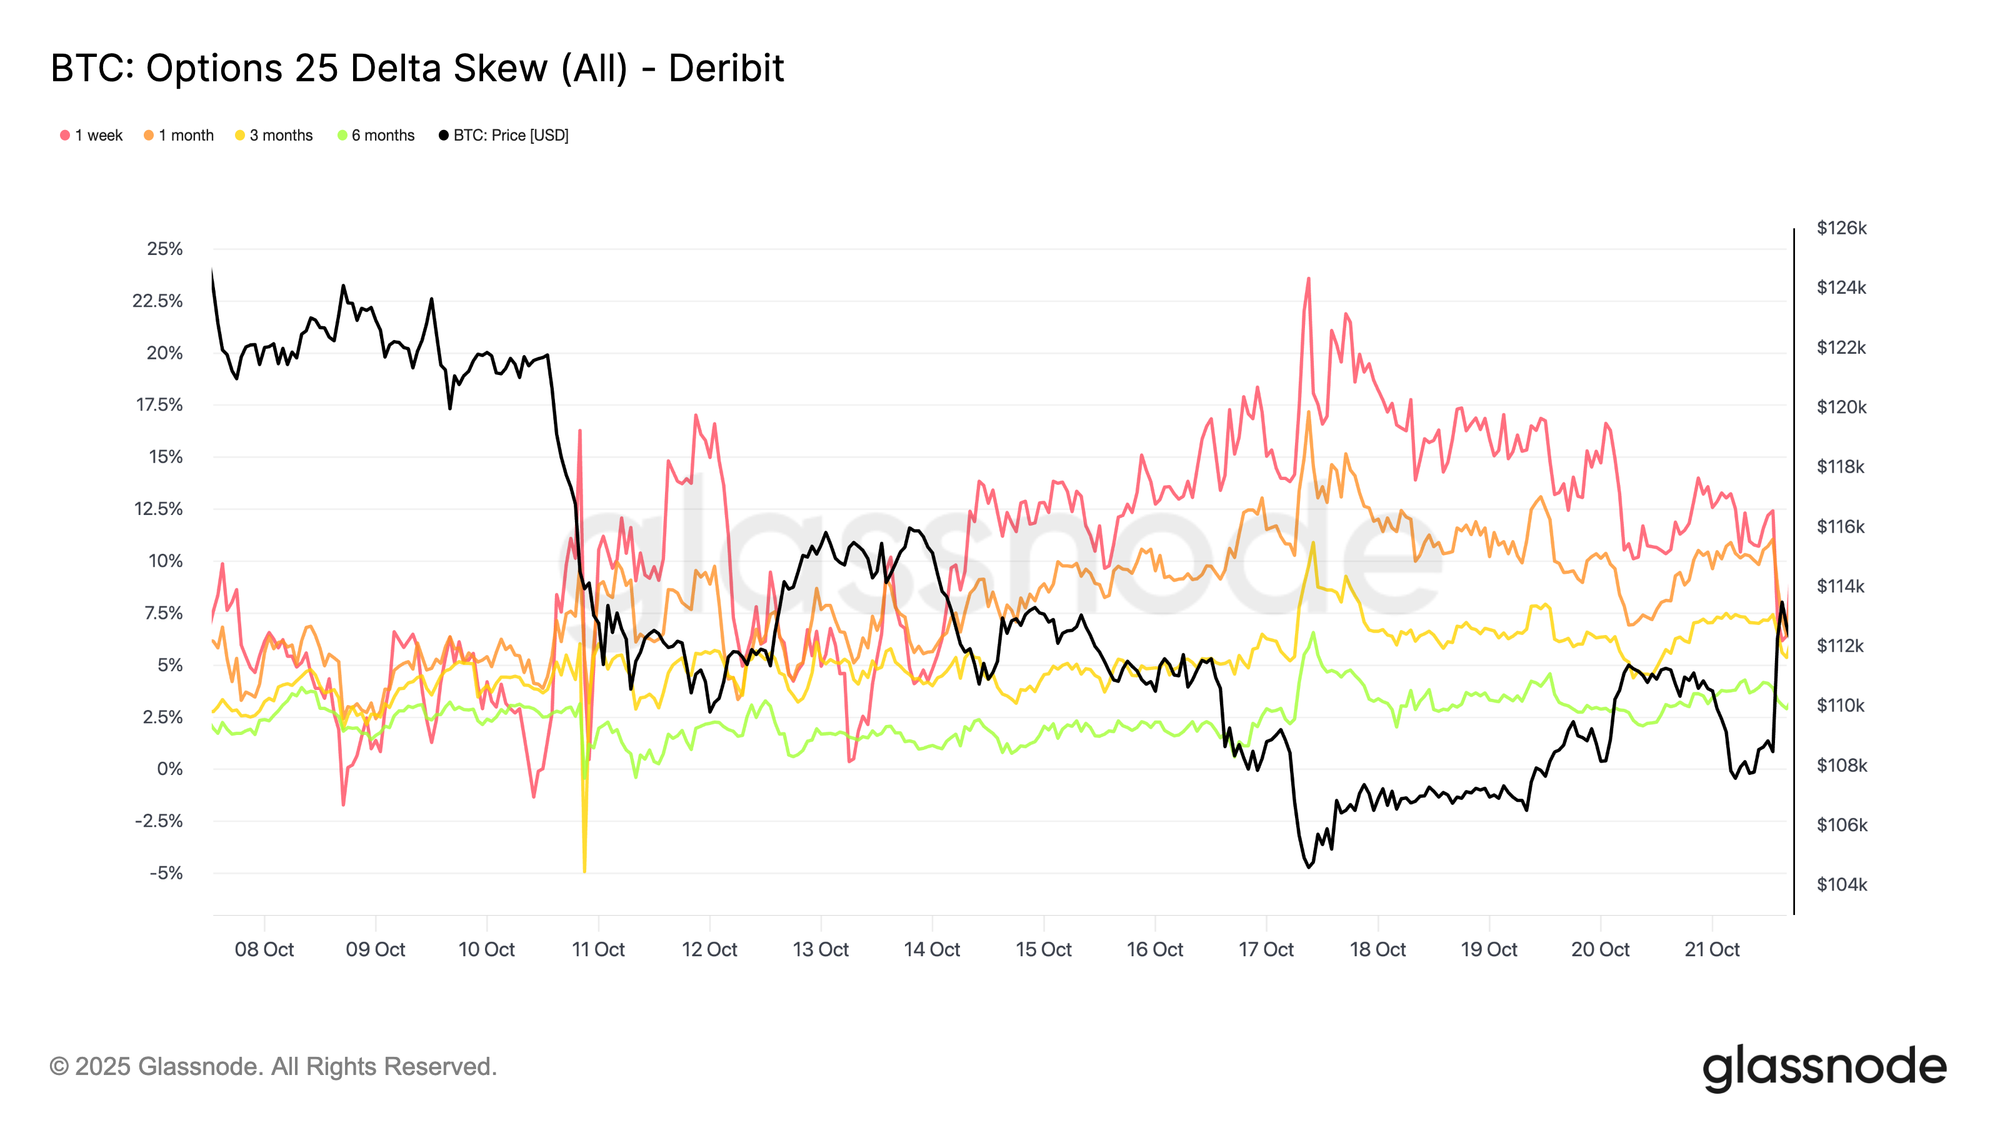
Following the same theme, the skew toward puts has increased steadily over the past two weeks. The big liquidation spike pushed the put skew sharply higher, and although it briefly reset, the curve has since stabilized at structurally higher levels, meaning puts remain richer than calls.
Over the past week, the 1-week maturity has been choppy but stayed in the high-uncertainty zone, while all other maturities have moved 2–3 vol points further toward puts. This broadening across maturities (also referred to as tenors) indicates that caution is spreading along the curve.
This structure reflects a market willing to pay up for downside protection while maintaining limited upside exposure, balancing short-term fear within a still-confident long-term outlook. Tuesday’s small rally (Oct 21) illustrated that sensitivity, as put premiums were cut in half within hours, showing how jumpy sentiment remains.
Risk Premium Turns
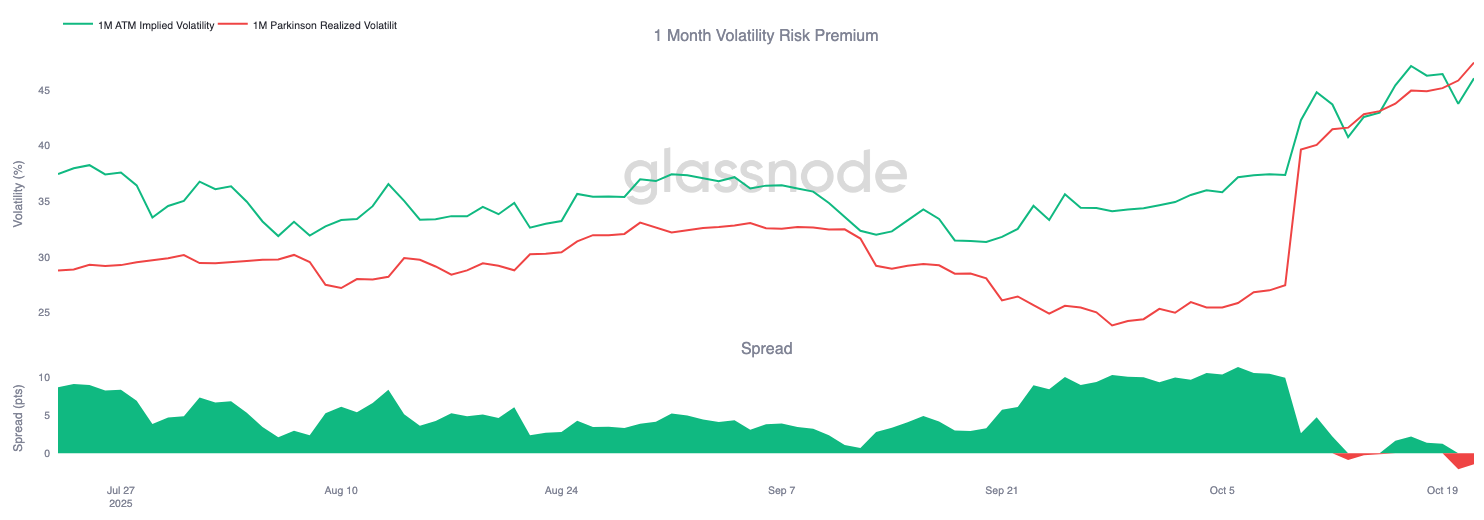
The 1-Month Volatility Risk Premium—the gap between implied and realized volatility—has turned negative. For months, implied volatility stayed elevated while realized moves remained muted, rewarding short-vol traders with steady carry.
Now, realized volatility has surged to match implied, erasing that advantage. This marks the end of the calm regime: volatility sellers can no longer rely on passive income and are instead forced to hedge actively in choppier conditions.
The market has shifted from quiet complacency to a more dynamic, reactive environment where short-gamma positions face mounting pressure as real price swings return.
Flows Stay Defensive
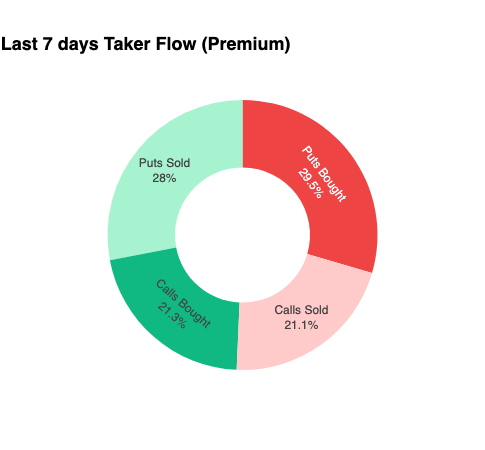
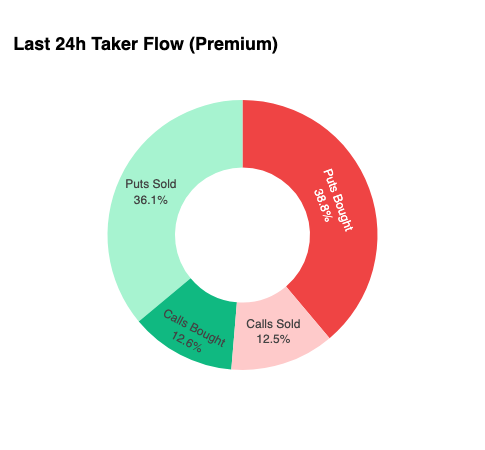
To bring the analysis to the very short term, we zoom into the past 24 hours to observe how option positioning has reacted to the latest bounce.
Despite a 6% rally from $107.5K to $113.9K, there was little confirmation from call buying. Instead, traders added to their put exposure, effectively locking in higher price levels.
This positioning leaves dealers short gamma on the downside and long gamma on the upside, a setup that typically causes them to fade rallies and accelerate selloff, a dynamic that will continue to act as a headwind until positioning resets.
Premiums Tell the Story
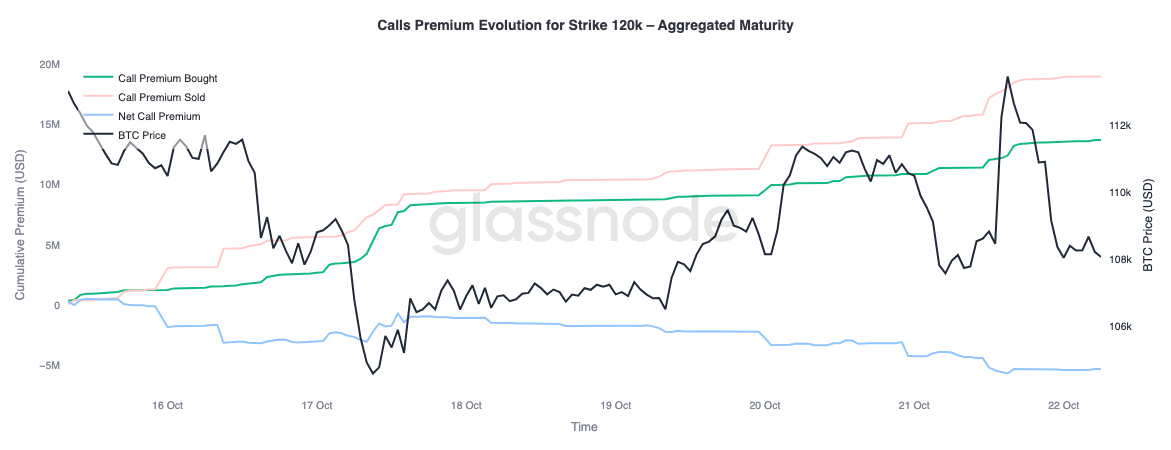
Glassnode’s aggregated premium data reinforces this view when analyzed by strike. At the $120K call, sold premiums have increased alongside price, showing traders are fading the rally and selling volatility into strength they view as temporary. Short-term yield seekers are capitalizing on spikes in implied volatility by selling calls into rallies rather than chasing upside.
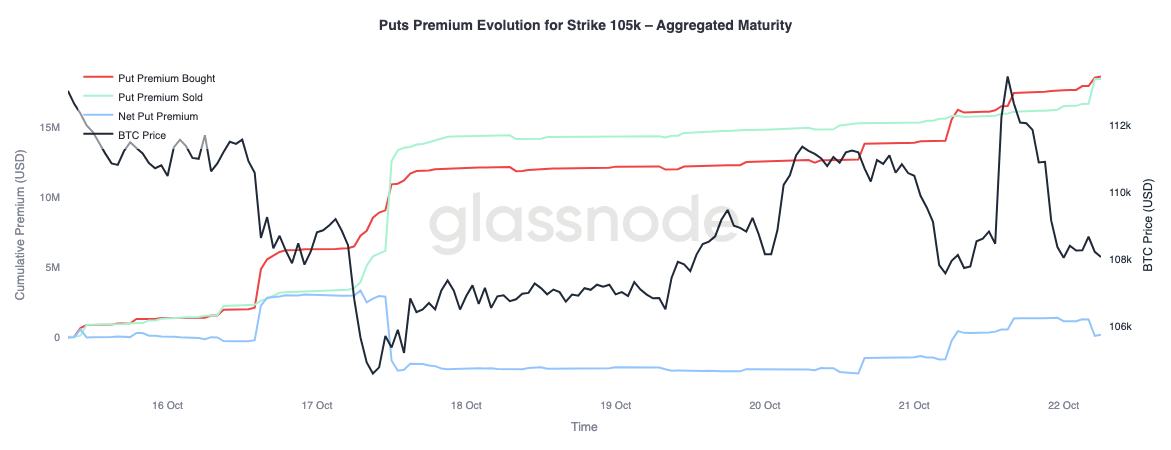
Moreover, at the $105K put, the pattern flips, reinforcing the same conclusion. As spot price climbed, net premiums on this strike rose, showing traders were more eager to pay for downside protection than for upside exposure. In essence, the latest rally was met with hedging, not conviction — the market is willing to insure risk rather than embrace belief.
Conclusion
Bitcoin’s recent correction below the short-term holders’ cost basis ($113.1k) and the 0.85 quantile ($108.6k) highlights growing demand exhaustion, as the market struggles to attract new inflows while long-term holders continue to distribute. This structural fatigue suggests that the network may need a longer consolidation phase to rebuild confidence and absorb the spent supply.
Meanwhile, the options market reflects this same cautious tone. Despite record-high open interest, positioning leans defensive; put skew remains elevated, volatility sellers are under pressure, and short-term rallies are met with hedging rather than optimism. Together, these signals indicate a market in transition: one where exuberance has waned, structural risk-taking is subdued, and recovery will likely depend on restoring spot demand and mitigating volatility-driven flows.