Цена Shiba Inu приближается к прорыву, так как с бирж уходит 5 триллионов токенов

cryptonews.ru2025-04-21 tarihinde yayınlandı2025-09-22 tarihinde güncellendi

В течение последних нескольких недель Shiba Inu оставалась в фазе консолидации, несмотря на продолжающийся сезон альткоинов. Тем не менее медленно формирующаяся фигура «треугольник» и снижение биржевых балансов указывают на то, что впереди нас ждёт большой скачок.

Краткие сведения
  • Боковая динамика акций Shiba Inu может скрывать более масштабные изменения.
  • Учитывая, что за последние недели с централизованных бирж было выведено более 5 триллионов SHIB, а также резкий рост накопления «умных денег», можно предположить, что давление со стороны продавцов снизилось, а долгосрочные держатели стали более уверенными в своих инвестициях.
  • В сочетании с техническими паттернами, указывающими на близость прорыва, мем-токен может оказаться на пороге роста, несмотря на недавние неудачи, такие как взлом Shibarium. Таким образом, текущее движение цены может стать подготовкой к следующему этапу роста SHIB.

В воскресенье, 21 сентября, токен Shiba Inu (SHIB) торговался по цене $0,000013 в узком диапазоне, в котором он находился в течение последних нескольких дней. Эта цена примерно на 28 % выше самого низкого уровня в этом году.

Потенциальным катализатором роста цены SHIB является то, что инвесторы продолжают выводить свои токены с централизованных бирж. В частности, с бирж было выведено более 5 триллионов токенов из имеющихся 283 триллионов.

Резервы для обмена монет Shiba Inu
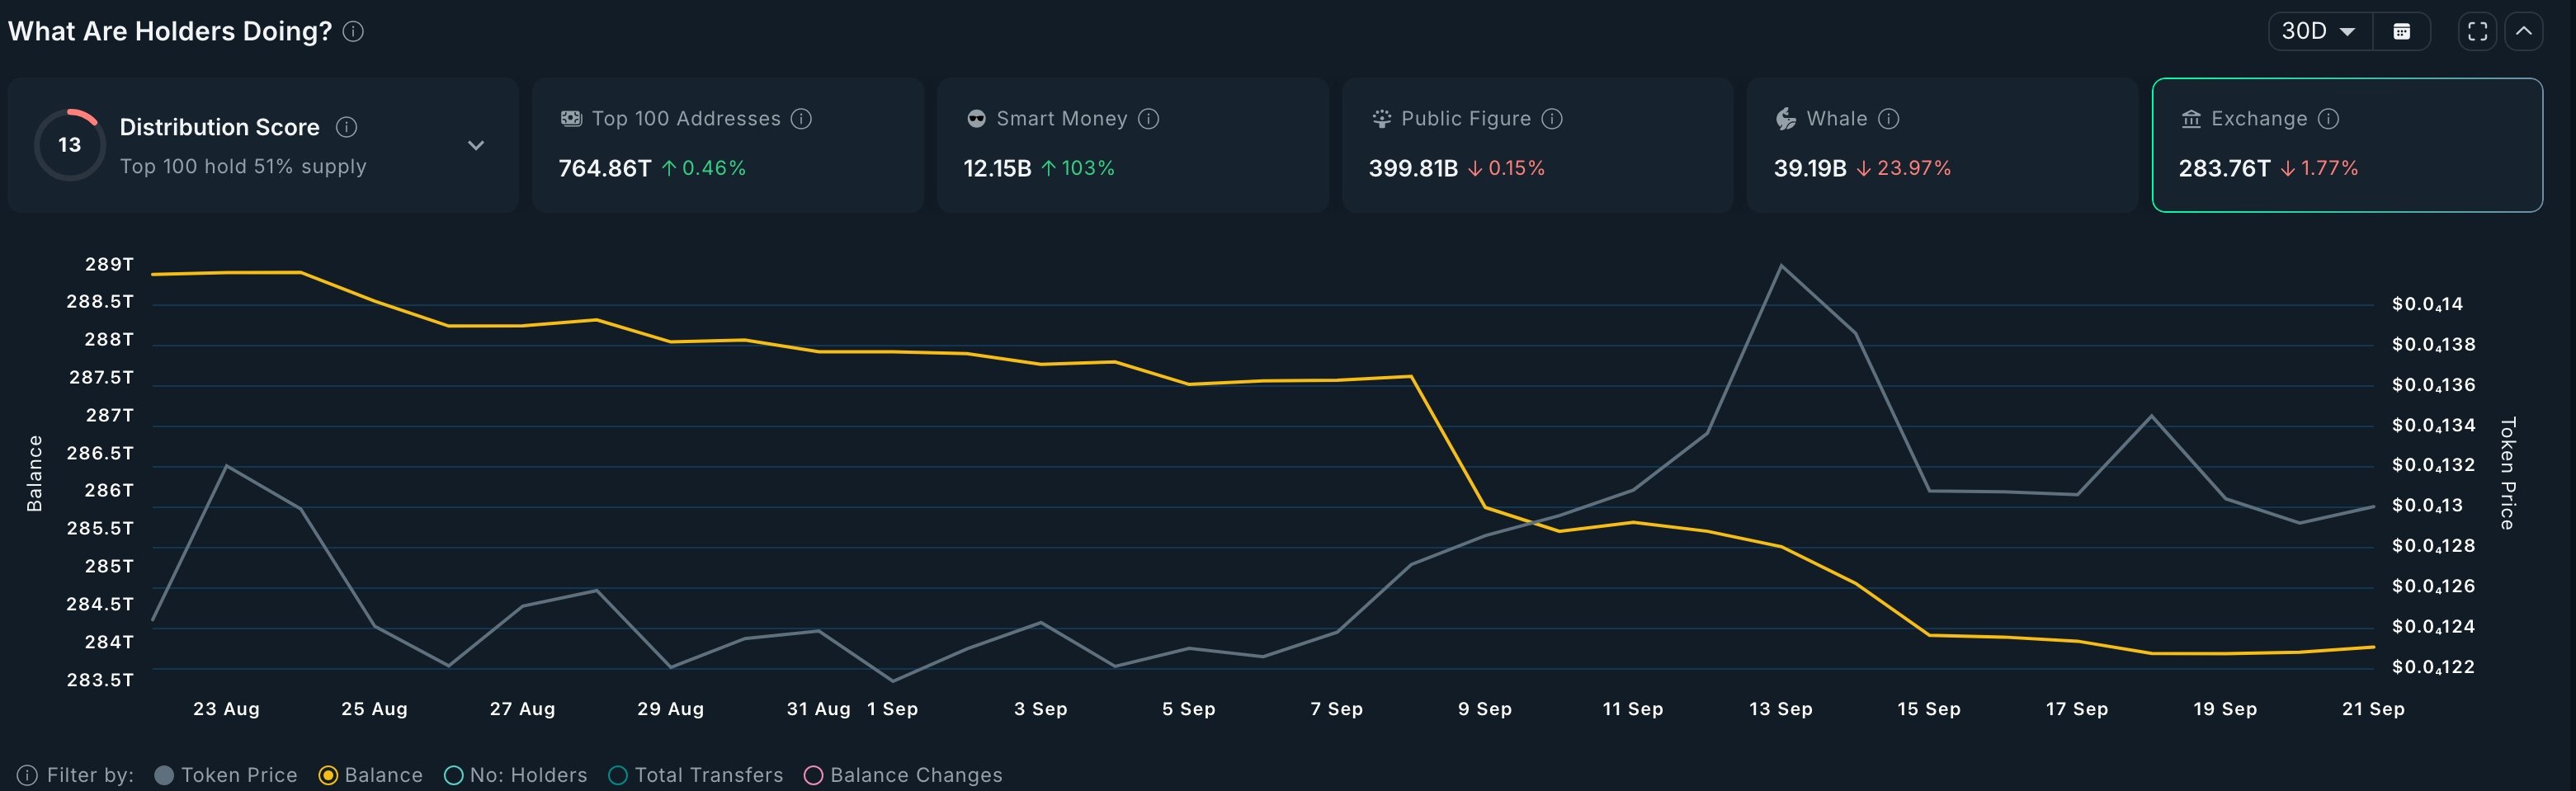
Резервы для обмена монет Shiba Inu | Источник: Nansen
Вам также может понравиться: Цена криптовалюты Avantis стремится к историческому максимуму на фоне роста открытого интереса

Падение количества токенов на биржах — это «бычий» сигнал о снижении давления со стороны продавцов. Исторически сложилось так, что крупный отток средств с бирж предшествует росту цен, поскольку это говорит о том, что держатели не планируют продавать их в краткосрочной перспективе.

Аналогичным образом перевод токенов в холодное хранилище или на кошельки с самостоятельным хранением свидетельствует о том, что инвесторы планируют держать их в течение длительного времени. Это отражает уверенность в будущем актива.

Продолжающийся вывод токенов Shiba Inu с бирж совпал с активным накоплением токенов инвесторами. Сейчас у этих инвесторов более 12,15 млрд токенов, что на 103 % больше, чем месяц назад.

Их покупка, скорее всего, свидетельствует о том, что эти инвесторы ожидают восстановления и минимизации последствий недавнего взлома Shibarium. Кроме того, это противоположная ставка на то, что монета примет участие в альткоин-сезоне.

Технический анализ цен на Shiba Inu

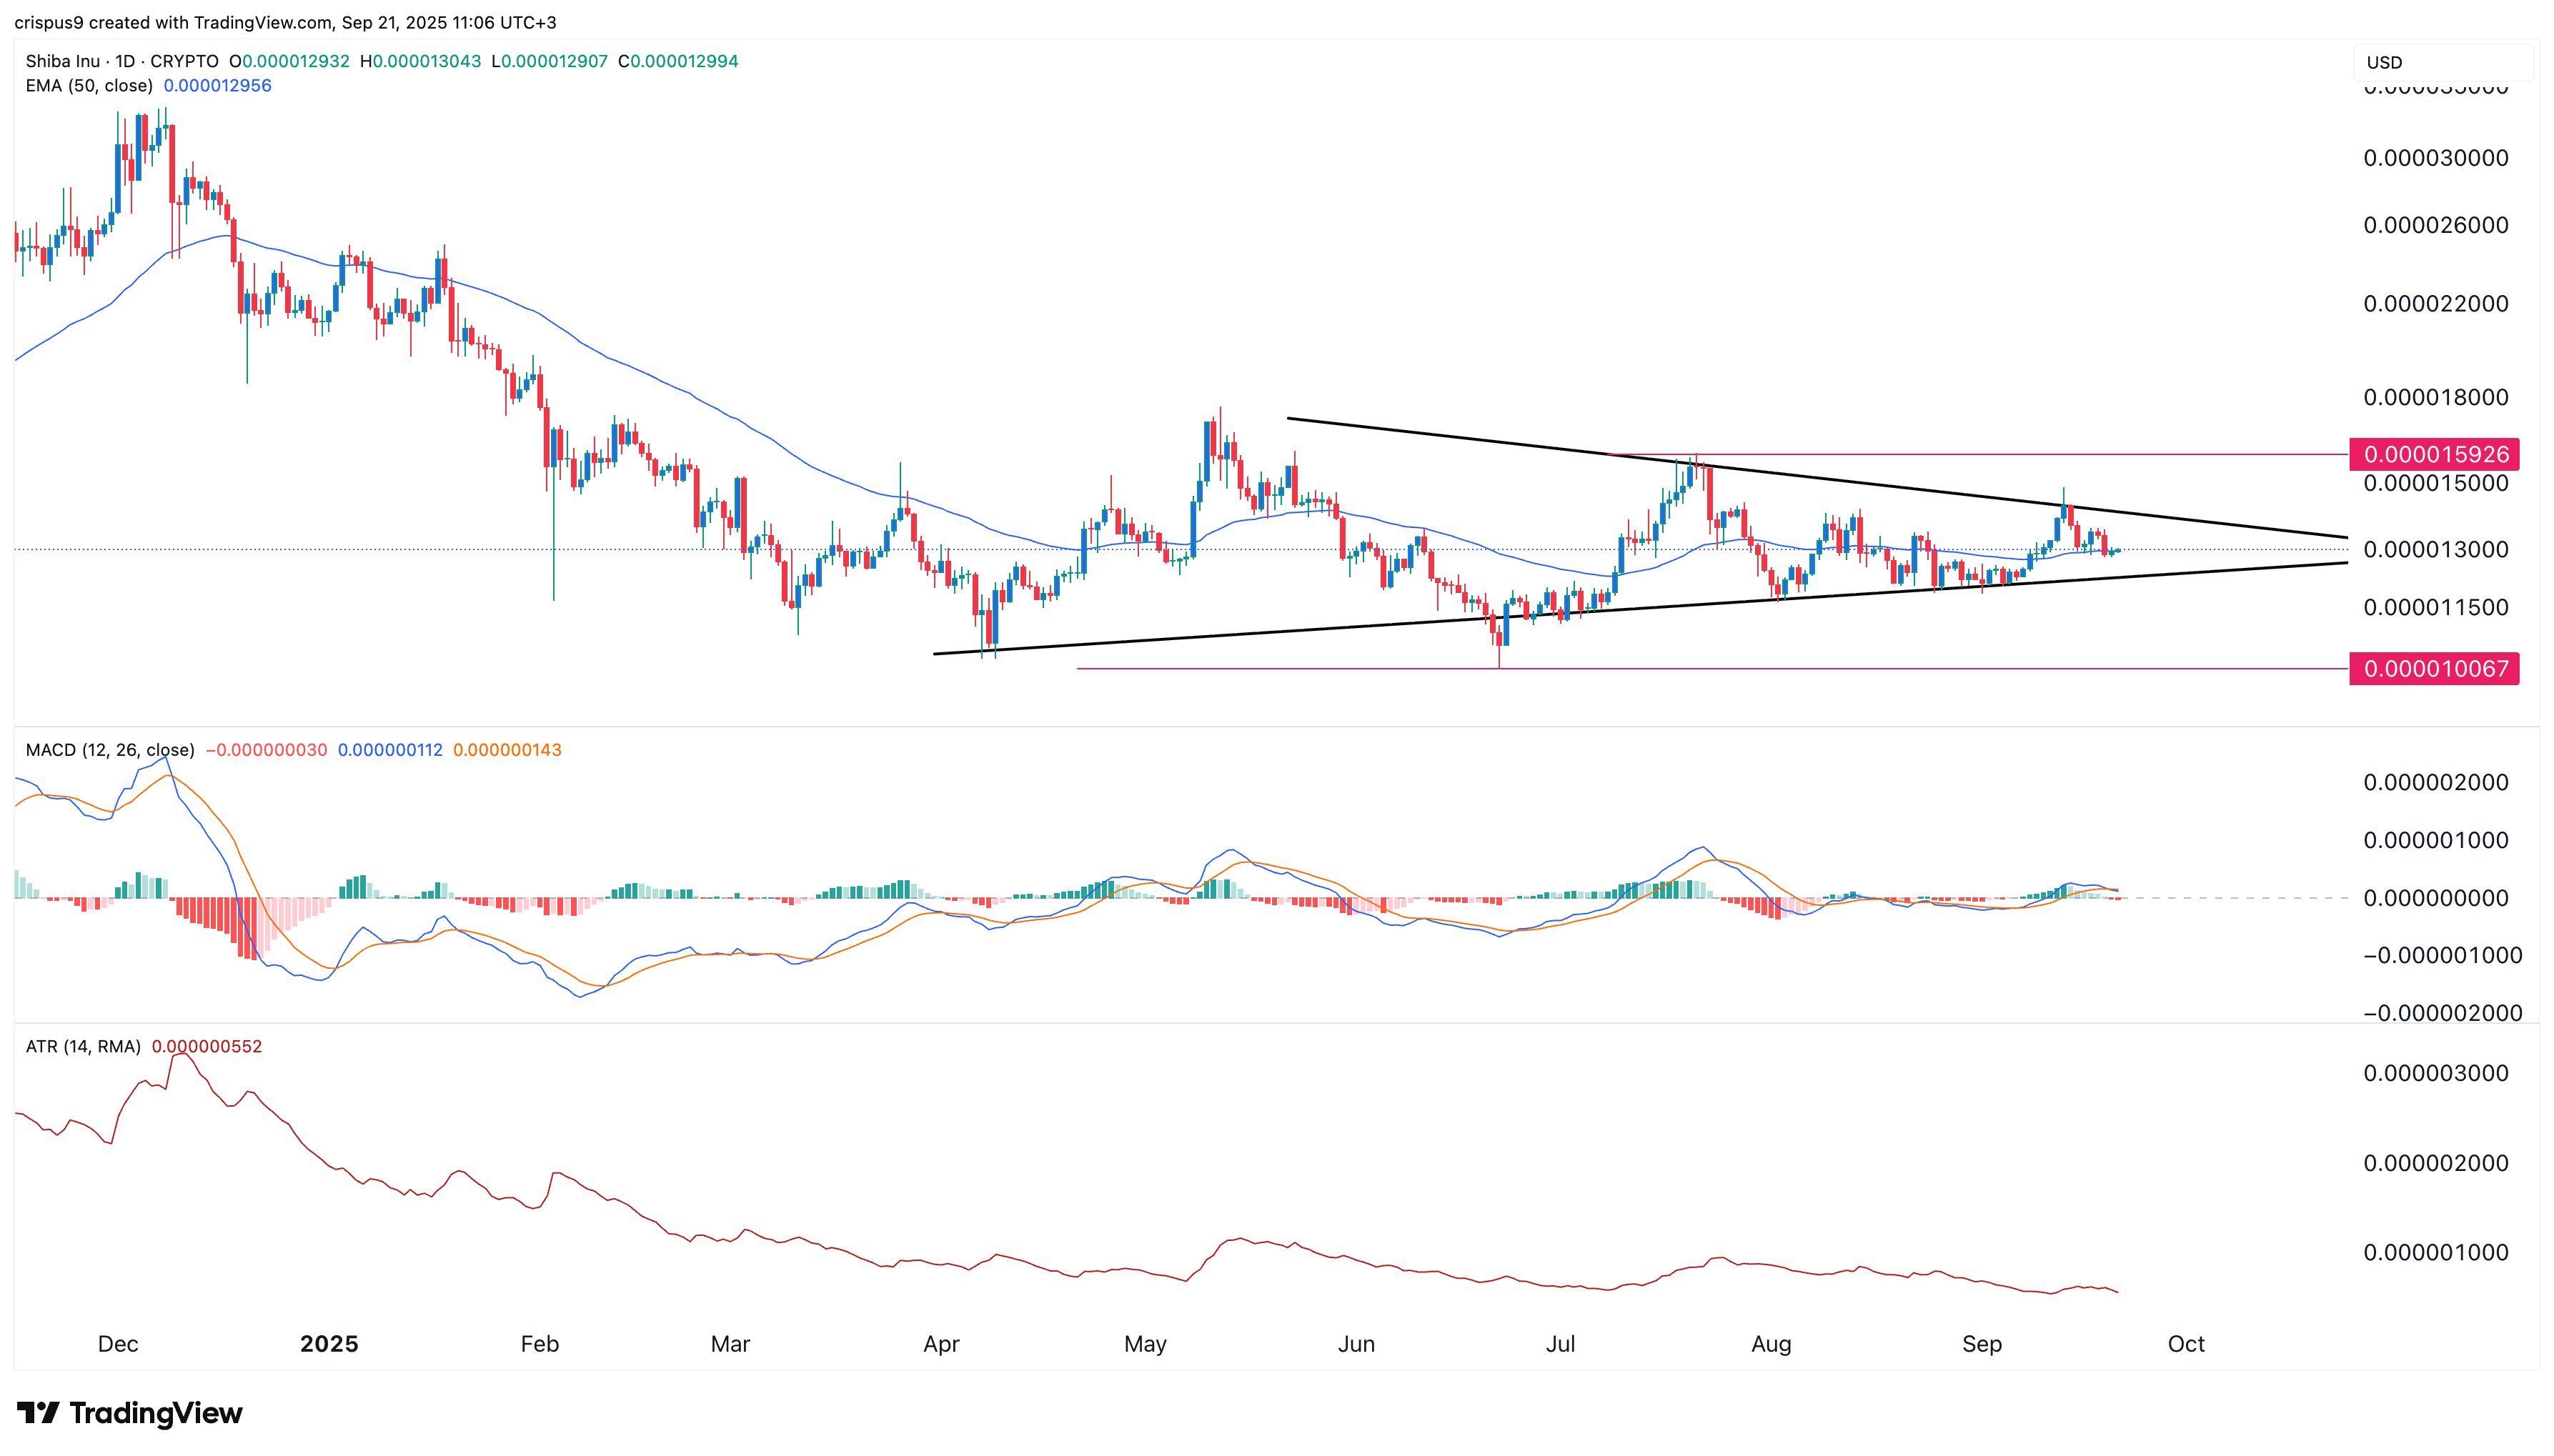
График цен SHIB | Источник: crypto.news

График на дневном таймфрейме показывает, что в последние несколько дней цена SHIB оставалась в узком диапазоне. Она торговалась на уровне $0,000013, что соответствует 50-дневной экспоненциальной скользящей средней.

Токен сформировал фигуру симметричного треугольника, две линии которого приближаются к уровню слияния. Кроме того, две линии индикатора MACD расположились на нейтральном уровне, а средний истинный диапазон сократился.

Таким образом, в ближайшей перспективе токен, скорее всего, совершит бычий прорыв, а следующее важное сопротивление будет на уровне $0,0001592, что примерно на 25 % выше текущего уровня. Движение ниже нижней границы треугольника опровергнет бычий прогноз по цене Shiba Inu.

İlgili Okumalar

Report Interpretation: J.P. Morgan Details Micron's Pre-Earnings Sentiment, Current Hardware Sector Dynamics

Morgan Stanley analyst Joshua Meyers' report (June 21, 2026) highlights key trends in the hardware and semiconductor sector ahead of Micron's earnings. The core takeaways are: 1. **Micron & Memory:** Memory remains a high-conviction long theme, driven by strong AI demand and rising ASPs. However, investor focus is shifting to the sustainability of Micron's >80% gross margins and the specifics of potential new long-term supply agreements (SCAs). 2. **Hardware Supply Chain:** AI-related demand for servers, networking, and storage remains robust, but company performance is diverging. Celestica (CLS) shows improved margin confidence, Western Digital and Seagate benefit from pricing, Fabrinet (FN) sees predictable AI optics growth, and Teradyne (TER) anticipates a new Google customer. 3. **AI Capex & WFE Forecasts:** JPMorgan increased its Wafer Fab Equipment (WFE) market growth forecasts to 28% in 2026 and 29% in 2027. AI infrastructure financing is evolving, with higher project-level debt reducing constraints on capex expansion. The report signals that while the AI-driven hardware cycle is strong, the market is entering a phase focused on execution verification (e.g., Micron's SCA details, Fabrinet's ramp with Amazon) and valuation sustainability. Key near-term signals include Micron's guidance, Arista Networks' outlook, and the pace of demand normalization post potential tariff-related pull-ins.

marsbit7 saat önce

Report Interpretation: J.P. Morgan Details Micron's Pre-Earnings Sentiment, Current Hardware Sector Dynamics

marsbit7 saat önce

Research Report Analysis: The Fed's New Chair's Debut – New Leader, But Same Script?

Report Analysis: Federal Reserve's New Chair Debut – A New Captain, But the Same Script? Morgan Stanley's chief global economist Seth B. Carpenter analyzes the first FOMC meeting under new Fed Chair Kevin Warsh in a June 21 report. Warsh deliberately avoided providing forward guidance on interest rates, aligning with his philosophy. However, market expectations for a rate hike this year were reinforced. Key signals lie elsewhere: inflation may fall more than expected, and quantitative tightening (QT) could be more aggressive than anticipated. The FOMC's "dot plot" suggests only one rate hike in 2026. Carpenter argues that if inflation undershoots forecasts, the logic for even a single hike weakens, especially as projections indicate potential rate cuts in 2027. On QT, Warsh's stance is clear. Carpenter notes that measures like halving the Treasury's account balance could shrink the Fed's balance sheet by around $500 billion with minimal market impact. Combined with adjustments to reserve interest and liquidity rules, the ultimate QT scale may exceed expectations, though its market effect might be less disruptive unless the Fed actively sells Mortgage-Backed Securities (MBS). While Warsh initiated a review of the Fed's policy framework, the 2% inflation target remains intact for now. The report concludes that the market may be overestimating the significance of reduced forward guidance and the near-term rate hike risk, while potentially underestimating the scope and manageable nature of the coming balance sheet reduction. The key debates will hinge on upcoming core PCE data, the specifics of the QT path, and the framework review's findings.

marsbit7 saat önce

Research Report Analysis: The Fed's New Chair's Debut – New Leader, But Same Script?

marsbit7 saat önce

Critical Game Week: BTC Retracement Confirmation vs. HYPE Support Battle | Guest Analysis

This weekly analysis outlines a critical juncture for BTC and HYPE markets, focusing on key price level confirmations. **BTC Analysis:** BTC is at a pivotal point after a five-wave rally from the June 5th low of $59,100. The price has broken below a short-term rising channel's lower boundary, with the current move seen as a pullback to test this breakdown. Failure to reclaim this level could lead to a retest of the $59,000-$60,000 support zone. The core scenario hinges on this channel retest outcome. * **Key Levels:** Resistance at $64,500-$65,000 (channel boundary) and $69,500-$70,500. Support at $59,000-$60,000 and $55,000. * **Strategy:** A core bearish stance is maintained (20% short from last week), with short-term plans for tactical trades. Three detailed contingency plans (A/B/C) are provided for short positions on resistance tests or breakdowns, emphasizing strict stop-loss discipline. **HYPE Analysis:** HYPE shows strong momentum but is currently in a corrective phase after hitting a new high of $76.94. The price is retesting the crucial $64-$66 support area. * **Key Levels:** Resistance near $77 and $80-$82. Support at $64-$66 and $52-$54. * **Strategy:** The short-term approach is "buy on dips, avoid chasing rallies." A long position is considered only if clear stabilization signals appear at the $64-$66 or deeper $52-$54 support zones, with tight risk controls. **General Risk Management:** A standardized trailing stop-loss protocol is emphasized: set initial stop, breakeven at +1% profit, then trail stops upward to lock in gains. *Disclaimer: All analysis is presented as a personal trading framework, not investment advice. Market conditions are complex and require dynamic adjustment.*

marsbit8 saat önce

Critical Game Week: BTC Retracement Confirmation vs. HYPE Support Battle | Guest Analysis

marsbit8 saat önce

İşlemler

Spot
Futures
活动图片