3 Scenarios To Watch Out As Dogecoin Price Plays Out Its Thin Cloud Behavior

bitcoinist2026-04-15 tarihinde yayınlandı2026-04-15 tarihinde güncellendi

Özet

Dogecoin's price is exhibiting a "Thin Cloud Behavior" on the 4-hour chart, indicating low volatility and a lack of directional commitment. A crypto analyst outlines three potential scenarios. The first is a bearish breakdown below the cloud's support at $0.092, which could trigger a sustained downtrend toward $0.09. The second is a bullish breakout above $0.094, turning the cloud green and signaling the start of a larger upward move. The third scenario is continued "chop," where the price moves sideways within the cloud, requiring investors to wait for clearer directional momentum. Until a definitive move occurs, the advice is to treat the market with caution.

The current Dogecoin performance trend has highlighted the appearance of a rather interesting behavioral pattern. This has to do with the zig-zag movement of the meme coin through the last few months, and depending on the direction of the next move, it could determine how the Dogecoin price could play out. Given this, a crypto analyst has given three different scenarios that could end up playing out for the digital asset soon.

Dogecoin Price Displays Kumo Cloud Behavior

Crypto analyst Trader Tardigarde pointed out a rather ineresting formation on the Dogecoin price chart using the 4-Hour chart. According to the analysis, the current Dogecoin up and down movement suggests the appearance of a Thin Cloud Behavior.

As Trader Tardigrade explains, the Dogecoin price movements through this thin cloud suggests that the meme coin is not seeing a lot of movement. This means that there is nothing that is currently blocking the price from moving. But the interesting part of this is that the price is not blocked in either direction. Thus, Dogecoin could push in any direction from here.

As a result, there are three scenarios that could play out for the cryptocurrency at this point. The first of these is the bearish one that could lead to a sustained downtrend. The Thin Cloud current lies between $0.092 and just below $0.093. If the price breaks below the bottom, then it could trigger a breakdown.

This breakdown would lead to the cloud actually thickening, eliminating the thin cloud currently being seen. Additionally, it would push the price further down, possibly breaking below the $0.09 level once again. However, there is still the possibility of a bullish scenario.

Source: X

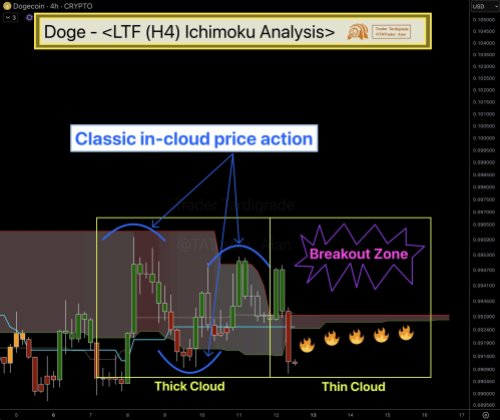
The second scenario highlighted by Trader Tardigrade is the the breakout, when the Dogecoin price successfully surges above the thin cloud. Such a move would put it in the breakout zone above $0.094, pushing the cloud from red to green. This would then be the first step before an even bigger move.

Last but not least is the third scenario, which the crypto analyst refers to as ‘Chop.’ In this case, the Dogecoin price would continue to revolve around the current thin cloud without any meaningful breakout in either direction. In this case, investors would have to wait for directional clarity to happen.

For now, the crypto analyst says that the Dogecoin price hasn’t committed to a single direction. And until it does, Trader Tardigrade says to “treat Kumo like air.” Thus, wait for the wind to change before taking a position.

DOGE bulls push for a recovery | Source: DOGEUSDT on Tradingview.com

İlgili Sorular

QWhat is the 'Thin Cloud Behavior' mentioned in the Dogecoin price analysis?

AThe 'Thin Cloud Behavior' refers to a pattern on the price chart where Dogecoin is moving in a zig-zag pattern within a narrow range, indicating a lack of significant price movement and no major resistance or support blocking its price in either direction.

QAccording to Trader Tardigrade, what are the three possible scenarios for Dogecoin's price movement?

AThe three scenarios are: 1) A bearish breakdown below the cloud leading to a sustained downtrend, 2) A bullish breakout above the cloud triggering a potential upward move, and 3) A 'Chop' scenario where the price continues to move sideways around the current range without a clear direction.

QWhat price levels define the current Thin Cloud for Dogecoin?

AThe Thin Cloud currently lies between the price levels of $0.092 and just below $0.093.

QWhat would a bullish breakout for Dogecoin price look like according to the analysis?

AA bullish breakout would occur if the Dogecoin price successfully surges above the thin cloud, breaking past the $0.094 level. This would change the cloud from red to green and could be the first step before a larger upward move.

QWhat is the analyst's advice for traders until Dogecoin commits to a direction?

AThe analyst advises traders to 'treat Kumo like air,' meaning they should wait for the wind to change (wait for a clear directional move) before taking a position, as the price hasn't committed to a single direction yet.

İlgili Okumalar

The Essence of AI Layoffs: Why More AI Adoption Leads to More Corporate Anxiety?

The author, awaiting potential inclusion on an 8000-person layoff list, analyzes the true nature of recent "AI-driven" layoffs. They argue that while AI use, particularly tools like Claude for code generation, has skyrocketed and boosted developer output (e.g., 2-5x more code commits), this has not translated into proportional business growth or revenue. The core issue is a misalignment between increased "Input" (code) and tangible "Outcomes" (user value, revenue). AI acts as a costly B2B SaaS, inflating operational expenses without guaranteed returns. Two key problems emerge: 1) The friction that once filtered out bad ideas is gone, as AI allows cheap pursuit of even weak concepts. 2) Organizational "alignment tax"—the difficulty of coordinating across teams—becomes crippling when development velocity outpaces consensus-building. Thus, layoffs serve two immediate purposes: 1) To offset ballooning AI costs (Token consumption) and maintain cash flow, as rising input costs without outcome growth destroys unit economics. 2) To reduce organizational bloat and alignment friction by simply removing teams, thereby speeding up execution in the short term. Therefore, these layoffs are fundamentally caused by AI, even if AI doesn't directly replace roles. They represent a painful correction until companies learn to convert AI-driven productivity into real business outcomes and streamline organizational coordination to match the new pace of work. The cycle will continue until this learning curve is mastered.

marsbit6 dk önce

The Essence of AI Layoffs: Why More AI Adoption Leads to More Corporate Anxiety?

marsbit6 dk önce

Can the Solana Foundation and Google's Collaboration on Pay.sh Bridge the Payment Link Between Web2 and Web3 in the Agent Economy?

Solana Foundation, in collaboration with Google Cloud, has launched Pay.sh, a payment gateway designed to bridge the gap between AI agents and enterprise-grade service infrastructure. The initiative aims to solve a key bottleneck in the "agent economy": existing payment systems are ill-suited for autonomous AI agents. Traditional methods like credit cards require human verification, while newer on-chain protocols like x402 and MPP create a separate, Web3-native system that raises barriers for service providers. Pay.sh functions as a universal payment layer. It allows users to fund a Solana wallet via credit card or stablecoin, which then acts as an identity and payment proxy for AI agents. When an agent needs to access a paid API service (e.g., Google Cloud, Alibaba Cloud), Pay.sh handles the transaction seamlessly. It leverages the HTTP 402 status code ("Payment Required") to initiate payments, intelligently choosing between one-time transfers (x402-style) or session-based authorizations (MPC-style) based on the service's billing model. This spares agents from manual account registration and API key management. A key feature for service providers is low integration effort. They can adopt Pay.sh by providing a declarative configuration file, enabling features like tiered pricing, free tiers, and automatic revenue splitting to multiple addresses (e.g., for royalties, cloud costs). Providers can also list their APIs in a central Pay Skill Registry for agent discovery. The collaboration with Google Cloud provides crucial infrastructure for API proxying, traffic routing, and compliance logging, aiming to keep agent activities within regulated boundaries. By connecting Web2 services with Web3 payment rails, Pay.sh positions the Solana wallet as a foundational identity and payment tool for AI agents, potentially driving more transaction volume to the Solana ecosystem. However, the report notes challenges. The service registry currently lacks robust vetting, risking exposure to unauthorized or malicious third-party APIs. Pay.sh also inherits security and compatibility risks from its underlying payment protocols (x402, MPC). Furthermore, adoption may be hindered by varying regional data privacy and payment compliance regulations among API providers. Despite these hurdles, Pay.sh represents a significant step towards integrating Web2 and Web3 for autonomous agent commerce.

marsbit13 dk önce

Can the Solana Foundation and Google's Collaboration on Pay.sh Bridge the Payment Link Between Web2 and Web3 in the Agent Economy?

marsbit13 dk önce

Bitcoin's Bull-Bear Cycle Indicator Turns Positive for the First Time in 7 Months: End of Bear Market or False Breakout?

Bitcoin's "Bull-Bear Market Cycle Indicator" from CryptoQuant has turned positive for the first time since October 2025. This gauge, based on the P&L Index relative to its 365-day moving average, suggests a potential shift from a bear market phase. Concurrently, the Bull Score Index rose to a neutral reading of 50 in late April. The indicator's move into positive territory follows a roughly 35% price rebound from a low near $60,000 in February to above $81,000. The recovery over approximately three months was faster than the 12-month period observed during the 2022 bear market. However, analysts caution against premature optimism, citing a historical precedent from March 2022. Back then, the Bull Score Index briefly hit 50, but it proved to be a false signal as Bitcoin's price subsequently plunged further. Structural differences exist in the current cycle, including consistent inflows into spot Bitcoin ETFs and an increase in large holder addresses. Yet, some models, referencing the four-year halving cycle, suggest a potential deeper bottom near $50,000 might still be possible around late 2026. In summary, while on-chain data shows marked improvement and the worst panic may be over, market participants remain cautious. A convincing trend reversal confirmation likely requires Bitcoin to sustainably break above key resistance, such as the 200-day moving average near $82,000.

marsbit21 dk önce

Bitcoin's Bull-Bear Cycle Indicator Turns Positive for the First Time in 7 Months: End of Bear Market or False Breakout?

marsbit21 dk önce

How to Automate Any Workflow with Claude Skills (Complete Tutorial)

This is a comprehensive guide to mastering Claude Skills, a feature for creating permanent, reusable instruction sets that automate specific workflows. Unlike simple saved prompts, Skills function like trained employees, delivering consistent, high-quality outputs by defining the entire task process, standards, error handling, and output format. The guide is structured in four phases: **Phase 1: Installation (5 minutes).** Skills are folders containing a `SKILL.md` file. The user is instructed to find a relevant Skill online, install it, test it on a real task, and compare its performance to one-off prompts. **Phase 2: Building Your First Custom Skill.** Start by rigorously defining the Skill's purpose, trigger phrases, and providing a concrete example of perfect output. The `SKILL.md` file has two parts: a YAML frontmatter with a specific name/description/triggers, and a detailed, step-by-step workflow written in natural language with examples and quality standards. **Phase 3: Testing & Optimization for Production.** Test the Skill in three scenarios: 1) a standard, common task; 2) edge cases with missing or conflicting data; and 3) a pressure test with maximum complexity. Any failure indicates a needed instruction. Implement a weekly optimization cycle to continuously refine the Skill based on real usage. **Phase 4: Building a Complete Skill Library.** The goal is to create a team of Skills for all repetitive tasks. Examples are given for industries like real estate, marketing, finance, consulting, and e-commerce. The user should list their tasks, prioritize them, and build one new Skill per week, maintaining a master document to track their library. The conclusion emphasizes the compounding time savings: ten Skills saving 30 minutes each per week reclaims over 260 hours (6.5 work weeks) per year, fundamentally transforming one's work system.

marsbit44 dk önce

How to Automate Any Workflow with Claude Skills (Complete Tutorial)

marsbit44 dk önce

İşlemler

Spot
Futures
活动图片