MEV Bot究竟能从CEX-DEX套利中赚取多少利润?

marsbit2025-07-26 tarihinde yayınlandı2025-07-27 tarihinde güncellendi

MEV套利机器人究竟可以从 CEX-DEX 套利中赚取多少利润?

此前无人能解答这个问题,但我们激动地宣布,现在终于有一篇采用形式化方法进行测量的新论文问世(论文链接:https://arxiv.org/abs/2507.13023),我将在下文中用一系列图片以及解释为你概述该论文的所有核心发现。

超级浓缩版

区块构建者

  • 利润?很可观,但没你想的那么多;
  • Bot 策略各异,但顶级交易者的超额收益大多在 0.5~2 秒内衰减;
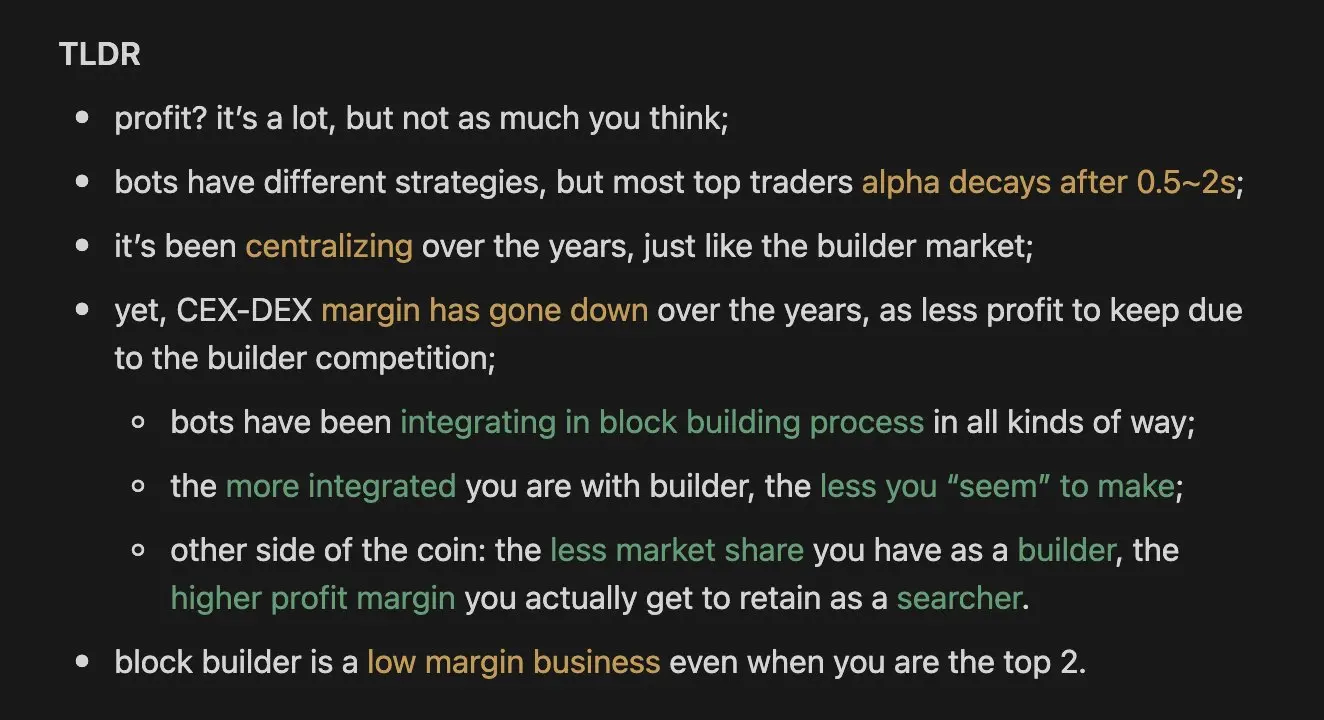
  • 市场集中化愈演愈烈,区块构建者(builder)领域亦如此;
  • 不过,随着区块链构建者竞争加剧,CEX-DEX 套利利润空间逐年压缩;
  • Bot 正以各种方式深度融入区块构建流程;
  • 与区块构建者绑定越深,“表面”利润越薄(实则转移至关联方);
  • 区块构建者市场份额越小,其关联套利者保留的实际利润率反而越高;
  • 即便稳居行业前二,区块构建仍是一门苦生意(利润薄如纸)。

相对详细版

在我们采集的 1 年零 7 个月数据中,19 个头部的 CEX-DEX 套利机器人数据表现如下:

  • 交易总量达2410亿美元;
  • 提取2.338亿美元利润;
  • 仅保留 9010万美元净收益(向区块构建者支付了1.437亿美元分成);

综合来看,CEX-DEX 套利平均利润率为38.5%。

区块构建者

基于套利者的市场份额分析,我们确认 CEX-DEX 的MEV市场集中化趋势已达到“高度垄断”级别。

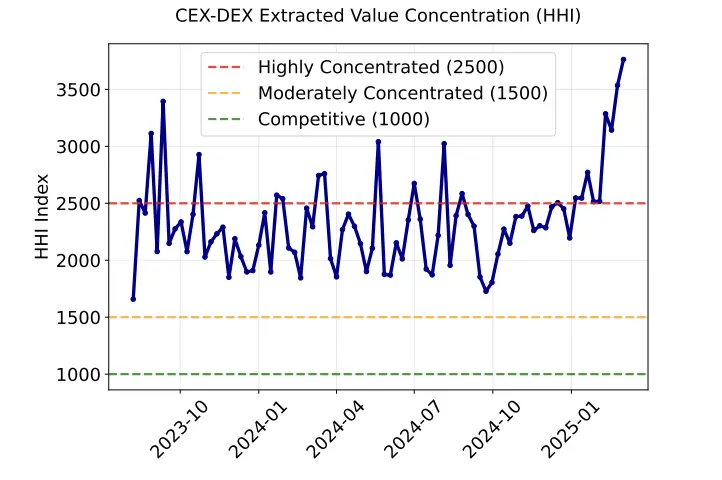
沿用 @0xRezin 提出的“英雄联盟”段位标签系统,我们计算了套利机器人的币安标记价差(markouts),采用加权平均值定义其对冲前的“总收入”。

数据显示,多数 CEX-DEX 套利信号在数秒内急速消失。通过中位数分布可观察到收入峰值 —— 即最佳对冲时机出现在0.5-1.5秒区间。

扣除支付给区块构建者的分成后,我们得到了 Bot 利润的上限估值。

区块构建者

那么结合了套利者的利润修正后,当前排名前三的区块构建者的收益到底如何?

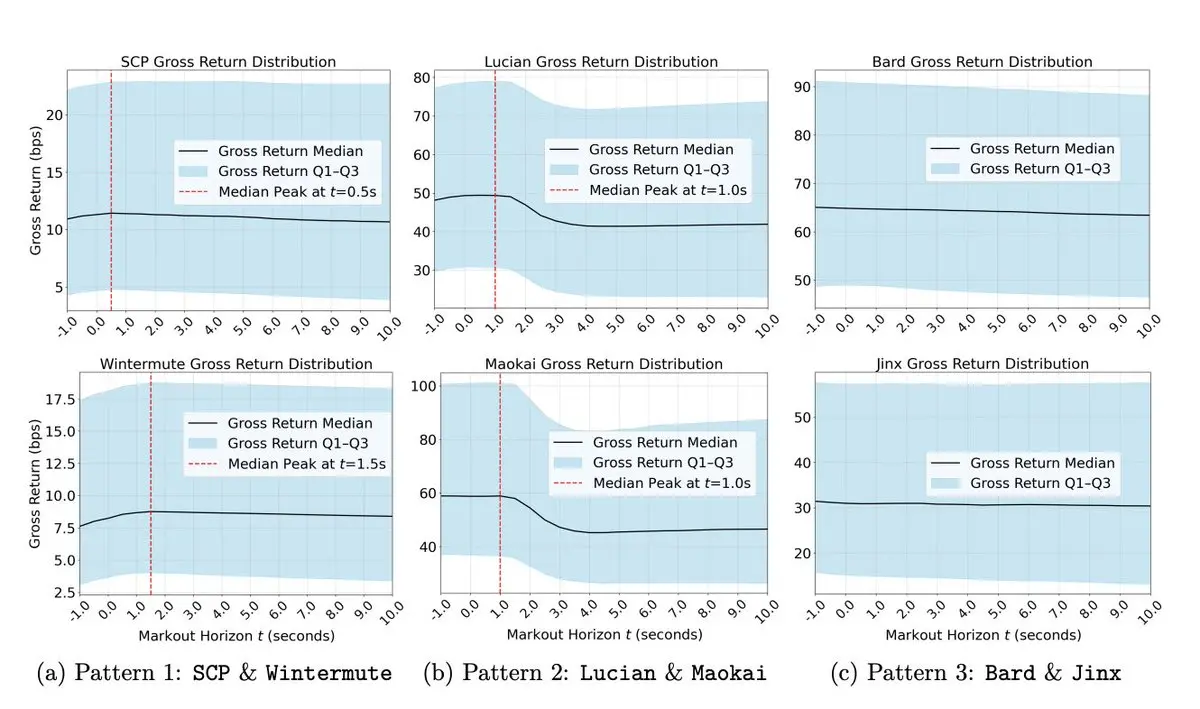
自 rsync(当前排名第三)去年中放弃“订单流战争”后,其市场份额明显跳水,但无人察觉的是,其利润率已从 5% 急速回升至 25%+,这使其综合利润率(套利+区块构建)达到了约 27%。

区块构建者

然而排名前两位的区块构建者实力盈利却很有限。

在18个月数据周期内,beaverbuild(当前排名第一)的综合利润率仅7.92%(含套利收益),而无自营套利的 Titan(当前排名第二)利润率仅5.85%。

区块构建者

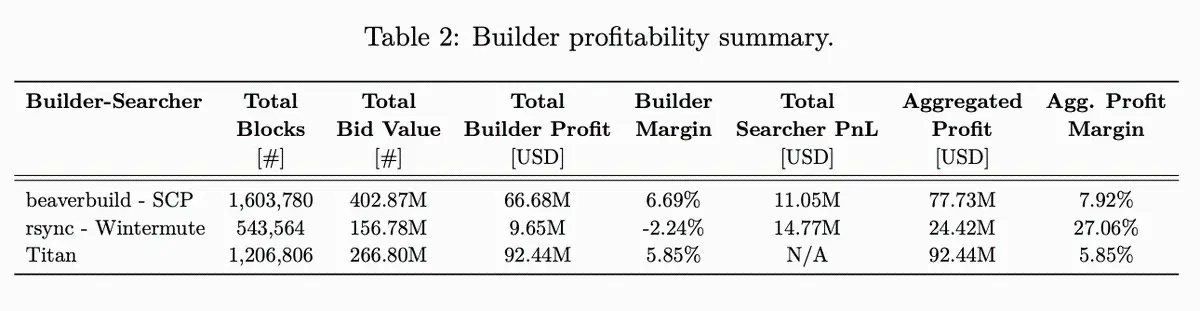
显然,不透明的“订单流”交易使得这一情况更难以解释。

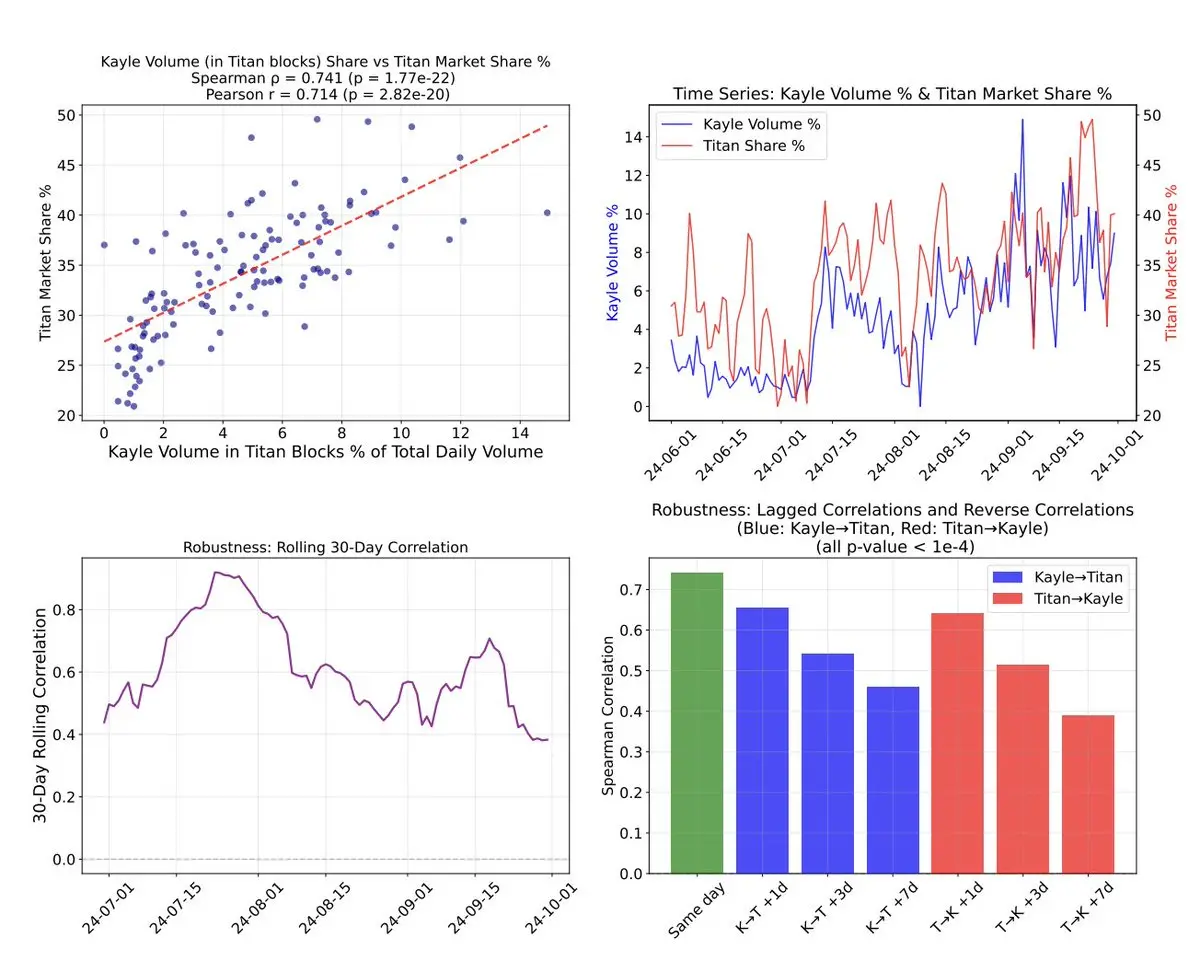
除已知的 beaverbuild + SCP、rsync + Wintermute 等“区块构建者 + 套利者”组合外,相关性分析揭示了另一组显著的排他性合作案例。观察下图中“Kayle 在 Titan 构建区块中的交易量占比”与“Titan市场份额”的 30 天滚动相关性,即见看出端倪。

区块构建者

我们的核心结论是,区块构建属低利润业务,若未持有超高 MEV 价值的订单流,当今市场已无入场机会。

此外,当前的区块拍卖机制存在严重的低效问题。一方面,补贴机制会压榨区块构建者的利润;另一方面,排他性合作会割裂订单流,延长交易上链等待时间。

但现状并非不可改变。Flashbots 新推出的 BuilderNet 或许能够能破解困局,提升区块构建者收益。

İlgili Okumalar

Report Interpretation: J.P. Morgan Details Micron's Pre-Earnings Sentiment, Current Hardware Sector Dynamics

Morgan Stanley analyst Joshua Meyers' report (June 21, 2026) highlights key trends in the hardware and semiconductor sector ahead of Micron's earnings. The core takeaways are: 1. **Micron & Memory:** Memory remains a high-conviction long theme, driven by strong AI demand and rising ASPs. However, investor focus is shifting to the sustainability of Micron's >80% gross margins and the specifics of potential new long-term supply agreements (SCAs). 2. **Hardware Supply Chain:** AI-related demand for servers, networking, and storage remains robust, but company performance is diverging. Celestica (CLS) shows improved margin confidence, Western Digital and Seagate benefit from pricing, Fabrinet (FN) sees predictable AI optics growth, and Teradyne (TER) anticipates a new Google customer. 3. **AI Capex & WFE Forecasts:** JPMorgan increased its Wafer Fab Equipment (WFE) market growth forecasts to 28% in 2026 and 29% in 2027. AI infrastructure financing is evolving, with higher project-level debt reducing constraints on capex expansion. The report signals that while the AI-driven hardware cycle is strong, the market is entering a phase focused on execution verification (e.g., Micron's SCA details, Fabrinet's ramp with Amazon) and valuation sustainability. Key near-term signals include Micron's guidance, Arista Networks' outlook, and the pace of demand normalization post potential tariff-related pull-ins.

marsbit7 saat önce

Report Interpretation: J.P. Morgan Details Micron's Pre-Earnings Sentiment, Current Hardware Sector Dynamics

marsbit7 saat önce

Research Report Analysis: The Fed's New Chair's Debut – New Leader, But Same Script?

Report Analysis: Federal Reserve's New Chair Debut – A New Captain, But the Same Script? Morgan Stanley's chief global economist Seth B. Carpenter analyzes the first FOMC meeting under new Fed Chair Kevin Warsh in a June 21 report. Warsh deliberately avoided providing forward guidance on interest rates, aligning with his philosophy. However, market expectations for a rate hike this year were reinforced. Key signals lie elsewhere: inflation may fall more than expected, and quantitative tightening (QT) could be more aggressive than anticipated. The FOMC's "dot plot" suggests only one rate hike in 2026. Carpenter argues that if inflation undershoots forecasts, the logic for even a single hike weakens, especially as projections indicate potential rate cuts in 2027. On QT, Warsh's stance is clear. Carpenter notes that measures like halving the Treasury's account balance could shrink the Fed's balance sheet by around $500 billion with minimal market impact. Combined with adjustments to reserve interest and liquidity rules, the ultimate QT scale may exceed expectations, though its market effect might be less disruptive unless the Fed actively sells Mortgage-Backed Securities (MBS). While Warsh initiated a review of the Fed's policy framework, the 2% inflation target remains intact for now. The report concludes that the market may be overestimating the significance of reduced forward guidance and the near-term rate hike risk, while potentially underestimating the scope and manageable nature of the coming balance sheet reduction. The key debates will hinge on upcoming core PCE data, the specifics of the QT path, and the framework review's findings.

marsbit7 saat önce

Research Report Analysis: The Fed's New Chair's Debut – New Leader, But Same Script?

marsbit7 saat önce

Critical Game Week: BTC Retracement Confirmation vs. HYPE Support Battle | Guest Analysis

This weekly analysis outlines a critical juncture for BTC and HYPE markets, focusing on key price level confirmations. **BTC Analysis:** BTC is at a pivotal point after a five-wave rally from the June 5th low of $59,100. The price has broken below a short-term rising channel's lower boundary, with the current move seen as a pullback to test this breakdown. Failure to reclaim this level could lead to a retest of the $59,000-$60,000 support zone. The core scenario hinges on this channel retest outcome. * **Key Levels:** Resistance at $64,500-$65,000 (channel boundary) and $69,500-$70,500. Support at $59,000-$60,000 and $55,000. * **Strategy:** A core bearish stance is maintained (20% short from last week), with short-term plans for tactical trades. Three detailed contingency plans (A/B/C) are provided for short positions on resistance tests or breakdowns, emphasizing strict stop-loss discipline. **HYPE Analysis:** HYPE shows strong momentum but is currently in a corrective phase after hitting a new high of $76.94. The price is retesting the crucial $64-$66 support area. * **Key Levels:** Resistance near $77 and $80-$82. Support at $64-$66 and $52-$54. * **Strategy:** The short-term approach is "buy on dips, avoid chasing rallies." A long position is considered only if clear stabilization signals appear at the $64-$66 or deeper $52-$54 support zones, with tight risk controls. **General Risk Management:** A standardized trailing stop-loss protocol is emphasized: set initial stop, breakeven at +1% profit, then trail stops upward to lock in gains. *Disclaimer: All analysis is presented as a personal trading framework, not investment advice. Market conditions are complex and require dynamic adjustment.*

marsbit8 saat önce

Critical Game Week: BTC Retracement Confirmation vs. HYPE Support Battle | Guest Analysis

marsbit8 saat önce

İşlemler

Spot
Futures
活动图片