Executive Summary
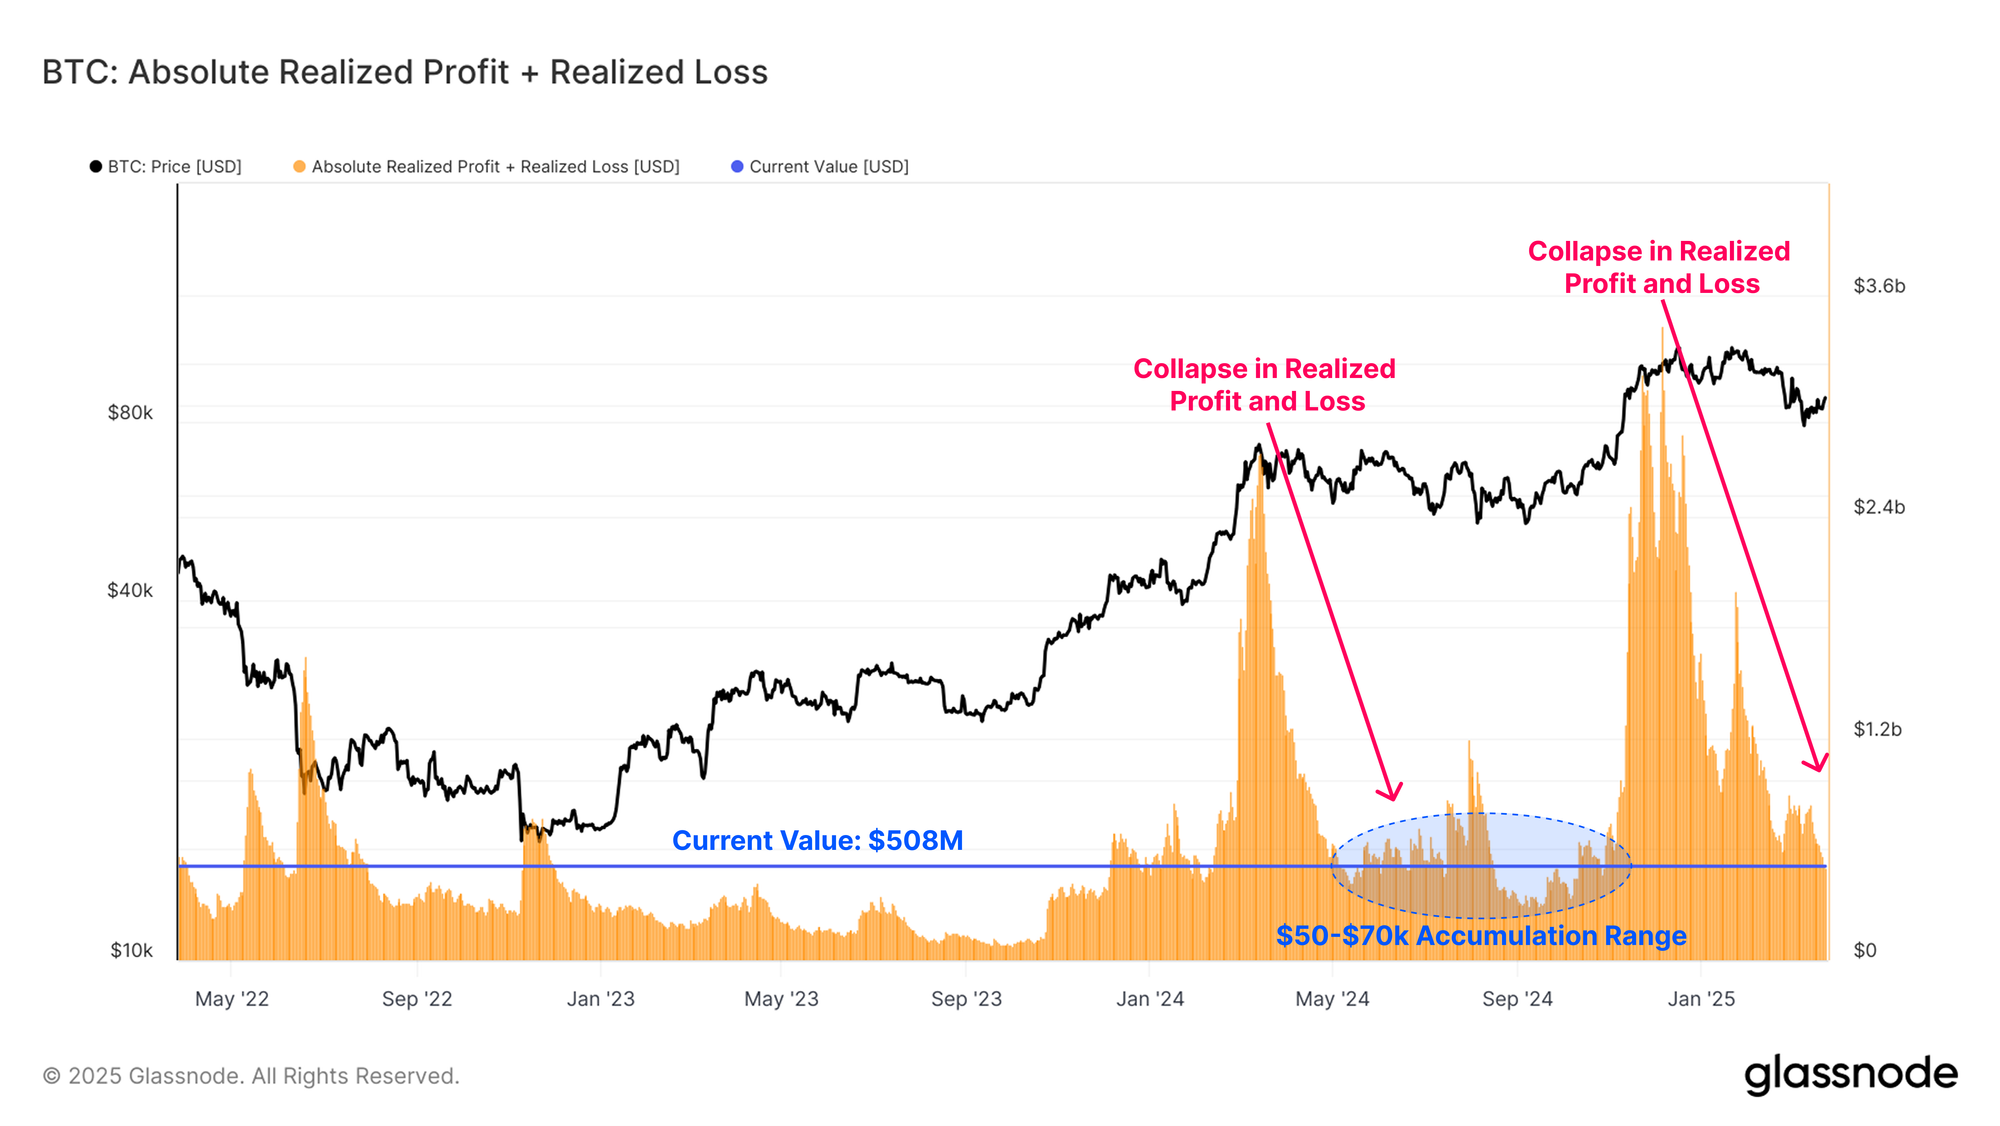
- New demand inflows continue to wane, evidenced by a stark contraction in profit and loss volumes absorbed by the market.
- The magnitude of profit and loss locked in by investors is now similar to the later stages of the 2024 accumulation range, with prices trading between $50k-$70k.
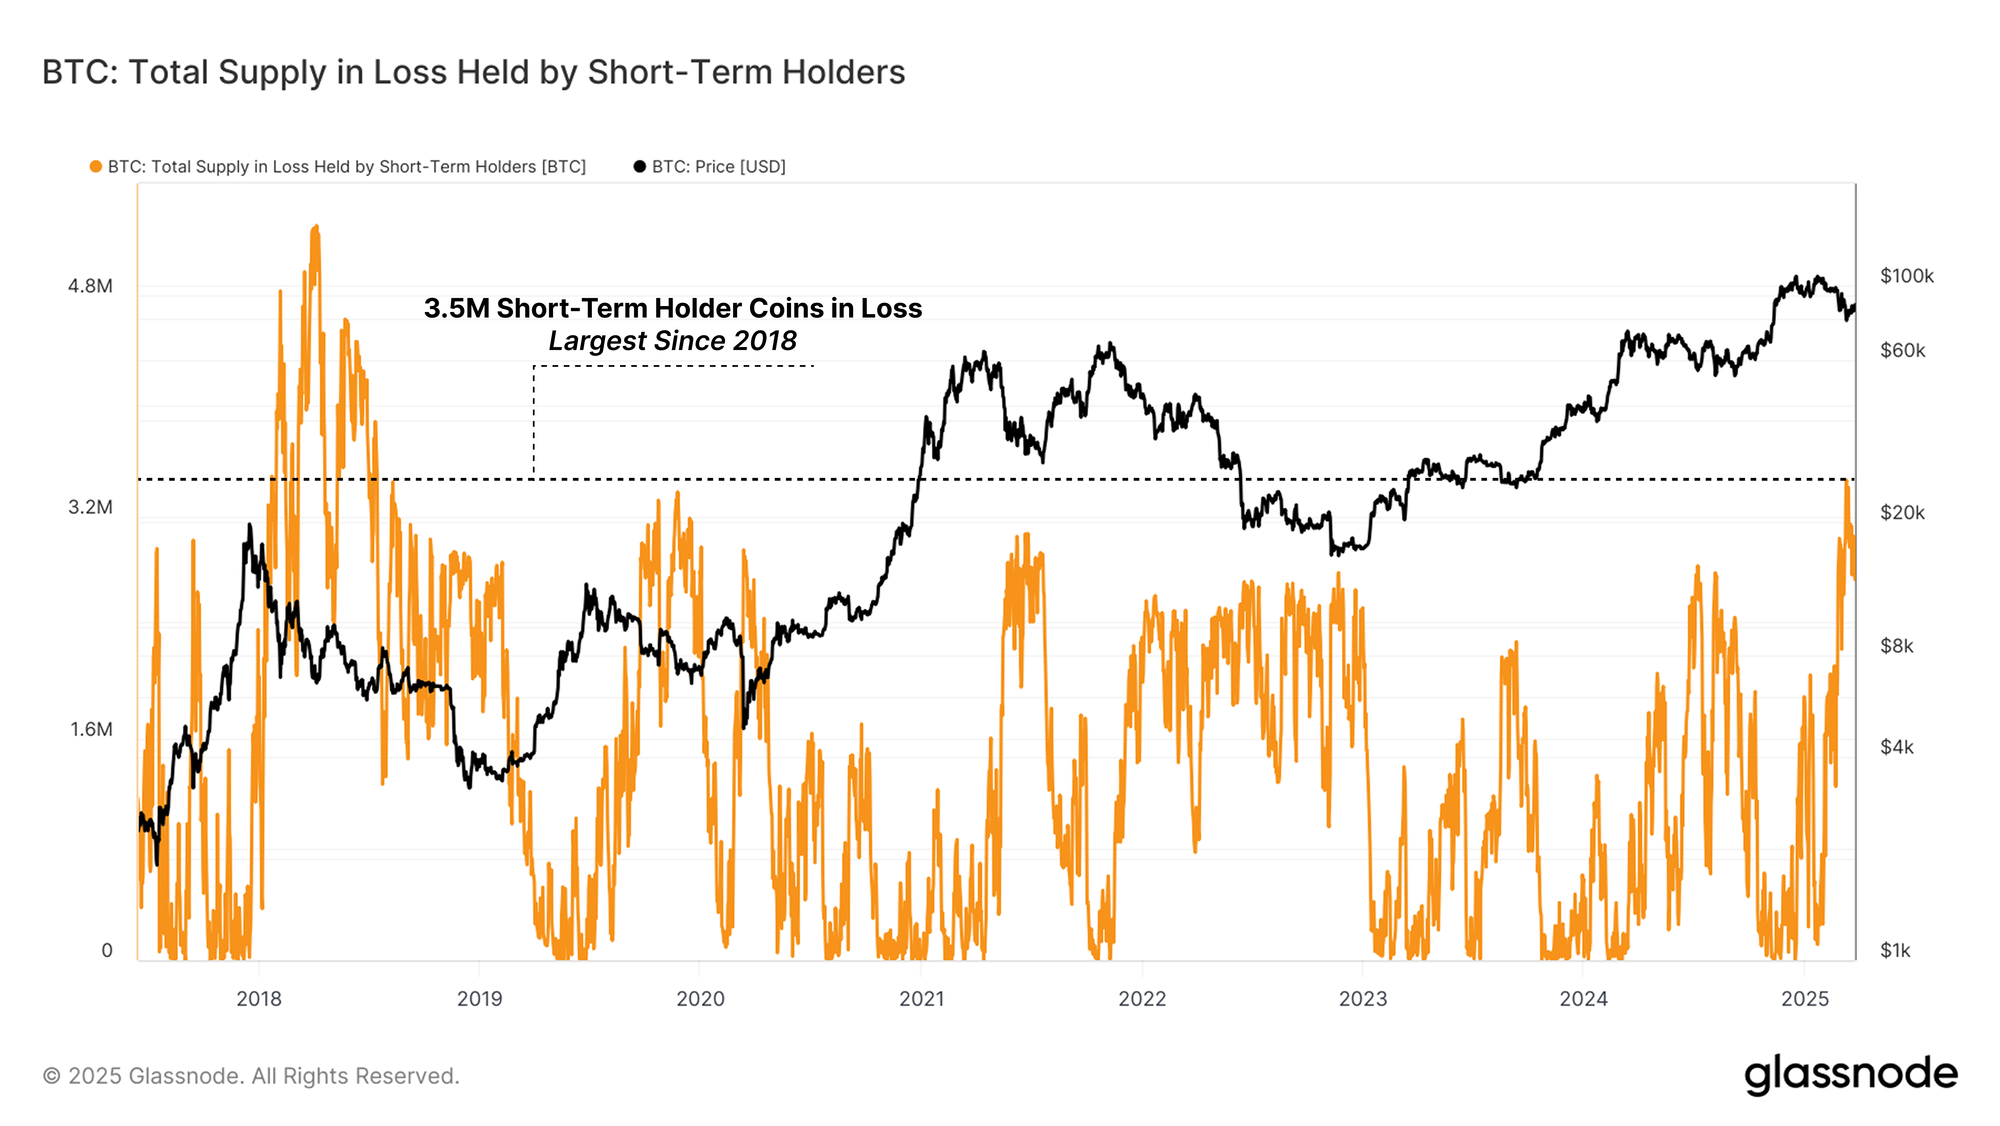
- The number of Short-Term Holder coins in loss has recorded its largest value since 2018, suggesting the majority of new-investors are now underwater on their position. However, the dollar value of loss held across these coins remains in-line with previous bull market conditions.
- Long-Term Holder supply is beginning to grow once more, highlighting an investor preference for HODLing and accumulating supply.
Demand Side Wanes
Demand-side pressure remain relatively light at the moment, with Bitcoin’s price continuing to oscillate back and forth within a newly established trading range centred around $85k. One way we can quantify demand is by assessing the volume of realized profit and loss locked in by investors, providing critical information on the sell-side forces occurring across spot markets.
We can explore this phenomenon through two key concepts:
- Capital Inflows: Fresh capital entering the network as a new buyer purchases a coin at a premium to the sellers original cost basis (thus locking in a realized profit).
- Capital Destruction: Holders who have sold at a loss (a realized loss), with a new investor picking up the coins at a discount from its original buy-price.
Ultimately, this metric describes the premium, or discount a seller was willing to transact at, and the market price at which a buyer on the other side of the trade was willing to accept.
Currently, combined realized profit and loss volumes have experienced a major contraction since the $109k ATH, collapsing from 3.4B$ to 508M$ (-85%). This metric is now recording a similar value to that seen during the 2024 accumulation zone between $50k and $70k, suggesting a similar demand profile.
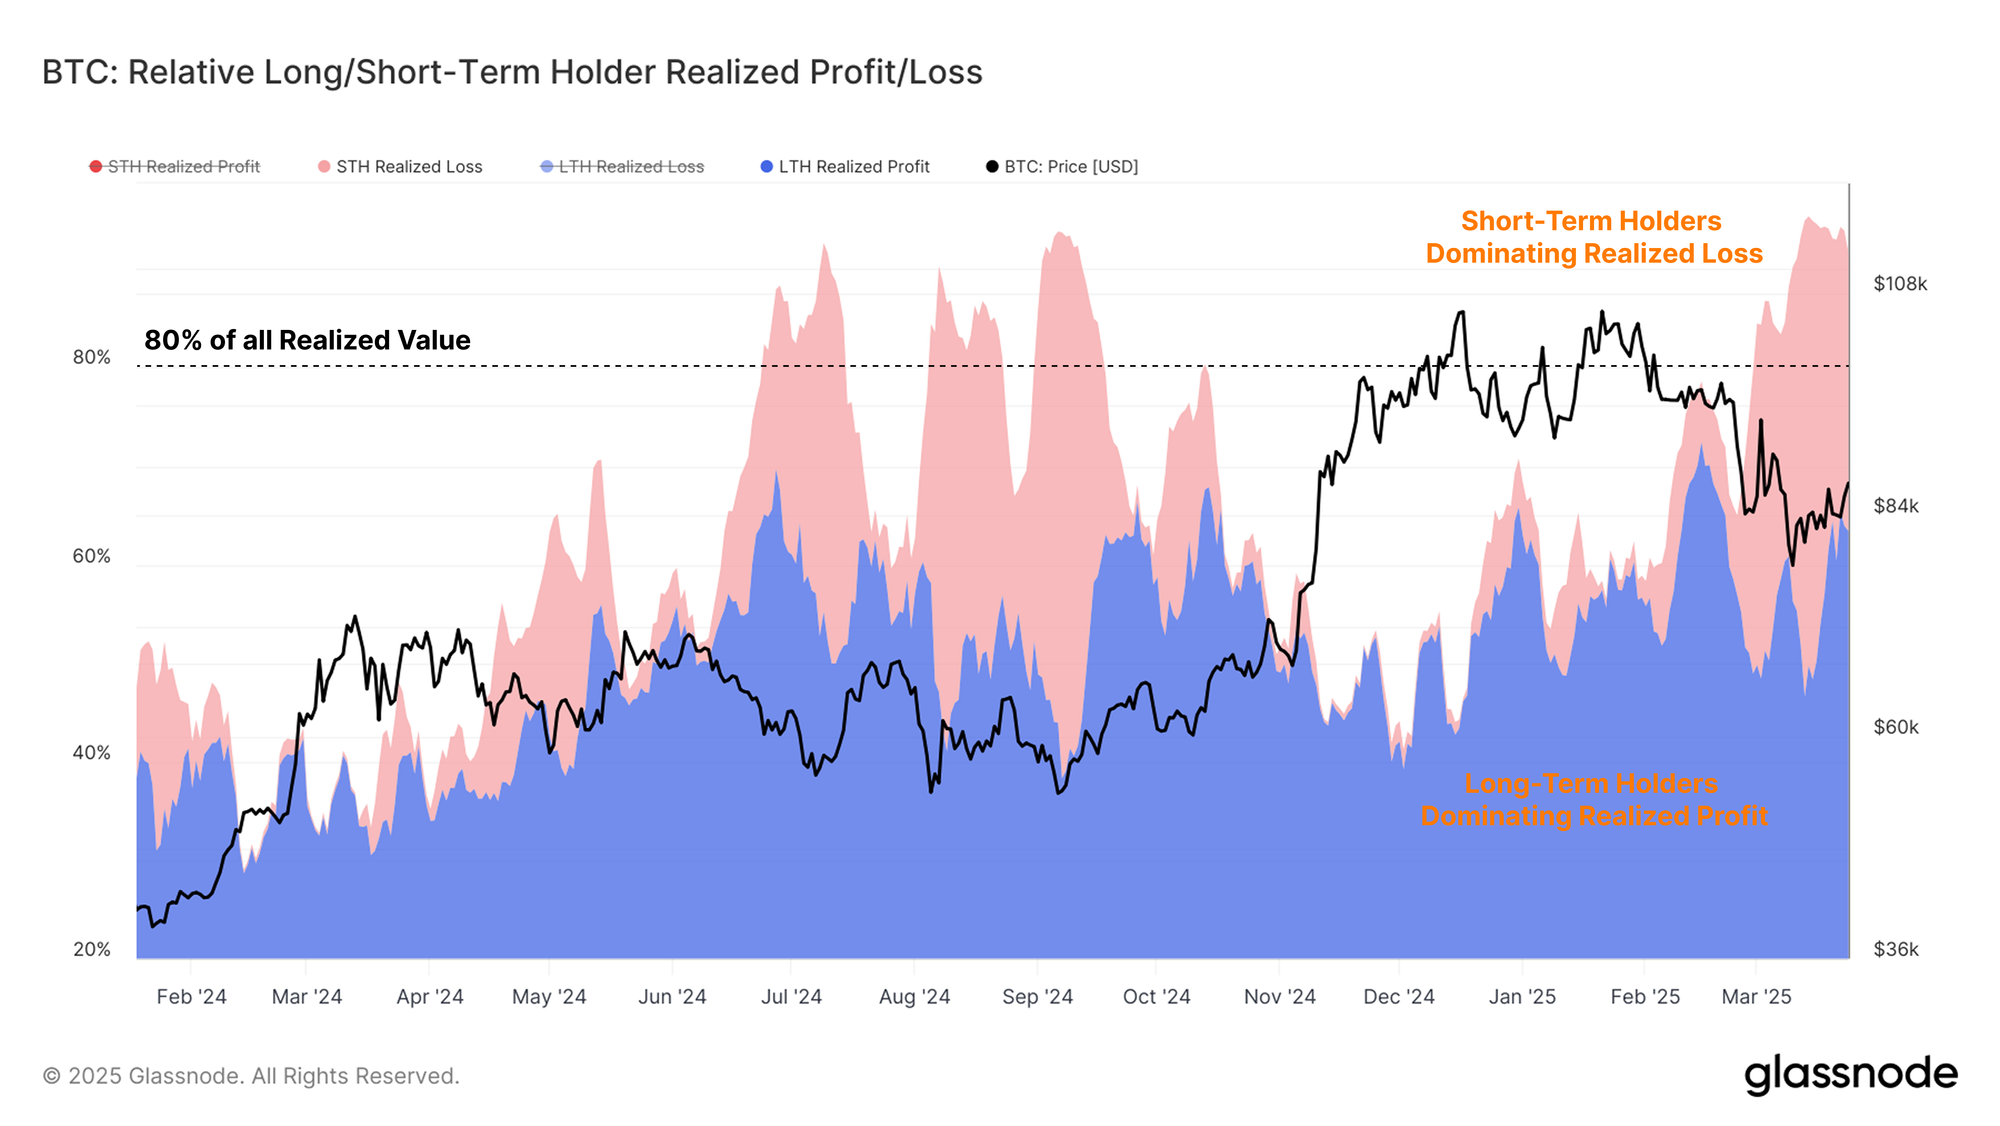
We can also notice a dichotomy in the spending behavior occurring between the Long and Short-Term Holder cohorts.
Notably, the entirety of loss taking is originating from the Short-Term Holder cohort, who represent the most recent buyers, and thus the most likely to have bought in at higher prices. The unpredictable and volatile market conditions of late has clearly been a challenging landscape for new investors to navigate.
Conversely, the lions share of profit taking is being realized by the Long-Term Holder cohort, who through their extended time in the market, remain in an entirely profitable position.
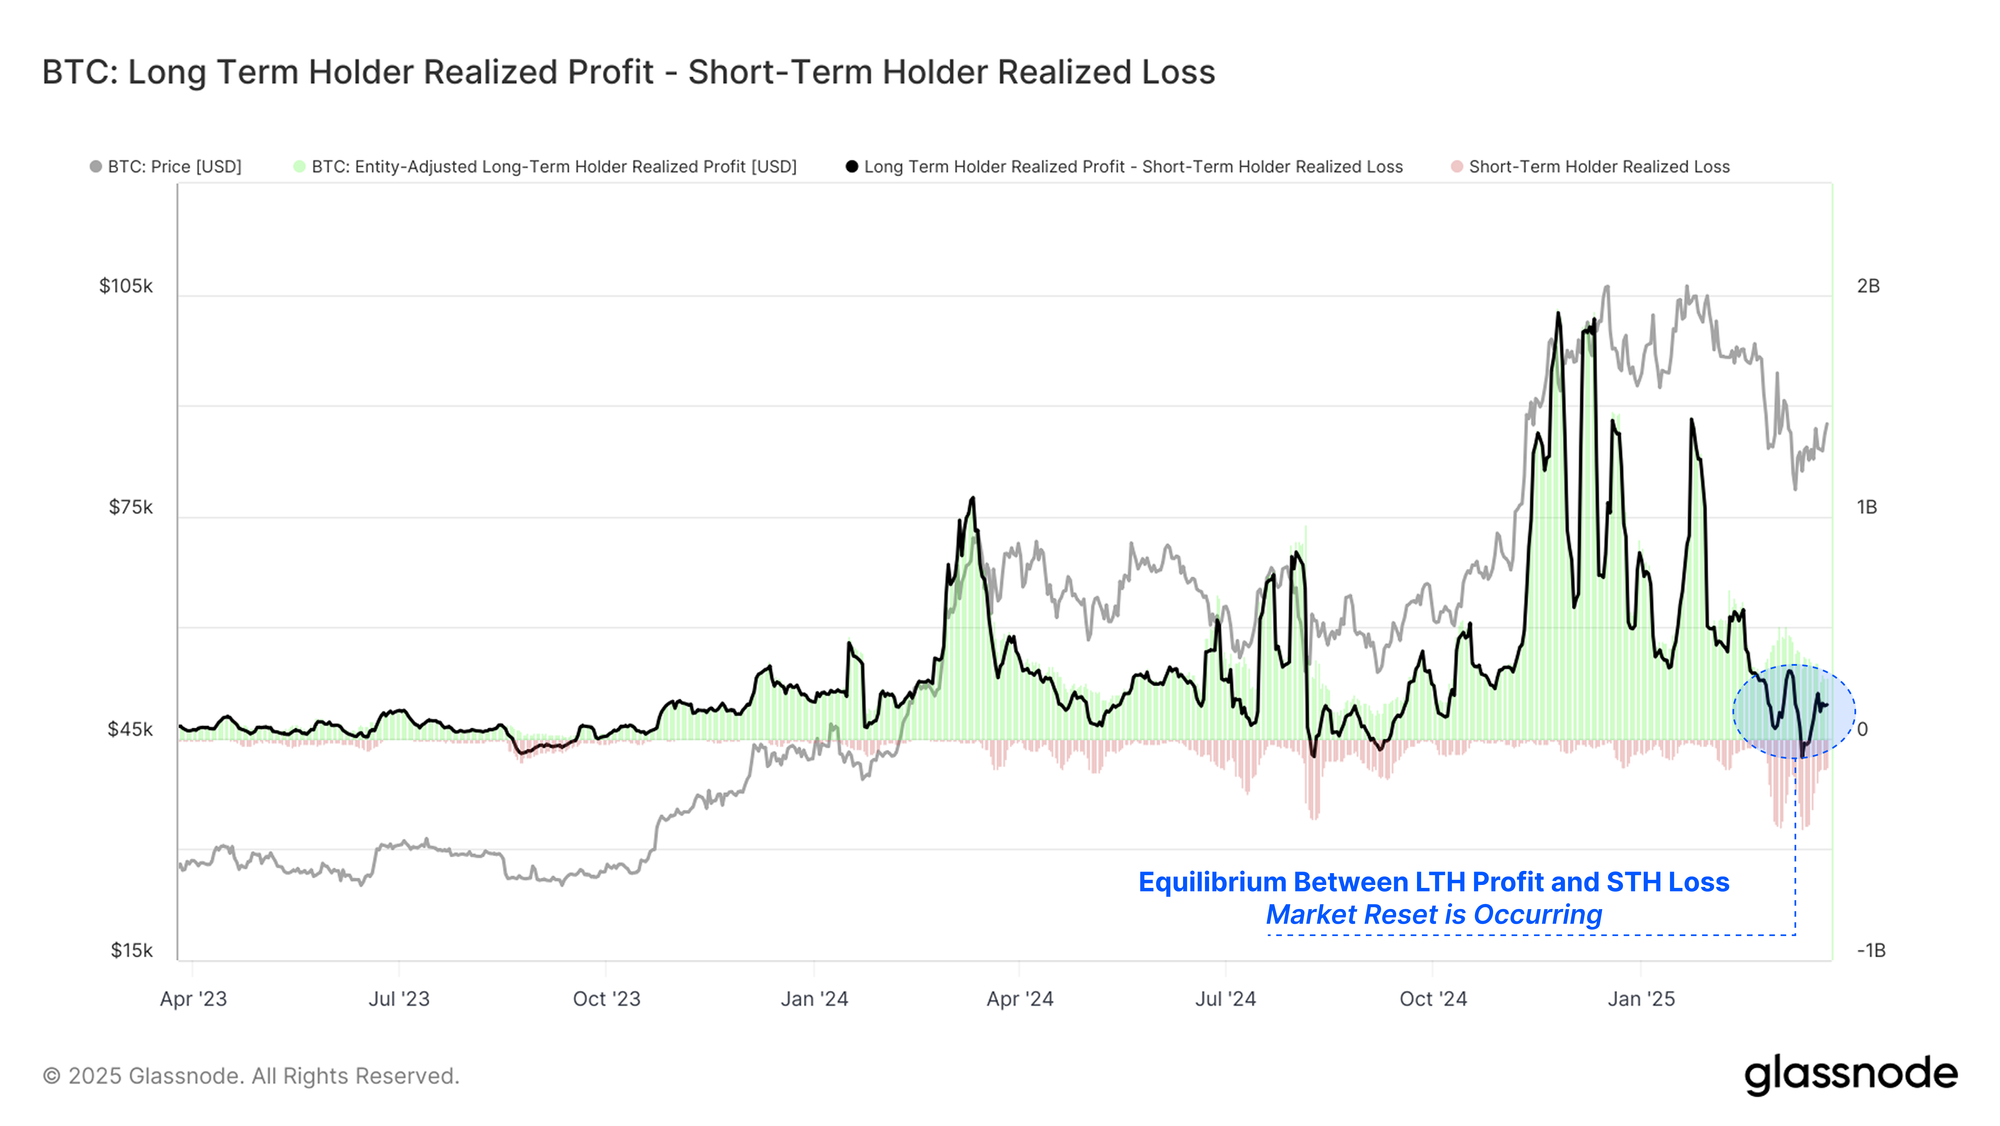
Sustainable bull markets are typically characterized by consistent and growing inflows of fresh capital entering the network, with capital inflow events significantly outsizing those of capital destruction.
When assessing the difference between Long-Term Holder profit taking, and Short-Term Holder loss realization, we can see that this metric has returned to a neutral zone. Long-term Holder profits are now being offset by an equivalent volume of Short-Term Holder losses.
This suggests a relative stagnation in new capital inflows, weaker demand-side forces, and a slowing but still meaningful volume of profit taking acting as resistance.
A Top Heavy Market?
The Short-Term Holder cohort are responsible for the majority of loss taking events in a bull market. This is usually the case during both local market corrections, as well as last-gasp sell-off when the market transitions into a protracted bearish structure. Therefore, they become the primary cohort to analyze when gauging the severity and potential depth of a market drawdown.
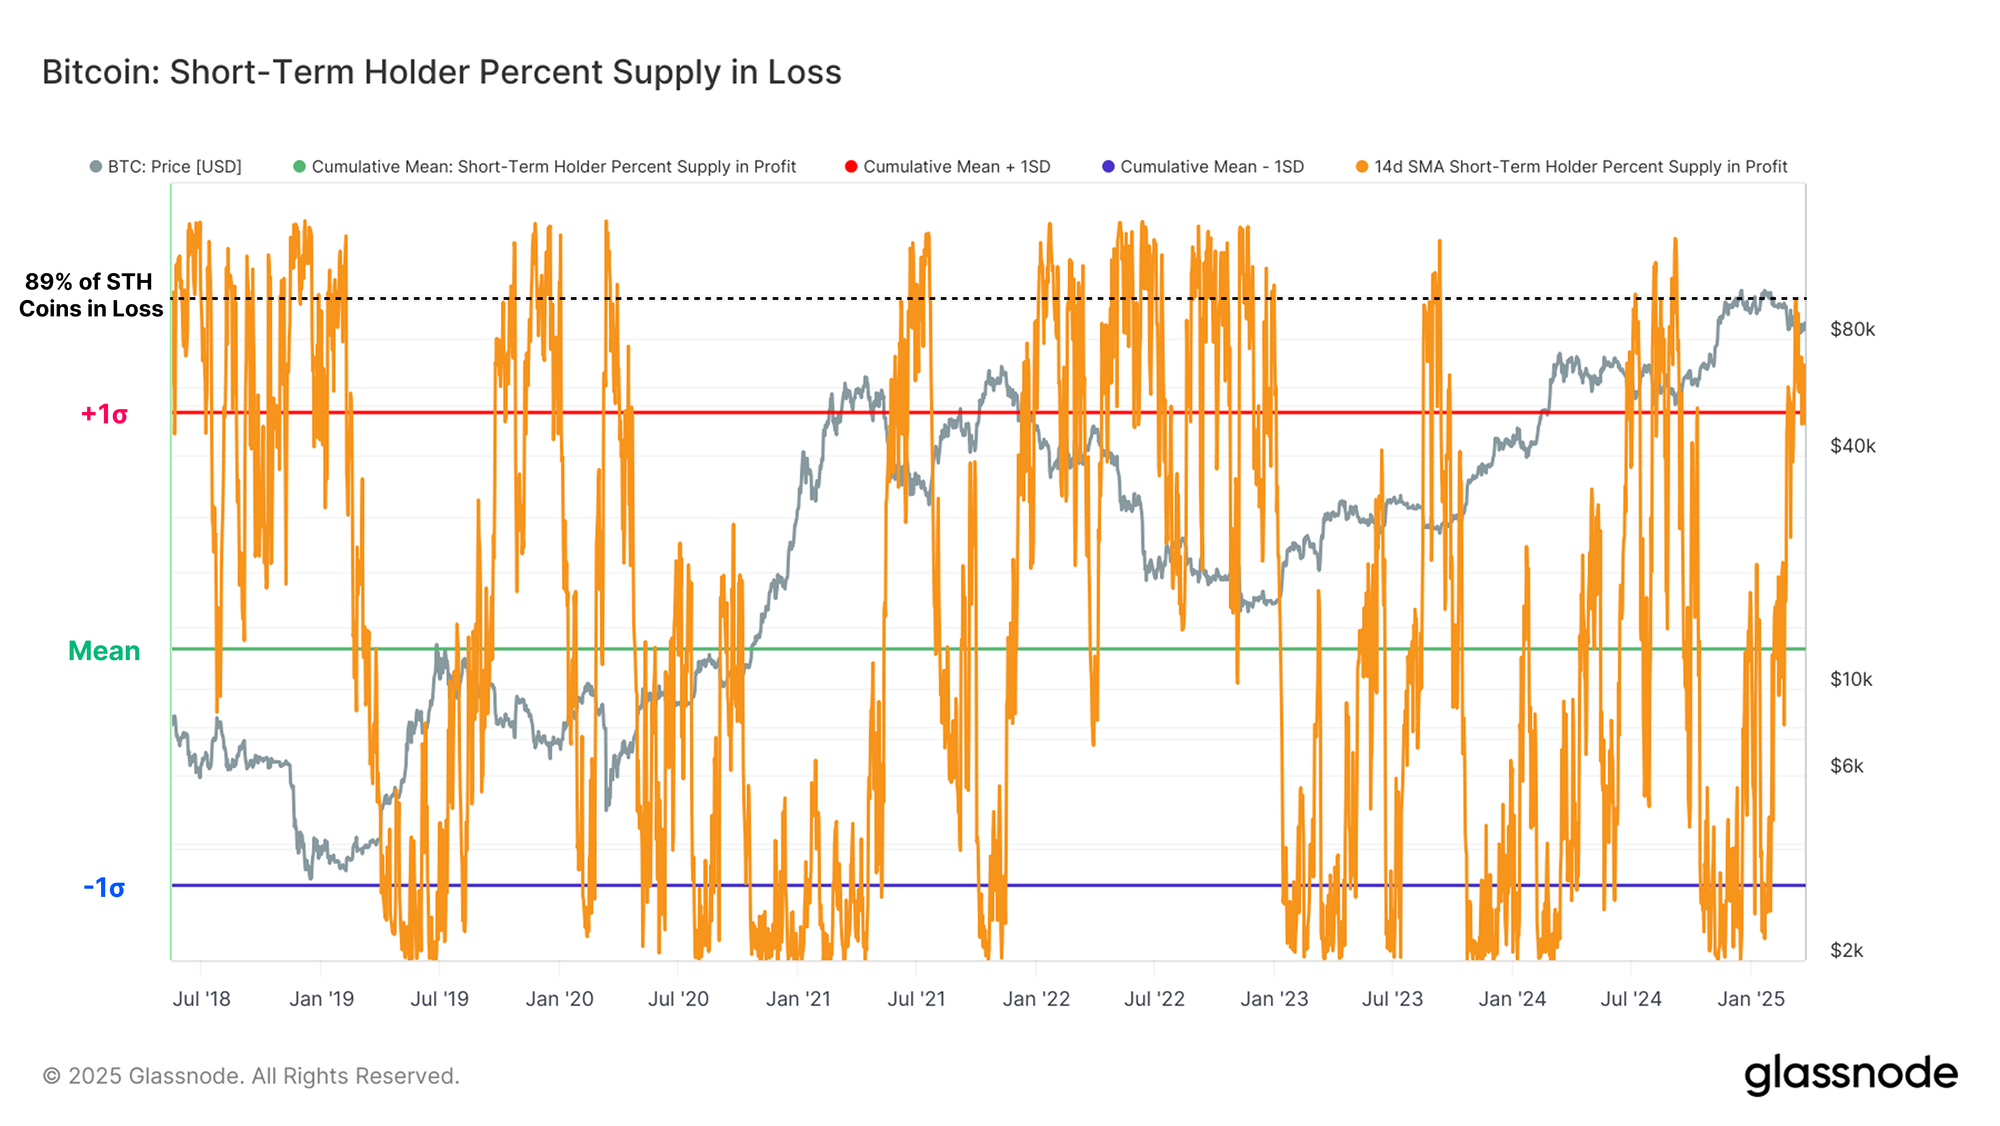
Recent downside volatility has created strenuous conditions for new investors, with the volume of Short-Term Holder supply held in loss surging to a massive 3.4M BTC. This is the largest volume of STH supply in loss since July 2018.
From a relative perspective, the percent supply in loss metric has now broken above its +1SD band, with over 90% of the Short-Term Holder supply now residing in an underwater position.
This degree of Short-Term Holder loss has only occurred twice during our current bull market, namely during the Aug 2023 downturn, and the Aug 2024 Yen-Carry-Trade unwind.
This highlights the gravity of the pressure currently being experienced by new investors, and increases the probability of a market wide capitulation event.
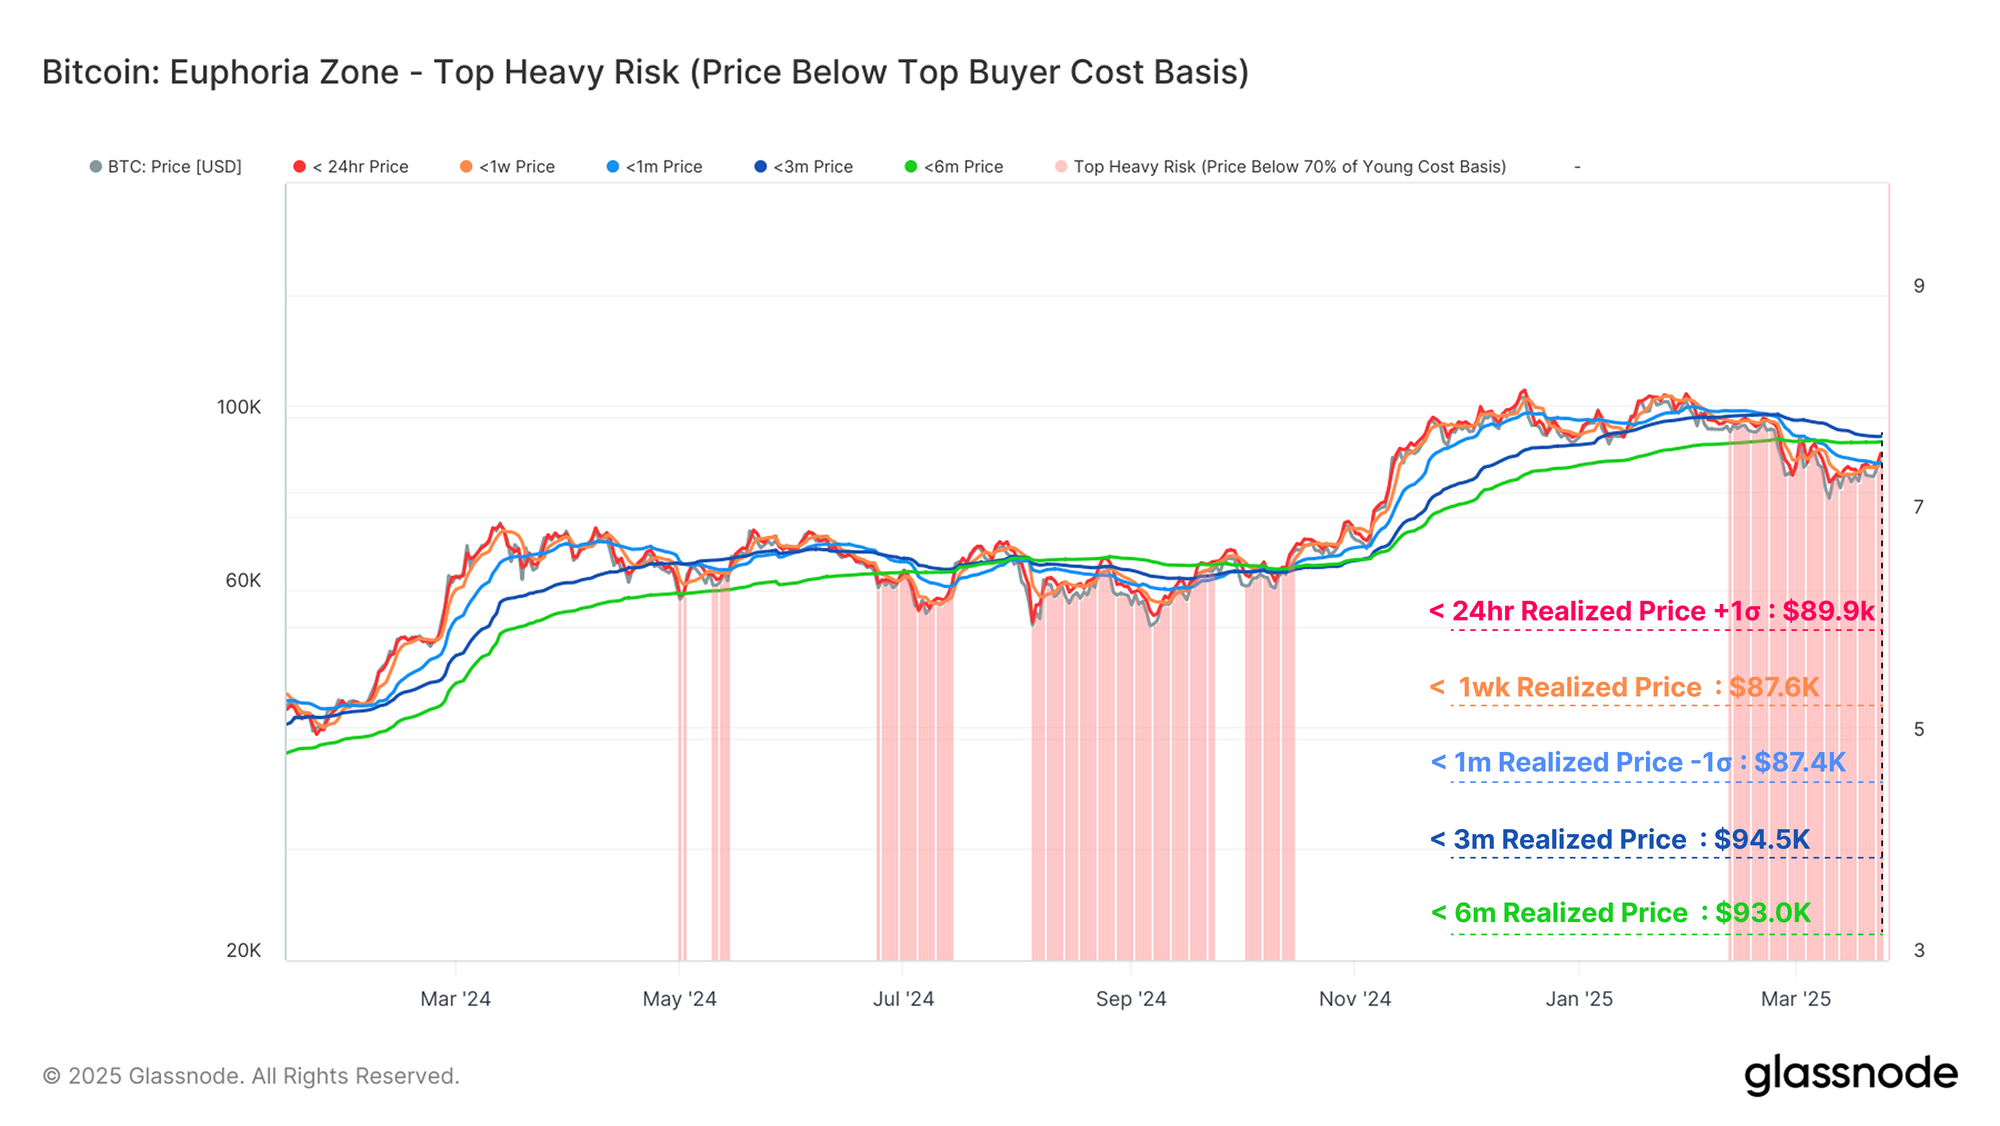
Another way to evaluate the pressure on the Short-Term Holders is to assess the cost-basis of each individual age-band subset within the cohort. We can consider these as a sort of fast-to-slow ribbon of cost basis levels, providing a sort of momentum indicator:
- < 24hr: $89.9k
- < 1wk: $87.6k
- < 1m: $87.4k
- < 3m: $94.6k
- < 6m: $93.0k
A key takeaway from this insight is that most of the STHs who have held for at least 1 month are underwater on their position. Unrealized losses are permeating throughout the Short-Term Holder cohort, creating significant financial pressure and stress for investors.
Unrealized Potential
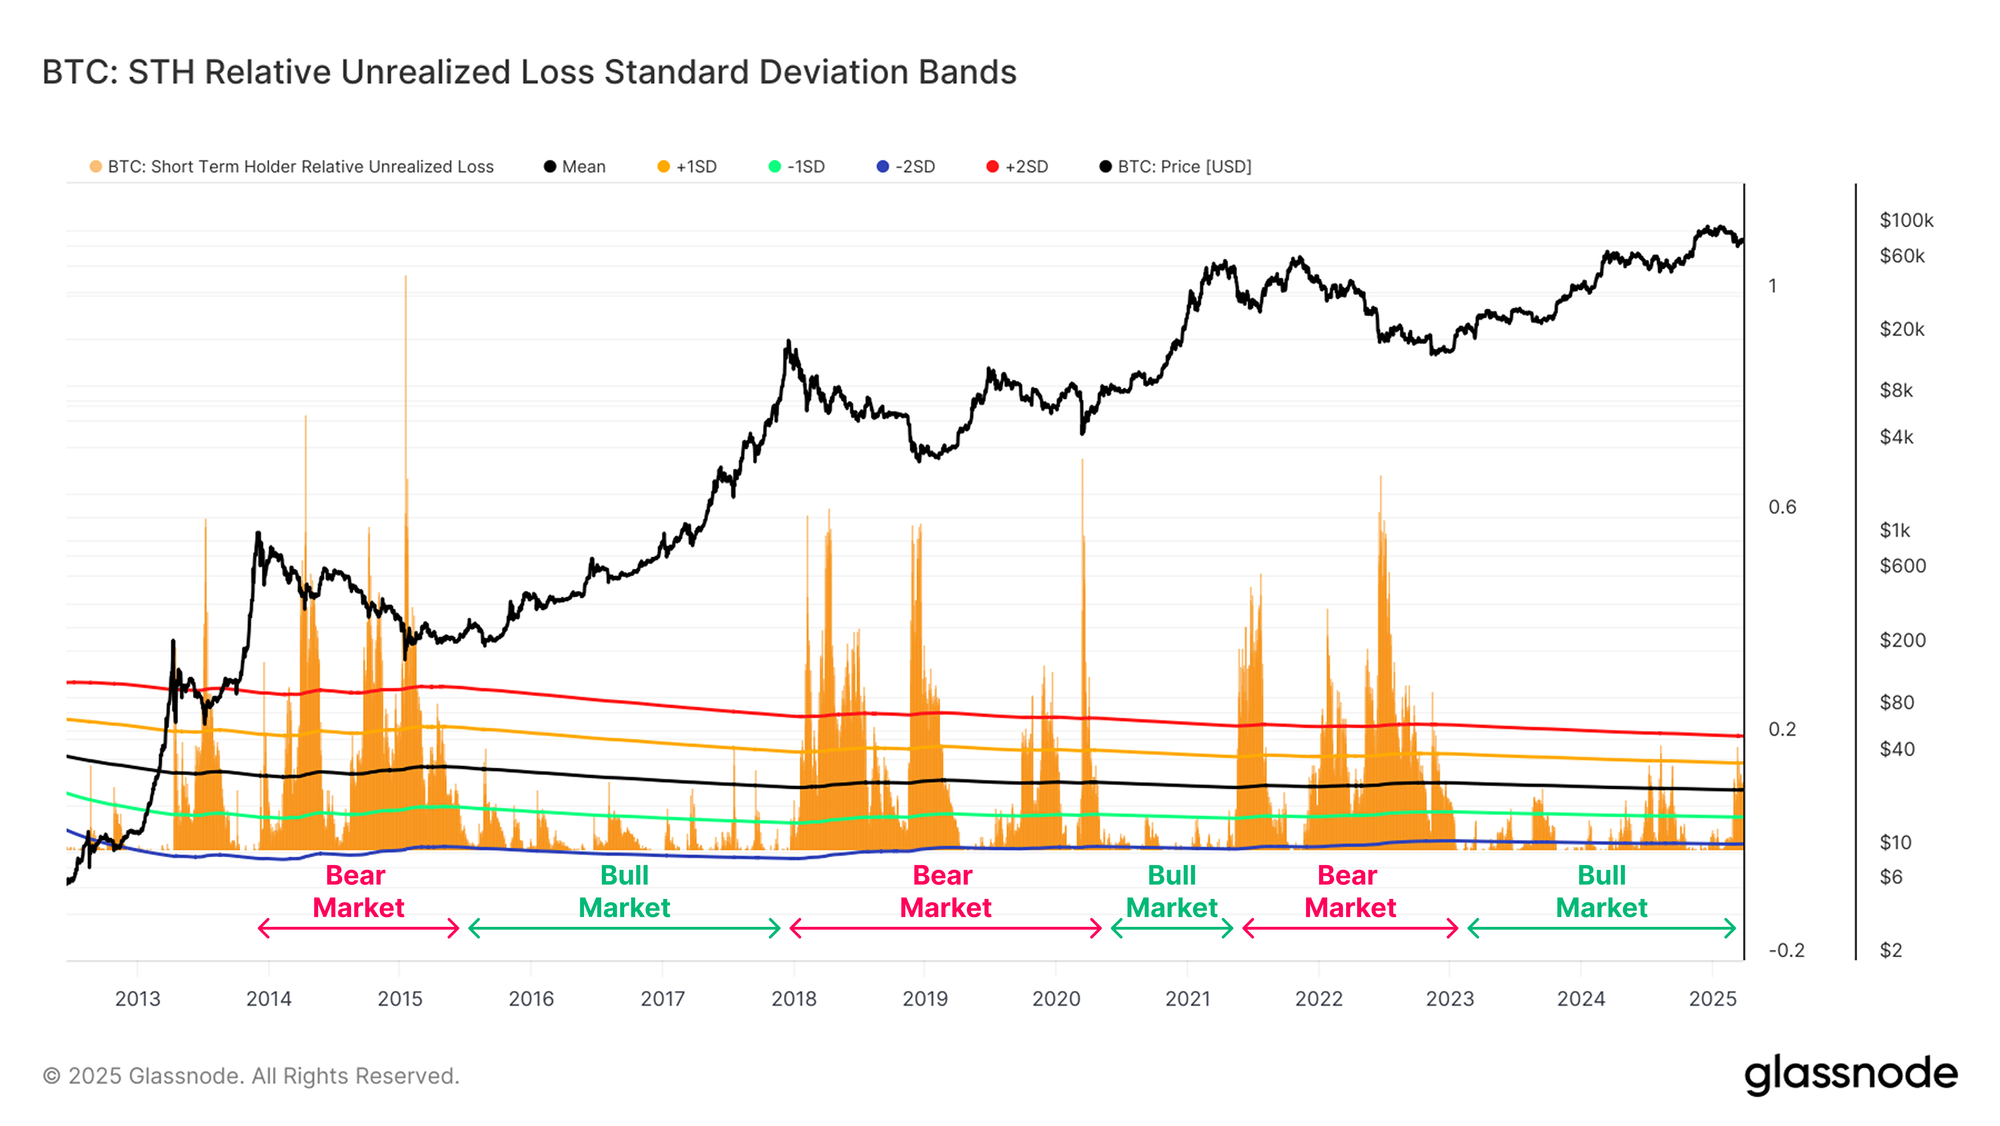
In the previous section, we determined that a significant volume of Short-Term Holder coins are now held in loss. To complement this analysis, we can also evaluate the aggregate dollar value of unrealized losses (paper losses) held by these coins.
Using both of these metrics, we can better understand the magnitude of the financial damage held by recent buyers, and compare it across two related dimensions.
From the perspective of the unrealized loss metric (paper losses), Short-Term Holders are holding relatively elevated losses, being some of the largest of this cycle. However, the magnitude of paper losses remains near the upper-bound of values we have seen during most prior bull markets.
This suggests that whilst the financial stress investors are experiencing is meaningful, it is also not yet at levels which would be considered unexpected, or atypical for a bull market uptrend.
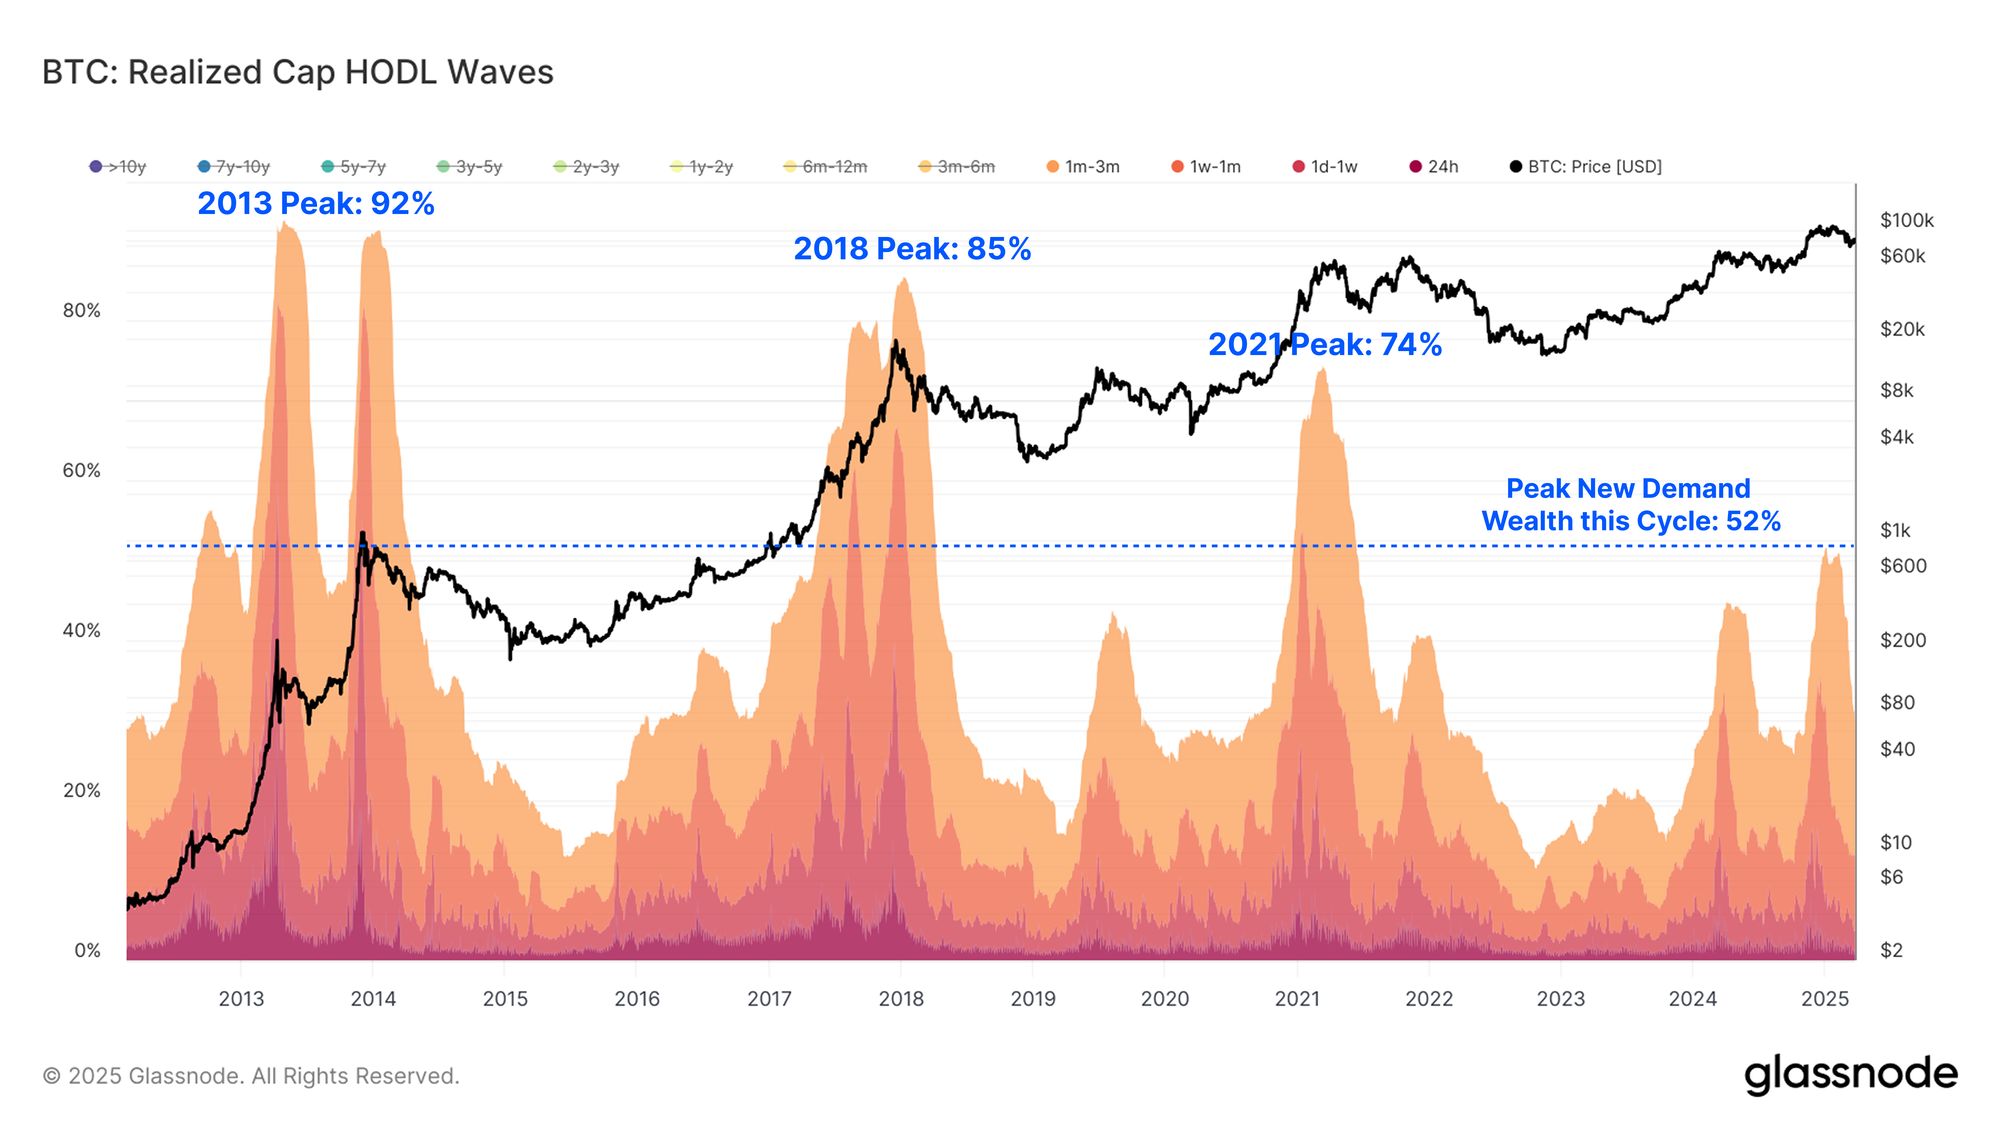
Bull markets have historically reached their zenith after the majority of the network wealth has been distributed from long-term tenured investors, to new and increasingly price sensitive speculators. These speculators eventually hold a majority of the supply at an elevated cost basis, making them highly sensitive to downside price action.
Presently, Short-Term Holders hold approximately 40% of the network wealth, after peaking at a value of 50% early in 2025. This peak remains notably lower than in previous cycles, where the wealth held by new investors peaked at around 70%-90% near the cycle peak.
There are a few potential explanations for this:
- The 2023-25 cycle has thus far experienced more lengthy sideways periods of consolidation. This has allowed a progressive redistribution of supply, followed by investors becoming acclimated to new price altitudes.
- Bitcoin in 2025 is better understood by both retail and institutional investors alike. As a result, Long-Term Holders may be more likely to hold onto more of their supply for a longer period of time, having developed a stronger conviction.
- The presence of larger institutional investors, and the ETFs may have longer term time horizons and allocation preferences. As such, a larger proportion of the supply may be held for lengthy periods of time.
There are likely many factors influencing this dynamic, and it highlights and evolution in the Bitcoin investment thesis of both new and existing Bitcoin holders.
Forging Long-Term Holders
Periods when the Bitcoin price rises significantly are often accompanied by an uptick in the intensity of sell-side pressure as investors take profit. Historically, Long-Term Holders have been the primary cohort capitalising on higher prices during bull markets.
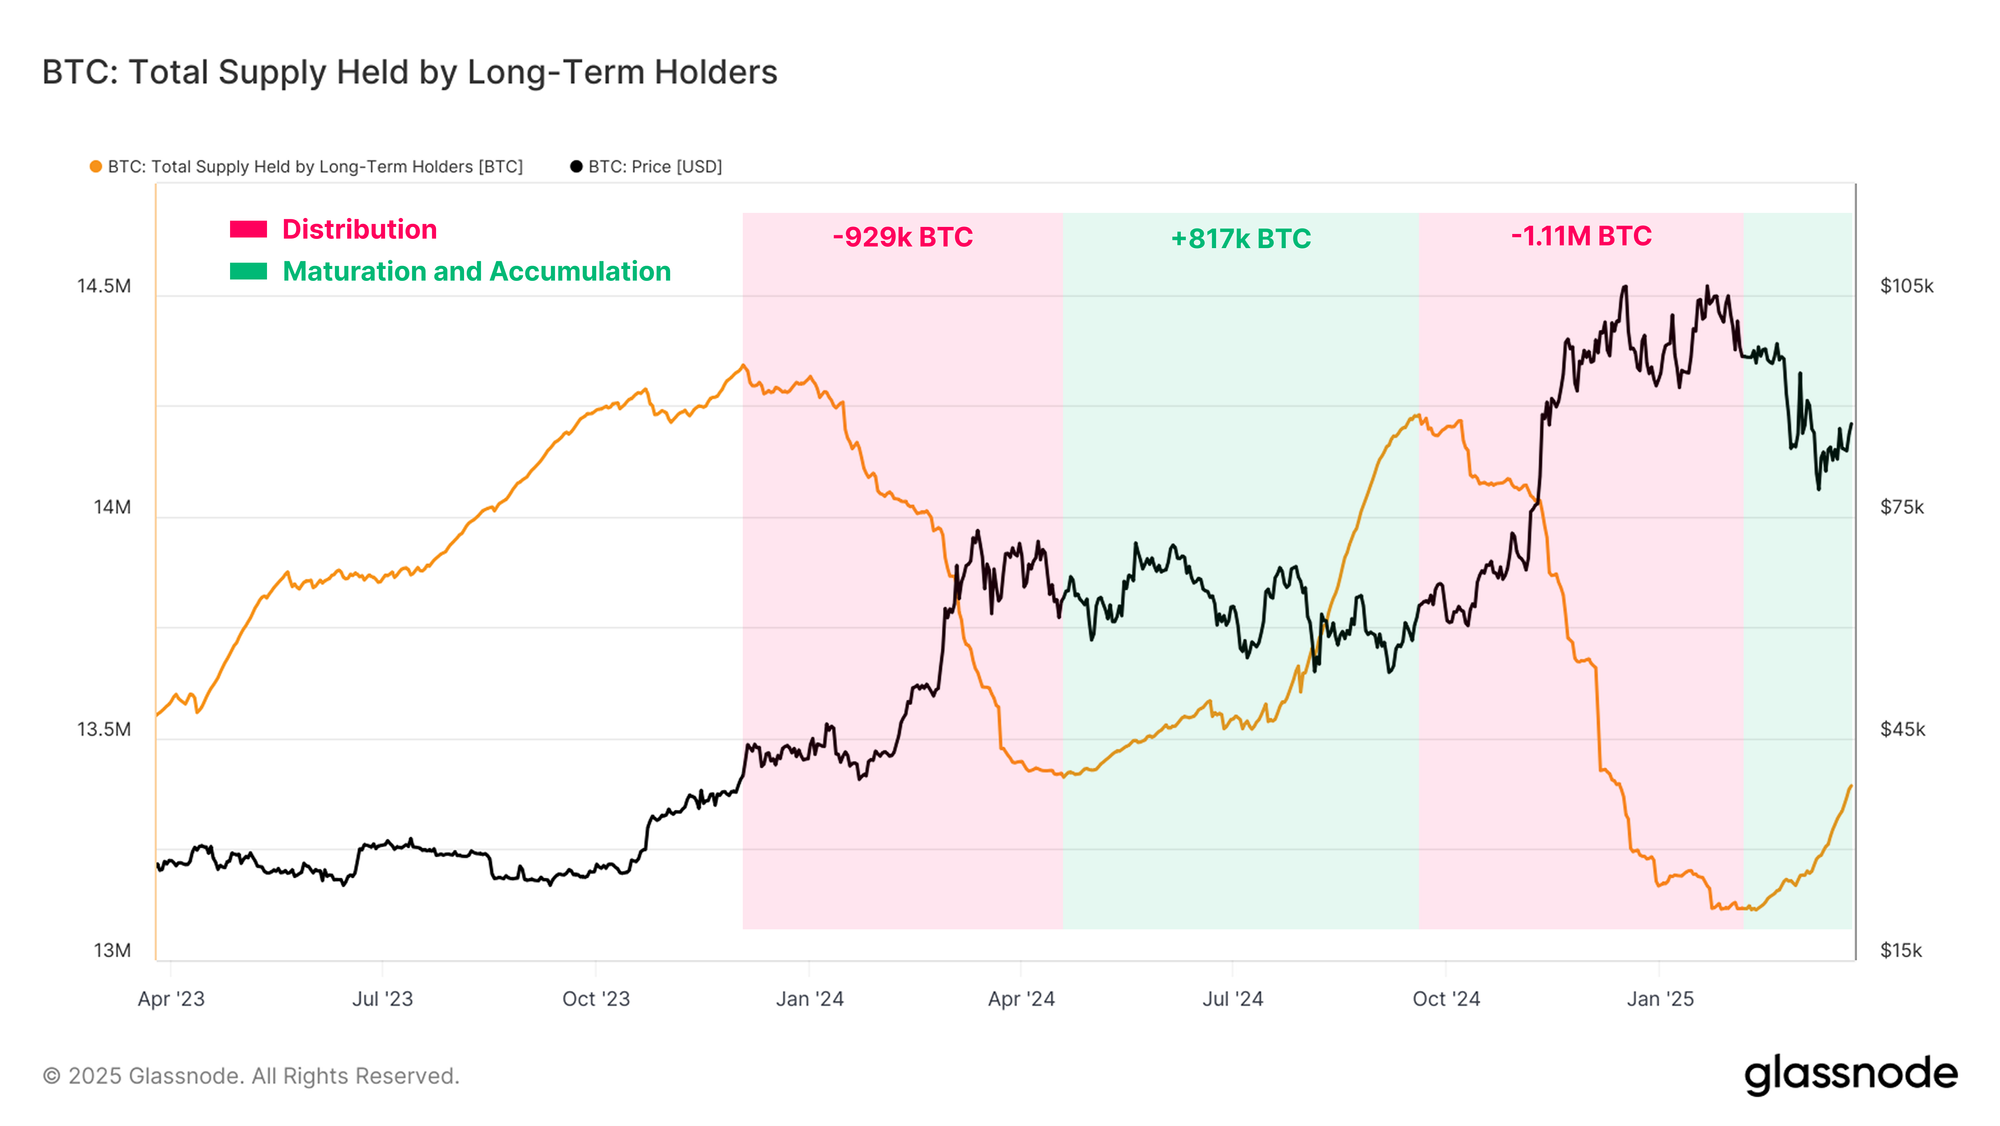
A unique market dynamic is developing within the prevailing cycle, with oscillating waves of LTH distribution followed by periods of accumulation, creating a more controlled and stable market environment. There have been two main waves of distribution and accumulation thus far:
- Distribution Wave 1: LTHs distributed -929k BTC
- Accumulation Wave 1: LTHs accumulated +817k BTC
- Distribution Wave 2: LTHs distributed -1.11M BTC
- Accumulation Wave 2: Currently +278k BTC
Across the two distribution waves, over 2M BTC in sell-side pressure has been absorbed. Generally speaking, this volume of sell-side has been enough to conclude previous bull markets, however, the periods of following re-accumulation have acted to offset a large portion of the distribution thus far.
This balance between periods of distribution and accumulation may be a key factor giving rise to the orderly price structure we are experiencing, where price surges create intense distribution and profit taking, but are followed by side-ways price action as investors re-accumulate supply.
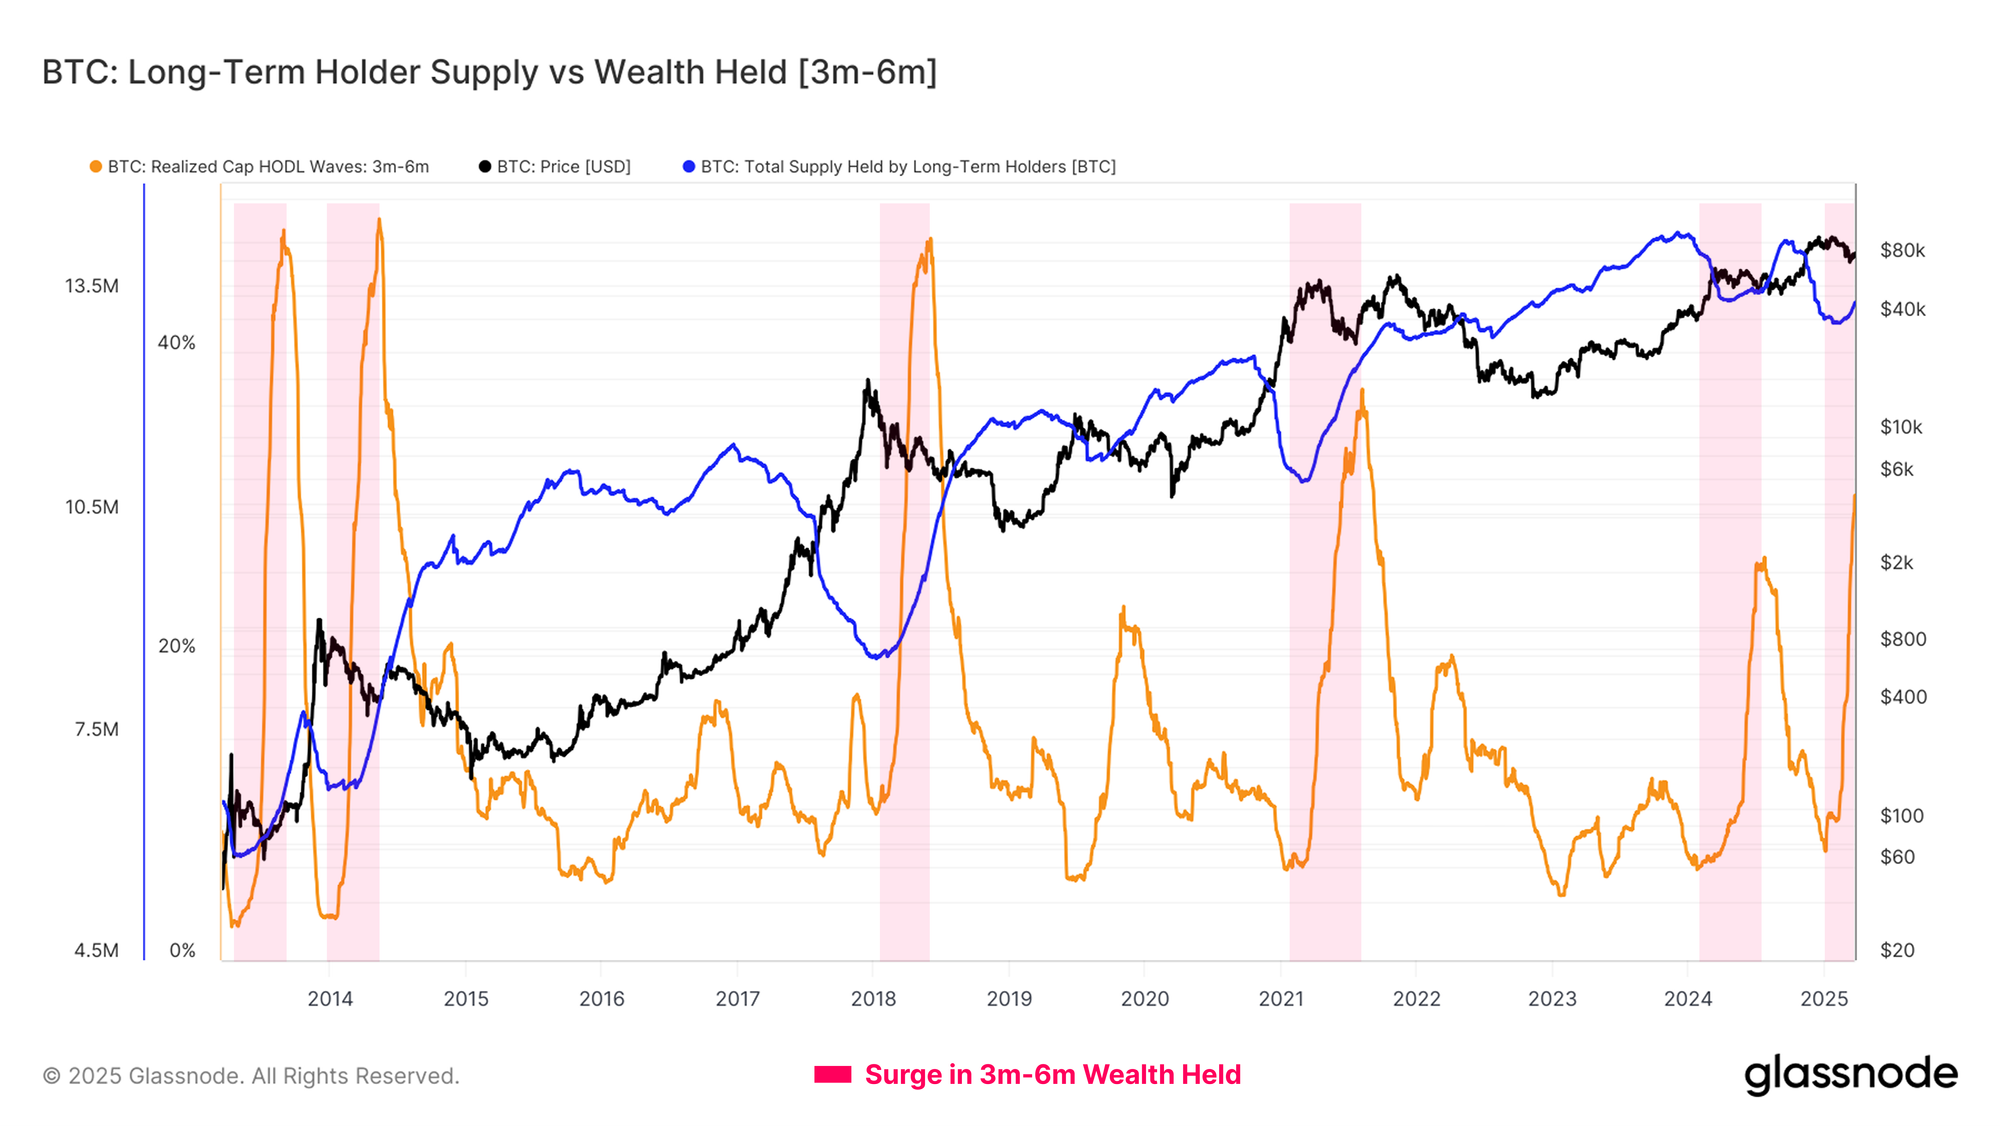
Further evidence to support a second wave of accumulation being underway can be found within the wealth held by coins aged 3m-6m. This is a very specific cohort as it exists at the transition boundary between the Short-Term Holder and Long-Term Holder cohorts. It captures the pool of supply which is most likely to migrate into LTH status over the coming weeks and months.
Presently, the 3m-6m cohort is experiencing a large uptick in total wealth held, suggesting that coins which were acquired when the market first traded up to $100k are starting to age into this bracket.
This group represents the top buyers who have not yet capitulated under the market conditions, underscoring a degree of investor confidence and patience. This behavior can be viewed as a precursor to Long-Term Holder supply growth, provided the cohort continues to HODL on.
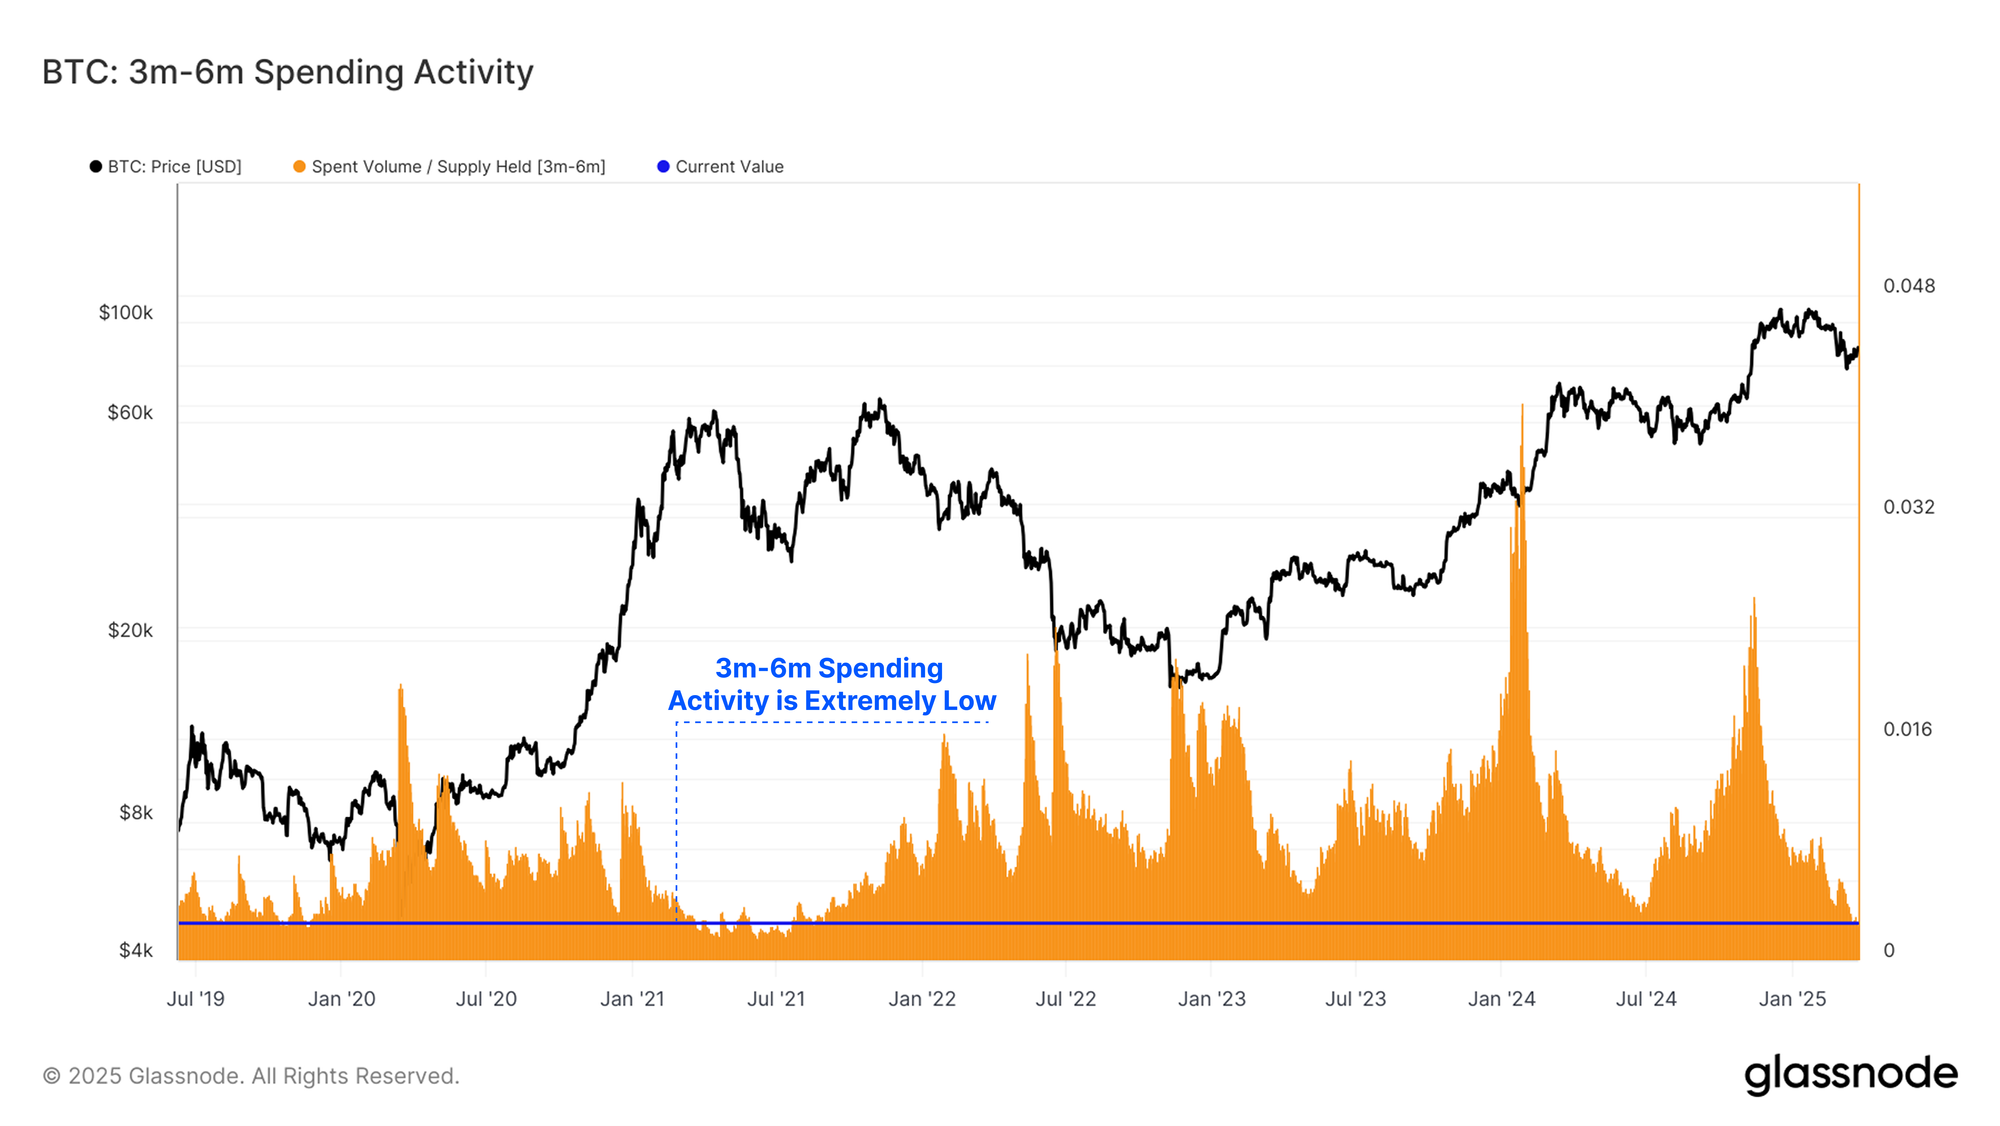
Additionally, when we normalize the volume which is spent by this cohort, we can see that their spending activity is the most subdued in has been since the May 2021 downturn.
This confirms a dominance of inactivity amongst these investors, suggesting that the incentive to HODL remains quite strong, and many are undeterred by their paper losses and the volatile market conditions.
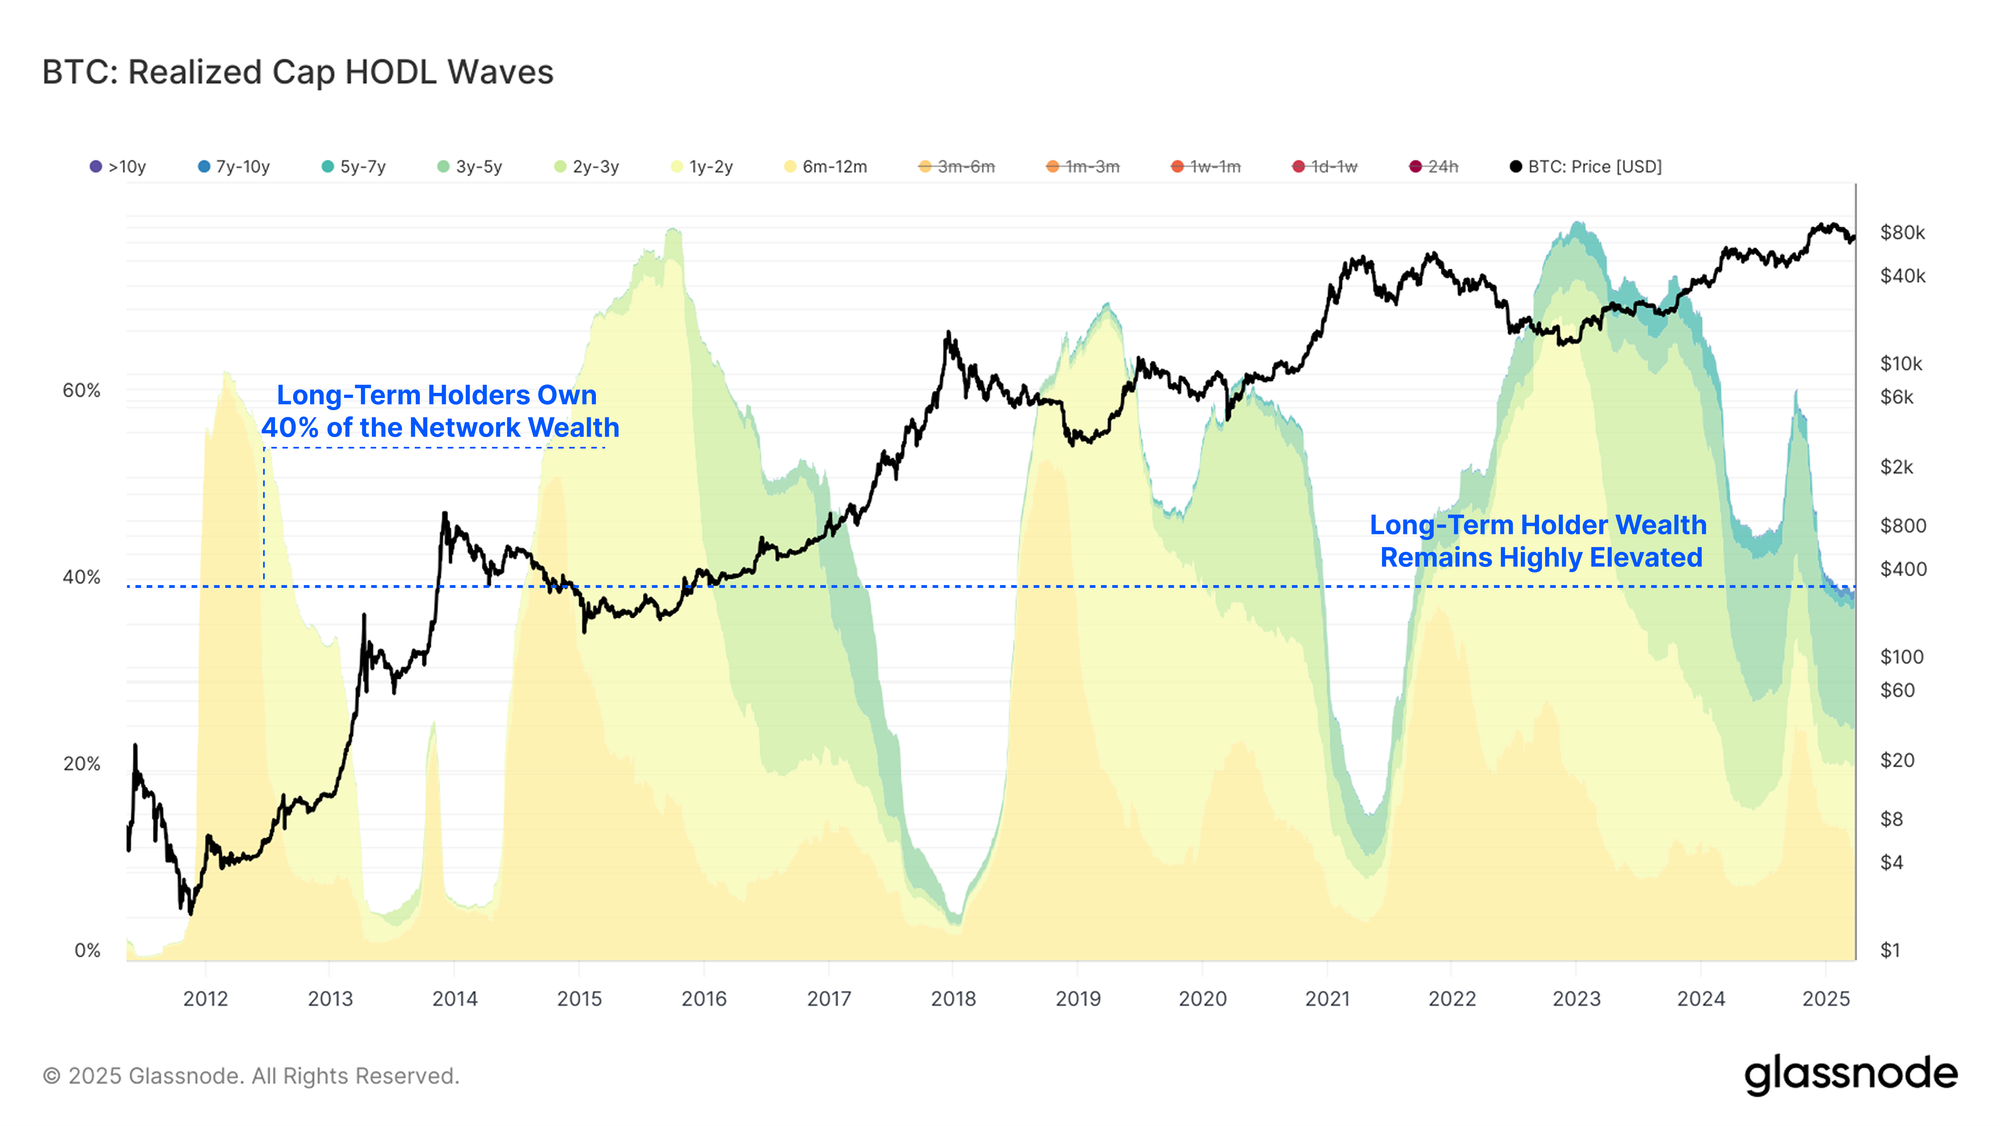
The flip side of these observations is that the Long-Term Holder cohort still retains a substantial portion of the network wealth, holding almost 40% of invested value.
These periods of HODLing and accumulation can create a gradual constriction of the supply-side, which over time, can create the conditions for a new wave of demand to establish the next uptrend.
Summary and Conclusions
With the Bitcoin market trading within a new range between $78k and $88k. On-chain profit and loss taking events are declining in magnitude, highlighting a weaker demand profile, but also less sell-side pressure.
Short-Term Holders are currently experiencing a fairly significant degree of financial stress, with a large proportion of their holdings now underwater relative to the original cost basis. Whilst the STH cohort are dominating losses taken, the Long-Term Holder cohort are transitioning back into a period of accumulation, and we expect their aggregate supply to grow in the coming weeks and months as a result.
Disclaimer: This report does not provide any investment advice. All data is provided for information and educational purposes only. No investment decision shall be based on the information provided here and you are solely responsible for your own investment decisions.
Exchange balances presented are derived from Glassnode’s comprehensive database of address labels, which are amassed through both officially published exchange information and proprietary clustering algorithms. While we strive to ensure the utmost accuracy in representing exchange balances, it is important to note that these figures might not always encapsulate the entirety of an exchange’s reserves, particularly when exchanges refrain from disclosing their official addresses. We urge users to exercise caution and discretion when utilizing these metrics. Glassnode shall not be held responsible for any discrepancies or potential inaccuracies. Please read our Transparency Notice when using exchange data.
- Join our Telegram channel.
- For on-chain metrics, dashboards, and alerts, visit Glassnode Studio.