Longer-term Bitcoin holder losses hit two year lows

Cointelegraph2022-06-07 tarihinde yayınlandı2022-06-07 tarihinde güncellendi

Özet

Bitcoin’s long-term holders are beginning to suffer losses matching those from previous bear markets, and Glassnode believes the pain may continue, and even get worse.

Long-term Bitcoin holders are sitting on their largest losses since the March 2020 capitulation and the 2018-2019 bear market but may have to keep waiting for relief.

Calculated by measuring the value of coins deposited to exchanges, aggregated realized losses from long-term holders (LTH) of Bitcoin (BTC) exceeded 0.006% of the market capitalization by May 29 according to Glassnode’s The Week Onchain report from June 6.

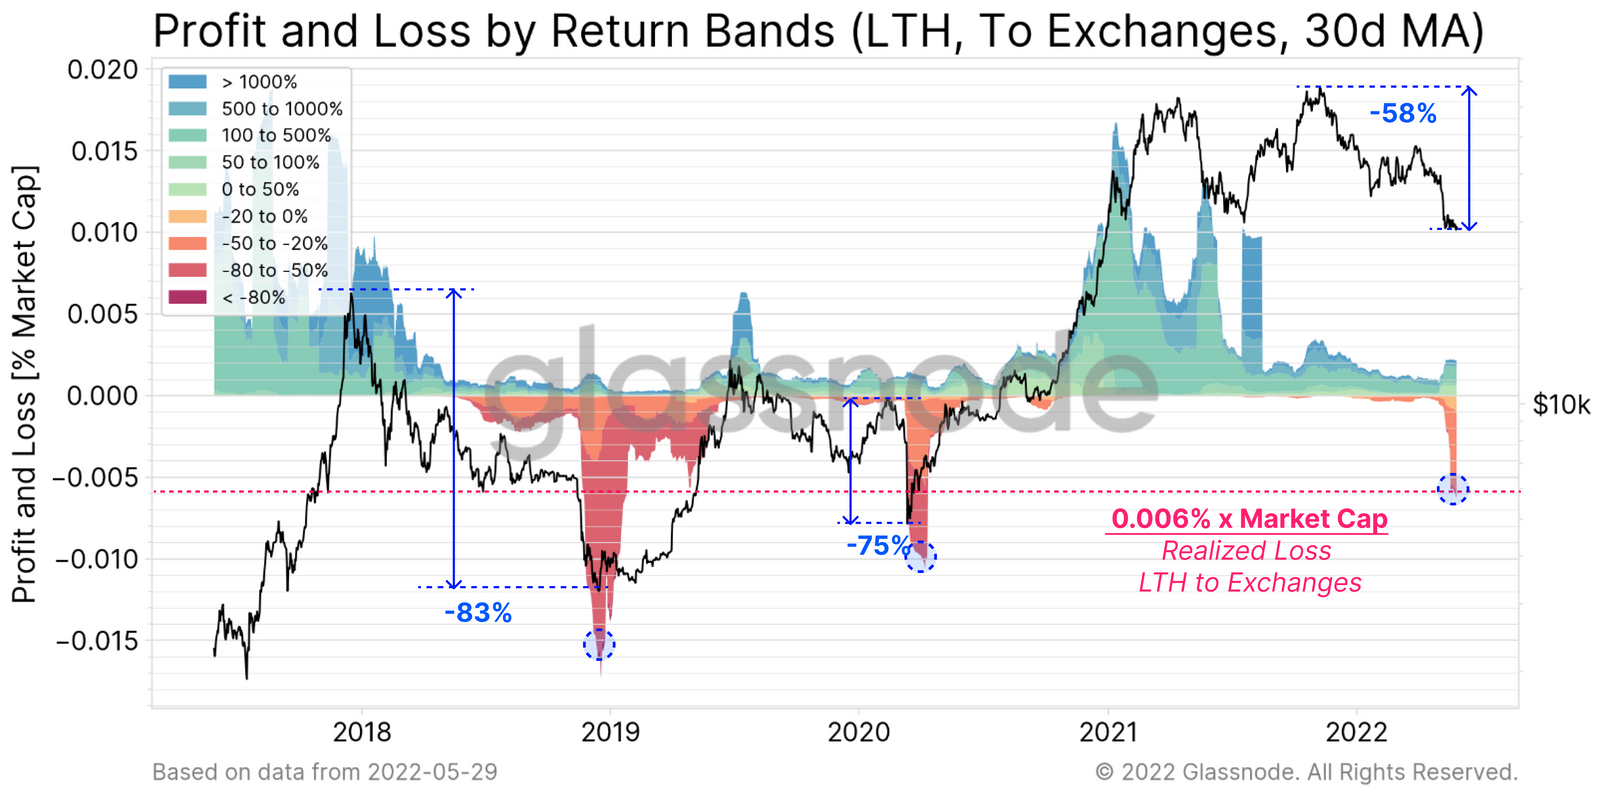
Long-term holders are suffering their worst losses since March 2020.

However, the dramatic losses may continue for some time if historic loss patterns from previous bear markets are to be repeated. From 2018 to 2019, LTH losses reached a peak of 0.015% of the market cap, and those losses extended for about a year. The current losses to long-termers have only been observed for about a month.

Glassnode writes that LTH losses now resemble those from previous bear markets, but that they need to continue for a longer period of time before being truly comparable. The report states:

“The LTH losses on coins deposited to exchanges have now reached a magnitude comparable to previous bear markets. However, we do not yet have the duration component.”

Glassnode defines LTH as a holder that has not moved their coins for at least 155 days. However, anyone that bought BTC before December 2019 will still be up on their investment … for now.

It is also worth noting that in both 2019 and 2020, prices rapidly recovered by bouncing off their lows. Cointelegraph reported on Tuesday that there will likely be a capitulation event before any significant price recovery can take place.

Despite the gloomy price outlook, inflows to digital asset investment products such as Bitcoin exchange-traded funds (ETF) topped $100 million last week. CoinShares June 6 report highlights that most of the inflows were from the Americas, suggesting that European investors are still bearish at the moment.

CoinShares also pointed out the difference in exchange flows between BTC and Ethereum (ETH). BTC exchange inflows have netted about $506 million in value through 2022 so far, whereas ETH has had net outflows of $357 million. This suggests that market sentiment for ETH is much lower than that for BTC at the moment.

Bitcoin prices are down 5.3% over the past 24 hours, trading at $29,567 according to data from CoinGecko. Ethereum is down 6.7% over the same period, trading at $1,756 having lost 34% over the past month.

İlgili Okumalar

Bitcoin Trading Strategy Breakdown: Celebrity Predictions and Classic Models All Fail, Only These Four Indicators Remain

Analysis of Bitcoin Trading Strategies: Why Celebrity Forecasts and Classic Models Fail, Leaving Only These Four Reliable Indicators This analysis examines the failure of common Bitcoin prediction methods and identifies four reliable indicators for constructing a trading strategy. The author reviewed all major BTC prediction approaches from 2017-2025, categorizing them into three groups: celebrity price targets (consistently over-optimistic), analytical models like Stock-to-Flow (broken post-2022), and on-chain signals. The key finding is that more data often creates confusion, not clarity. The strategy discards unreliable elements: celebrity predictions (incentivized to be extreme), pure models (invalidated by post-ETF market changes), and the Fear & Greed Index used alone (too many false signals). Four reliable indicators were selected: 1. **MVRV Z-Score:** Accurately identifies cycle bottoms when entering its green zone (e.g., 2018, 2020, 2022). Note: Its ability to call tops is now ineffective post-2024. 2. **SOPR (28-day MA):** Consistently signals bottoms when below 1.0, indicating holders are selling at a loss. 3. **ETF Net Flow:** A crucial post-2024 metric showing institutional momentum (e.g., sustained inflows = buying). 4. **Macro Liquidity (Fed policy & M2):** Sets the overall directional bias (e.g., bullish during easing cycles). The core strategy involves waiting for a multi-signal共振 (resonance). For example, a bottom signal requires MVRV in the green zone + SOPR < 1.0. A top signal requires overheated on-chain data + sustained ETF outflows. Macro policy sets the overall direction. The Fear & Greed Index is only used as a weighted confirmatory signal, never alone. Action is only taken when three or more indicators align. The author automated this into a monitoring system that sends Telegram alerts only when signals trigger. As of the article's date (April 15, 2026), the system showed a strong bottom signal: extreme fear (F&G=12), MVRV in the buy zone, and SOPR < 1.0. The only contrary signal was weak ETF flows. Historically, such triple on-chain共振 has preceded 100%+ returns. The conclusion emphasizes building a personal framework over relying on external predictions, allowing for iterative improvement and customization based on individual risk tolerance.

marsbit14 dk önce

Bitcoin Trading Strategy Breakdown: Celebrity Predictions and Classic Models All Fail, Only These Four Indicators Remain

marsbit14 dk önce

İşlemler

Spot
Futures
活动图片