The Graph Price Prediction – GRT Price Estimated to Reach $0.346440 By May 02, 2024 | CoinCodex

cryptodaily2024-04-23 tarihinde yayınlandı2024-04-27 tarihinde güncellendi

Table of Contents

Disclaimer: This is not investment advice. The information provided is for general purposes only. No information, materials, services and other content provided on this page constitute a solicitation, recommendation, endorsement, or any financial, investment, or other advice. Seek independent professional consultation in the form of legal, financial, and fiscal advice before making any investment decision.

  • The Graph is up 4.33% today against the US Dollar
  • GRT/BTC increased by 5.16% today
  • The Graph is currently trading 21.81% below our prediction on May 02, 2024
  • The Graph dropped -35.30% in the last month and is up 99.81% since 1 year ago
The Graph price$ 0.270868
The Graph prediction $ 0.346440 (30.61%)
Sentiment Neutral
Fear & Greed index 67 (Greed)
Key support levels$ 0.253624, $ 0.247864, $ 0.239353
Key resistance levels$ 0.267895, $ 0.276406, $ 0.282166

GRT price is expected to rise by 30.61% in the next 5 days according to our The Graph price prediction

The Graph price today is trading at $ 0.270868 after gaining 4.33% in the last 24 hours. The coin outperformed the cryptocurrency market, as the total crypto market cap increased by 3.38% in the same time period. GRT performed well against BTC today and recorded a 5.16% gain against the world’s largest cryptocurrency.

According to our The Graph price prediction, GRT is expected to reach a price of $ 0.346440 by May 02, 2024. This would represent a 30.61% price increase for GRT in the next 5 days.

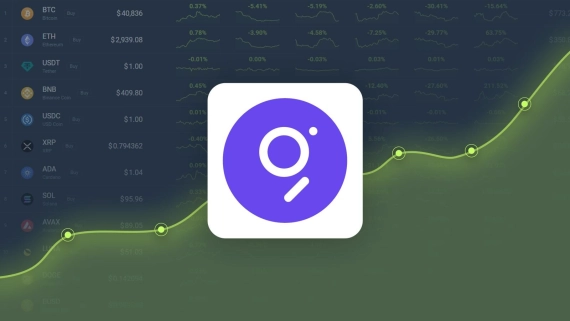
GRT Price Prediction Chart

Buy/Sell The Graph

What has been going on with The Graph in the last 30 days

The Graph has been displaying a negative trend recently, as the coin lost -35.30% in the last 30-days. The medium-term trend for The Graph has been bullish, with GRT increasing by 69.68% in the last 3 months. The long-term picture for The Graph has been positive, as GRT is currently displaying a 99.81% 1-year price change. On this day last year, GRT was trading at $ 0.135562.

The Graph reached its all-time high price on Feb 12, 2021, when the price of GRT peaked at $ 2.87. The current GRT cycle high is $ 0.491682, while the cycle low is at $ 0.051894. GRT has been displaying high volatility recently – the 1-month volatility of the coin is at 16.29. The Graph recorded 13 green days in the last 30 days.

The Graph technical analysis for today - Apr 27, 2024

The sentiment in the The Graph markets is currently Neutral, and the Fear & Greed index is reading Greed. The most important support levels to watch are $ 0.253624, $ 0.247864 and $ 0.239353, while $ 0.267895, $ 0.276406 and $ 0.282166 are the key resistance levels.

Neutral sentiment for The Graph

14 indicators are currently signaling a bullish prediction for The Graph, while 14 indicators are showing a bearish forecast. With 50% of indicators favoring a positive prediction. This results in an overall Neutral sentiment for The Graph.

Crypto market is currently experiencing Greed

Currently, the Fear & Greed index is at 67 (Greed), which signals that investors have a positive outlook on the market. The Fear & Greed index is a measure of sentiment among cryptocurrency investors. A “Greed” reading suggests that investors are currently optimistic about the cryptocurrency market, but can also be an indication that the market is overvalued. A “Fear” reading, on the other hand, signals that investors are currently hesitant about the cryptocurrency market, which potentially represents a buying opportunity.

The Graph moving averages & oscillators

Let’s take a look at what some of the most important technical indicators are signaling. We’ll be going through key moving averages and oscillators that will allow us to get a better idea of how The Graph is positioned in the market right now.

PeriodDaily SimpleDaily ExponentialWeekly SimpleWeekly Exponential
MA3$ 0.266763 (BUY)$ 0.264091 (BUY)--
MA5$ 0.273162 (SELL)$ 0.266071 (BUY)--
MA10$ 0.291685 (SELL)$ 0.281533 (SELL)--
MA21$ 0.298799 (SELL)$ 0.309584 (SELL)-$ 0.97 (BUY)$ 0.254462 (BUY)
MA50$ 0.347334 (SELL)$ 0.318395 (SELL)-$ 0.82 (BUY)$ 0.194570 (BUY)
MA100$ 0.277423 (SELL)$ 0.284205 (SELL)-$ 0.50 (BUY)$ 0.131534 (BUY)
MA200$ 0.206847 (BUY)$ 0.231708 (BUY)--

PeriodValueAction
RSI (14)40.43NEUTRAL
Stoch RSI (14)97.10SELL
Stochastic Fast (14)56.10NEUTRAL
Commodity Channel Index (20)-66.67NEUTRAL
Average Directional Index (14)25.99SELL
Awesome Oscillator (5, 34)-0.04NEUTRAL
Momentum (10)0.01NEUTRAL
MACD (12, 26)0.00NEUTRAL
Williams Percent Range (14)-43.90NEUTRAL
Ultimate Oscillator (7, 14, 28)52.02NEUTRAL
VWMA (10)0.27SELL
Hull Moving Average (9)0.30SELL
Ichimoku Cloud B/L (9, 26, 52, 26)0.30NEUTRAL

The Relative Strength Index (RSI 14) is a widely used indicator that helps inform investors whether an asset is currently overbought or oversold. The RSI 14 for The Graph is at 40.43, suggesting that GRT is currently neutral.

The 50-day Simple Moving Average (SMA 50) takes into account the closing price of The Graph over the last 50 days. Currently, The Graph is trading above the SMA 50 trendline, which is a bullish signal.

Meanwhile, the 200-day Simple Moving Average (SMA 200) is a long-term trendline that’s calculated by taking an average of the GRT closing price for the last 200 days. GRT is now trading below the SMA 200, signaling that the market is currently bearish.

The bottom line about this The Graph prediction

After considering the above factors, we can conclude that the current forecast for The Graph price prediction is Neutral. GRT would have to increase by 30.61% to hit our $ 0.346440 target within the next five days. Moving forward, it will be important to monitor the GRT market sentiment, the key support and resistance levels, and other metrics. However, we have to keep in mind that the cryptocurrency markets are unpredictable, and even the largest crypto assets display a lot of price volatility. For long-term The Graph price predictions click here.

Disclaimer: This is not investment advice. The information provided is for general purposes only. No information, materials, services and other content provided on this page constitute a solicitation, recommendation, endorsement, or any financial, investment, or other advice. Seek independent professional consultation in the form of legal, financial, and fiscal advice before making any investment decision.

Disclaimer: This article is provided for informational purposes only. It is not offered or intended to be used as legal, tax, investment, financial, or other advice.

Read on CoinCodex Investment Disclaimer
İlgili Okumalar

The Richest Fed Chair in 112 Years Is Here: Kevin Warsh Is Rewriting the Rules

Kevin Warsh, with a personal fortune exceeding $130 million, became the 112nd and wealthiest Chair of the U.S. Federal Reserve on May 22nd. A former Wall Street investment banker and key figure during the 2008 financial crisis, Warsh lacks a traditional academic background for a central banker but brings deep market experience. He proposes an unconventional policy approach of simultaneously reducing the Fed's balance sheet ("quantitative tightening") while cutting interest rates, arguing that a smaller balance sheet would allow for more effective rate policy. His ascent marks a potential regime change at the Fed. Warsh aims to reform the institution's decision-making processes, tighten communication discipline among officials, and reduce reliance on forward guidance like the "dot plot." This shift responds to the Fed's current dilemma: fiscal policy is expanding the government's balance sheet through deficits, while monetary policy's ability to shrink its own $6.7 trillion balance sheet is severely constrained, creating pressure on long-term interest rates. Analysts expect Warsh's tenure to sustain high volatility in the U.S. Treasury market due to persistent supply pressures. Furthermore, his leadership coincides with a gradual, structural erosion of dollar dominance, evidenced by its declining share in global reserves and cracks in the petrodollar system, with increased use of alternatives like the Chinese yuan in oil trade. For investors, this environment underscores the importance of portfolio diversification, including assets like gold and Chinese sovereign bonds, amid a fluctuating dollar credit anchor.

链捕手4 dk önce

The Richest Fed Chair in 112 Years Is Here: Kevin Warsh Is Rewriting the Rules

链捕手4 dk önce

τ Scaling: Huawei's New Growth Engine Designed for the Post-Moore Era

**Tau Scaling: Huawei's New Growth Engine for the Post-Moore Era** For 60 years, progress in semiconductors was driven by Moore's Law – making transistors smaller, denser, and cheaper. This path has now stalled due to plummeting returns below 7nm, astronomical lithography costs, and rising per-transistor expenses. After six years and testing 381 production chips, Huawei’s semiconductor team proposes a fundamental shift: **stop competing on size, start competing on time**. This is the core of their "τ (Tau) Scaling" theory. It treats *time* as the key optimization metric, compressing characteristic delays (τ) across all levels – from transistor switching (picoseconds) to data center tasks (seconds), spanning 12 orders of magnitude. **What is τ Scaling?** It holistically minimizes delay/time constants (τ) across four layers: transistors (switching speed), circuits (signal delay), chips (compute/memory access), and systems (end-to-end communication). The goal is to align optimization from process and circuit design to architecture and systems using this unified metric. **Mobile Application: LogicFolding** Without advancing the process node, this technique vertically stacks chips using ultra-precision hybrid bonding, distributing critical paths across layers ("stacking floors"). Results include a 55% transistor density increase, 41% better energy efficiency, over 40% higher SRAM frequency, and a roadmap targeting 4GHz by 2029. **AI Data Center Application: Full-Link Latency Compression** With 80% of AI cluster energy and 70% cost spent on data movement, the focus is slashing communication time. Key innovations include: 1. **Unified Bus:** Cuts multi-layer protocols, reducing remote access latency from microseconds to ~100 nanoseconds – 500x faster. 2. **Hi-ONE Optical Interconnect:** Replaces copper with fiber, enabling 8Tb/s per module and scaling distances from 1m to 100m for 10,000-chip clusters. 3. **3D Folding:** Solves the "interface bottleneck" of 2.5D packaging by vertically integrating memory, power, and optical I/O alongside compute, predicting over 100x integration density gain by 2035. **Re-fusion of Logic and Memory** The AI era, where data movement is more critical than computation, demands tight 3D integration of logic and memory, shifting industry influence towards memory and advanced packaging. **Remaining Challenges** include adapting EDA tools for 3D design, optimizing wafer-to-wafer process variation and vertical interconnect losses, and establishing new energy efficiency and benchmarking standards. **Conclusion:** The era of scaling physical dimensions is over. The era of scaling time has begun. By leveraging 3D stacking, system architecture, and interconnect optimization—rather than solely chasing advanced lithography—performance and efficiency can continue to advance. This is poised to be the semiconductor industry's core roadmap for the next decade.

marsbit42 dk önce

τ Scaling: Huawei's New Growth Engine Designed for the Post-Moore Era

marsbit42 dk önce

NodeStrategy: The First Ordinals DAT Project, Bringing the Strategy Treasury Narrative to NFTs

**Summary: The Fundamental Flaws of NodeStrategy, the 'First Ordinals DAT'** NodeStrategy presents itself as the first Ordinals Digital Asset Treasury (DAT) on Bitcoin. Its model mirrors MicroStrategy's treasury narrative but for NFTs, specifically targeting the NodeMonkes collection (not officially affiliated). The project's core mechanism is a four-step flywheel: a 10% fee on all trades (90% to treasury, 10% to radFi/Bound marketplace) is used to buy NodeMonkes. These NFTs are then listed for sale on Satflow, with 100% of the sale proceeds used to buy back and burn the project's token, NODESTRAT, aiming to create a perpetual value cycle. However, the design contains critical, self-defeating flaws: 1. **Platform Lock-In:** As a Bitcoin Rune, NODESTRAT lacks smart contract functionality and cannot natively enforce the 10% fee. The fee can only be collected on the radFi/Bound marketplace itself. This makes the entire flywheel dependent on a single platform. If liquidity moves elsewhere, fee revenue drops to zero, halting the mechanism. 2. **Self-Suffocating Economics:** The 10% fee acts both as the flywheel's fuel and a major drag on demand. A buy/sell roundtrip incurs a 20% cost, creating a massive hurdle for traders. This strangles the very trading volume needed to generate fees. 3. **Ineffective Value Support:** The flywheel is starved. Low daily volume (~$9K) generates minimal fees for NFT purchases. The NFT "ladder" sales are slow and unpredictable (only 39 total sold), meaning buybacks are infrequent. While 30.77% of the supply has been burned, this supply reduction cannot lift price without corresponding demand, which is suppressed by the high transaction tax. 4. **Meaningless NAV:** The Net Asset Value (NAV), currently at a 0.46x discount to market cap, is merely a marketing figure. There is no redemption mechanism for token holders to claim the underlying NodeMonkes assets. Price is set by market liquidity flows, not by this theoretical backing. In essence, NodeStrategy's design forces its revenue source (trading fees) to simultaneously cripple the demand and liquidity required for its own success, trapping the project in a stagnant state.

marsbit49 dk önce

NodeStrategy: The First Ordinals DAT Project, Bringing the Strategy Treasury Narrative to NFTs

marsbit49 dk önce

Agentic Design Patterns: A Book That Made Me Re-Understand "What Is an Agent, Really?"

"Agentic Design Patterns" is a 2025 book by Antonio Gullí, a Google engineering director, which offers a systematic framework for AI Agent development through 21 design patterns. A core contribution is the "Four Levels of Agency": Level 0 (bare LLMs) are not true agents. Level 1 agents actively decide when and how to use tools. Level 2 agents engage in strategic planning, context engineering (curating and filtering information), and self-reflection. Level 3 involves multi-agent collaboration with defined communication topologies. The book introduces **Context Engineering** as a superset of prompt engineering, managing four layers of information for the agent: system prompts, external data, implicit context (user history, environment), and feedback loops for automated optimization. A key pattern is **Reflection (Producer-Critic)**, where two distinct agents with different prompts collaborate iteratively—one produces output, the other critiques it—until quality is satisfactory or a max iteration limit is reached. For **Memory**, a three-layer model is proposed: Session (ephemeral conversation context), State (temporary task data), and Memory (persistent, long-term storage). Regarding **Multi-Agent Systems**, the book advises against unnecessary complexity, recommending simple topologies like Supervisor or Peer-to-Peer based on task needs. It emphasizes perfecting a single Level 2 agent before moving to multi-agent setups. The author concludes with three actionable takeaways: 1) Add a Critic agent to existing workflows, 2) Practice Context Engineering beyond simple prompts, and 3) Avoid premature multi-agent complexity; first master a robust single agent. The book provides a practical map, codifying common challenges like reflection, memory, and coordination into reusable patterns, saving developers from reinventing foundational solutions.

链捕手1 saat önce

Agentic Design Patterns: A Book That Made Me Re-Understand "What Is an Agent, Really?"

链捕手1 saat önce

İşlemler

Spot
Futures

Popüler Makaleler

GRT Nasıl Satın Alınır

HTX.com’a hoş geldiniz! The Graph (GRT) satın alma işlemlerini basit ve kullanışlı bir hâle getirdik. Adım adım açıkladığımız rehberimizi takip ederek kripto yolculuğunuza başlayın. 1. Adım: HTX Hesabınızı OluşturunHTX'te ücretsiz bir hesap açmak için e-posta adresinizi veya telefon numaranızı kullanın. Sorunsuzca kaydolun ve tüm özelliklerin kilidini açın. Hesabımı Aç2. Adım: Kripto Satın Al Bölümüne Gidin ve Ödeme Yönteminizi SeçinKredi/Banka Kartı: Visa veya Mastercard'ınızı kullanarak anında The Graph (GRT) satın alın.Bakiye: Sorunsuz bir şekilde işlem yapmak için HTX hesap bakiyenizdeki fonları kullanın.Üçüncü Taraflar: Kullanımı kolaylaştırmak için Google Pay ve Apple Pay gibi popüler ödeme yöntemlerini ekledik.P2P: HTX'teki diğer kullanıcılarla doğrudan işlem yapın.Borsa Dışı (OTC): Yatırımcılar için kişiye özel hizmetler ve rekabetçi döviz kurları sunuyoruz.3. Adım: The Graph (GRT) Varlıklarınızı SaklayınThe Graph (GRT) satın aldıktan sonra HTX hesabınızda saklayın. Alternatif olarak, blok zinciri transferi yoluyla başka bir yere gönderebilir veya diğer kripto para birimlerini takas etmek için kullanabilirsiniz.4. Adım: The Graph (GRT) Varlıklarınızla İşlem YapınHTX'in spot piyasasında The Graph (GRT) ile kolayca işlemler yapın.Hesabınıza erişin, işlem çiftinizi seçin, işlemlerinizi gerçekleştirin ve gerçek zamanlı olarak izleyin. Hem yeni başlayanlar hem de deneyimli yatırımcılar için kullanıcı dostu bir deneyim sunuyoruz.

187 Toplam GörüntülenmeYayınlanma 2024.12.10Güncellenme 2025.03.21

GRT Nasıl Satın Alınır

Tartışmalar

HTX Topluluğuna hoş geldiniz. Burada, en son platform gelişmeleri hakkında bilgi sahibi olabilir ve profesyonel piyasa görüşlerine erişebilirsiniz. Kullanıcıların GRT (GRT) fiyatı hakkındaki görüşleri aşağıda sunulmaktadır.

活动图片