1. Market trend: BTC's profit margin is close to 50%
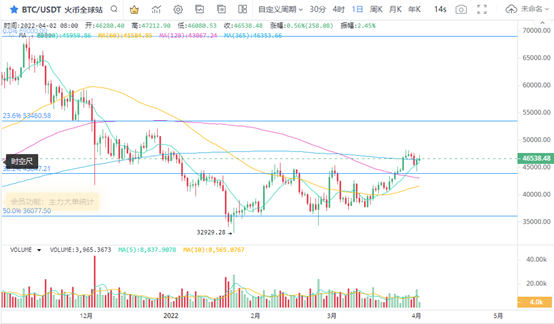
Under the background that the BTC price is about to fall below the 365 day moving average, the price bottomed out and rebounded. At the daily K-line level, BTC's short-term volume and price performance is good, and it is still beneficial to bulls after the volume rebound.
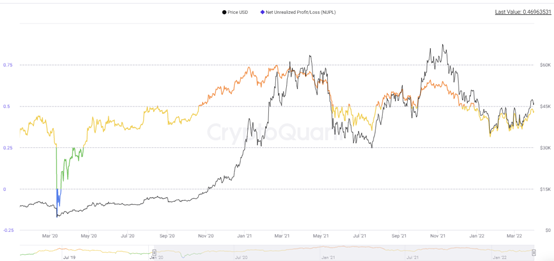
The increase in the number of profit taking is an important driving factor for the recent BTC adjustment. Judging from the changes in the proportion of unconfirmed earnings of BTC investors, the highest proportion of unconfirmed profit-making transactions reached 48.3%, which is very close to the important node of 50%. Next, the price trend also more reflects the change of selling pressure brought by profit taking. The rapid growth of profit margins is unfavorable to the maintenance of the upward trend of prices.
From the end of October 2020, BTC has more trading days with more than 50% profit taking. At present, it can be regarded as the key position for BTC to improve the number of profit taking, and the selling pressure may continue to suppress the price increase.
2. Message side interpretation:
In terms of the situation in Russia and Ukraine, on April 1, Ukraine launched a rare air raid on an oil base in western Russia. On the other hand, the confrontation between Russia, the United States and the West in the field of energy has intensified. Putin signed a presidential decree on March 31, and the new regulations on paying Russian natural gas in rubles for "unfriendly countries and regions" in Russia came into force on April 1. The situation may still push up inflation risk.
Meanwhile, the US non farm employment data after the quarterly adjustment in March showed that the non farm employment population increased by 431000 in March, and the US unemployment rate fell to 3.6% in March, continuing the new low since February 2020.
After the data were released, the probability of the Fed raising interest rates by 50 basis points in May was 75.5%. Affected by this, the price trend of BTC in the month is likely to fluctuate and sort out. With the progress of the adjustment, the negative factors brought by the interest rate increase will continue to be concerned.
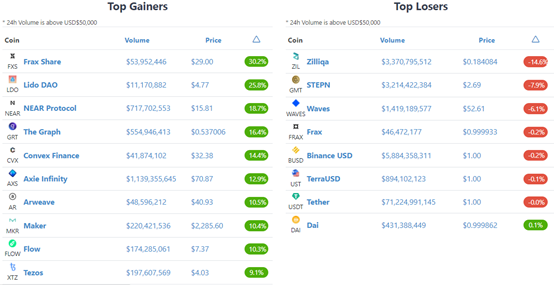
3. Dragon and tiger list:
As the mainstream currencies stabilized in the short term, most concept currencies rebounded. In terms of ranking, the algorithm stability currencies FXS and eth2 0 pledge concept currency LDO, ETH layer 2 network near and Web3 0 concept GRT.
In addition, Devi concept CVX and gamefi concept AXS also increased significantly.
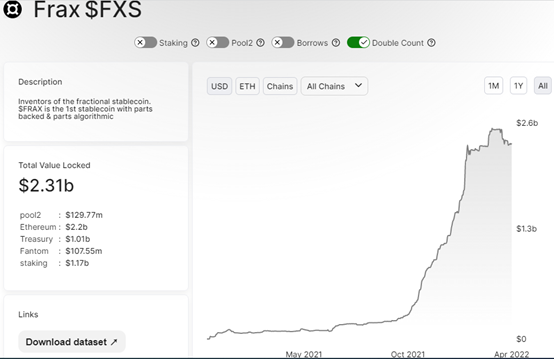
FXS
FraX aims to become "the world's first decentralized stable coin, with some of its supply tokens supported by collateral and some stabilized by algorithms."
FraX protocol implements a dual token system: stable token FraX and protocol governance token FXS.
In the fourth quarter of 2021, with the release of fraxv2, FraX was adopted on a large scale and linked with the whole defi system. As of January 25, the FraX project fund pool earned an average of $500000 per day (annualized about $180 million) through the amo (algorithmic market making program) launched by the team in the early fourth quarter of 2021. During the same period, the supply of FraX climbed from less than $500 million to a staggering $2.6 billion.
In terms of price, FXS followed the platform token Luna of Terra algorithm to stabilize the currency, rebounded and rose, rising by 30.2% in 24 hours, and the volume of the band nearly doubled. In terms of lock-in, FXS lock-in is US $2.3 billion, including US $2.2 billion on Ethereum chain.
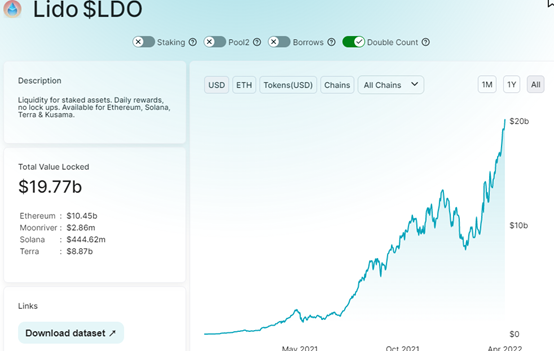
LDO
LDO with the highest growth is Ethereum 2.0 pledge liquidity solution, and its TVL has grown rapidly, with the number exceeding US $19.7 billion. Among them, the pledge scale of eth has exceeded US $10.4 billion. From the perspective of application, LDO has application prospects in Solana ecology, poca ecology, polygon ecology and Terra ecology in addition to Ethereum 2.0. As a LDO to solve the problem of pledge liquidity, its price increase is expected to be of concern.
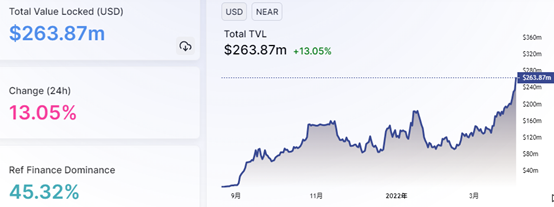
NEAR
Near is a two-tier solution for Ethereum. In January, near completed a financing of up to US $150 million, led by Sanjian capital and participated in a16z investment
In terms of lock up data, near lock up data continued to grow, with a numerical innovation of US $260 million. In terms of price, after the relative performance of near market, the price has not broken through the high closing price of $20.19 in the early stage, and there are many opportunities for future performance.
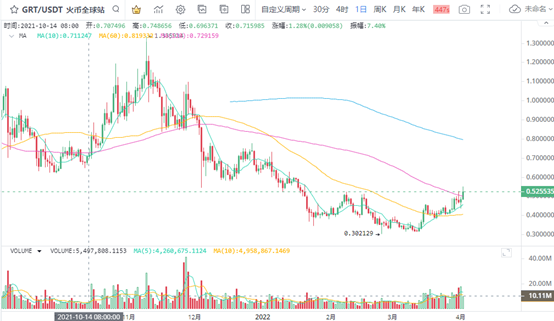
GRT
Graph is a decentralized protocol for indexing and querying blockchain data, which is applied to Ethereum. Graph makes data query simple and easy to operate. Anyone can build and publish open APIs to make data easy to access.
Graph token has two main purposes in the agreement:
Indexer pledge: the indexer pledges graph tokens so that it can be found in the query market and provide economic security during the execution of work.
In the secondary market, the current price of GRT is US $0.52, which is 82% lower than the historical maximum of 2.88 yuan in 2021. At present, the trend of GRT is stable and is in the upward trend after breaking through the 120 day moving average.
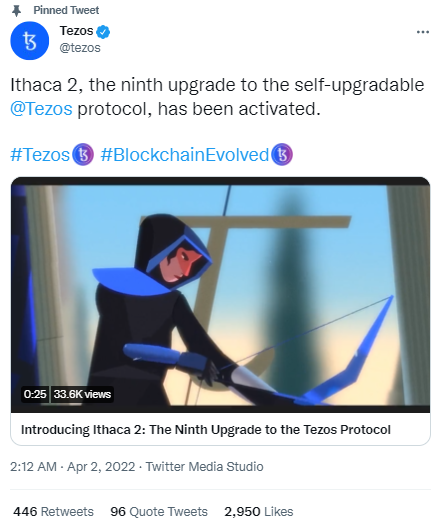
XTZ
The tezos development team nomadlabs said on twitter that it had released a new version of the tezosoctez suite V12 1. This version fixes the vulnerability that may lead to crash in ithaca2baker software. Ithaca2 was also successfully activated on tezos main network. It is reported that Ithaca is the ninth protocol upgrade proposal of tezos.
Affected by this, xtz ranked 10th in price increase within 24 hours.
In terms of the Japanese K-line, the price trend of xtz is very stable, and we pay attention to the long-term performance of the currency.
Decline list
ZIL, GMT and Waves, which have performed well in the recent market, have a large callback space. In addition, most of the currencies with the largest declines had little decline. This shows that the bulls in the overall market still have an advantage and there are more low absorption profit opportunities.