DeXe slips 13% – But here’s why the pullback may be temporary

ambcryptoPublished on 2026-07-14Last updated on 2026-07-14

Abstract

DeXe (DEXE) has recently pulled back by approximately 13% after a significant rally, gaining over 1,000% in the past six months. This dip is largely attributed to profit-taking by buyers. Analysis of the price chart indicates the sell-off may be temporary. Key demand zones are seen as potential support levels, with the first zone being the most likely to hold. Technical indicators support this view: the Accumulation/Distribution line shows slight upward divergence despite falling prices, and the RSI remains in a neutral-bullish range near 52. Furthermore, spot market data reveals a sharp decline in net selling pressure, dropping more than tenfold from its recent peak. The evidence suggests the current weakness is a slowdown within a longer-term bullish trend rather than a decisive reversal.

DeXe [DEXE] has been printing fresh highs for weeks, gaining 45% in the past seven days alone and more than 1,000% across the past 180 days, as reflected on the chart.

Over the past 24 hours, capital has begun retreating as buyers step back and lock in profit, a shift that has dragged the asset down roughly 13% within the period.

The chart structure, however, points to a possible temporary pullback, with price still positioned to extend its upside over the longer term.

DeXe doji candles expose a standoff

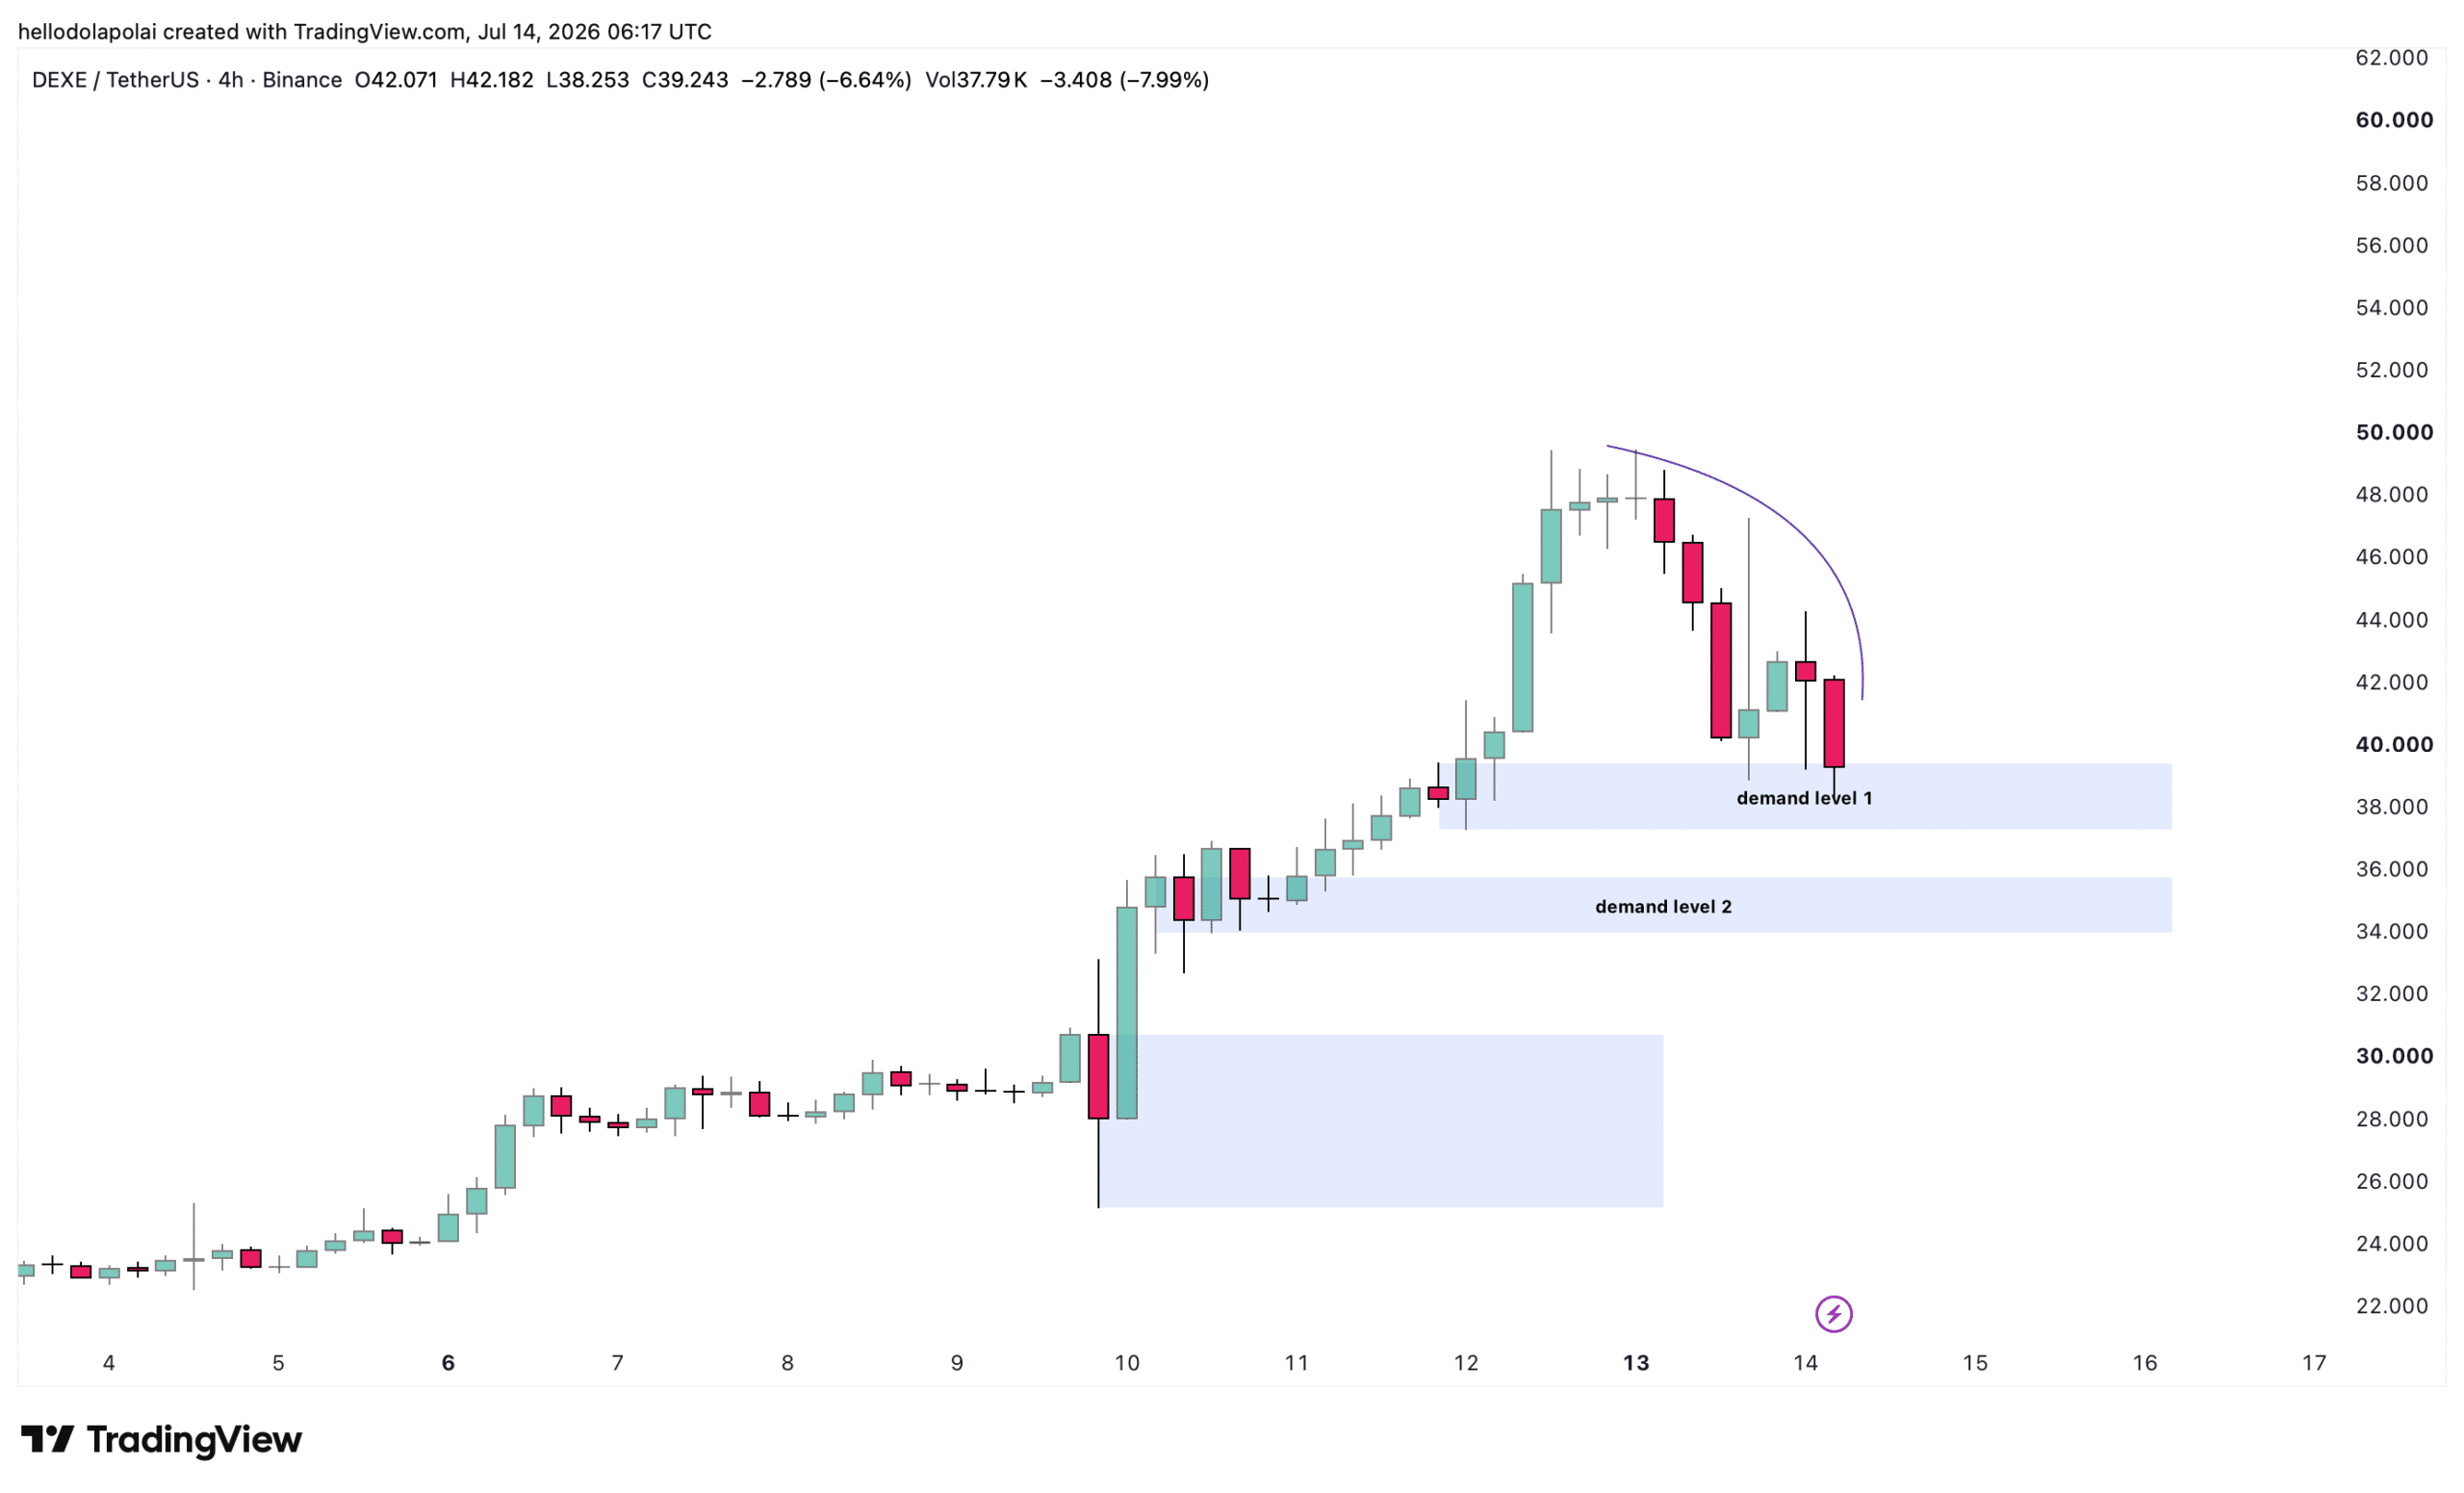
DeXe printed two telling doji candles in the early hours of the day.

The first, a gravestone doji, reflected intense sell pressure as price attempted to extend its upswing, while a dragonfly doji formed a few candles later and signaled bulls stepping back in.

Price currently sits decidedly bearish, and the near-term outcome hinges on the key demand zones mapped on the chart.
Source: TradingView

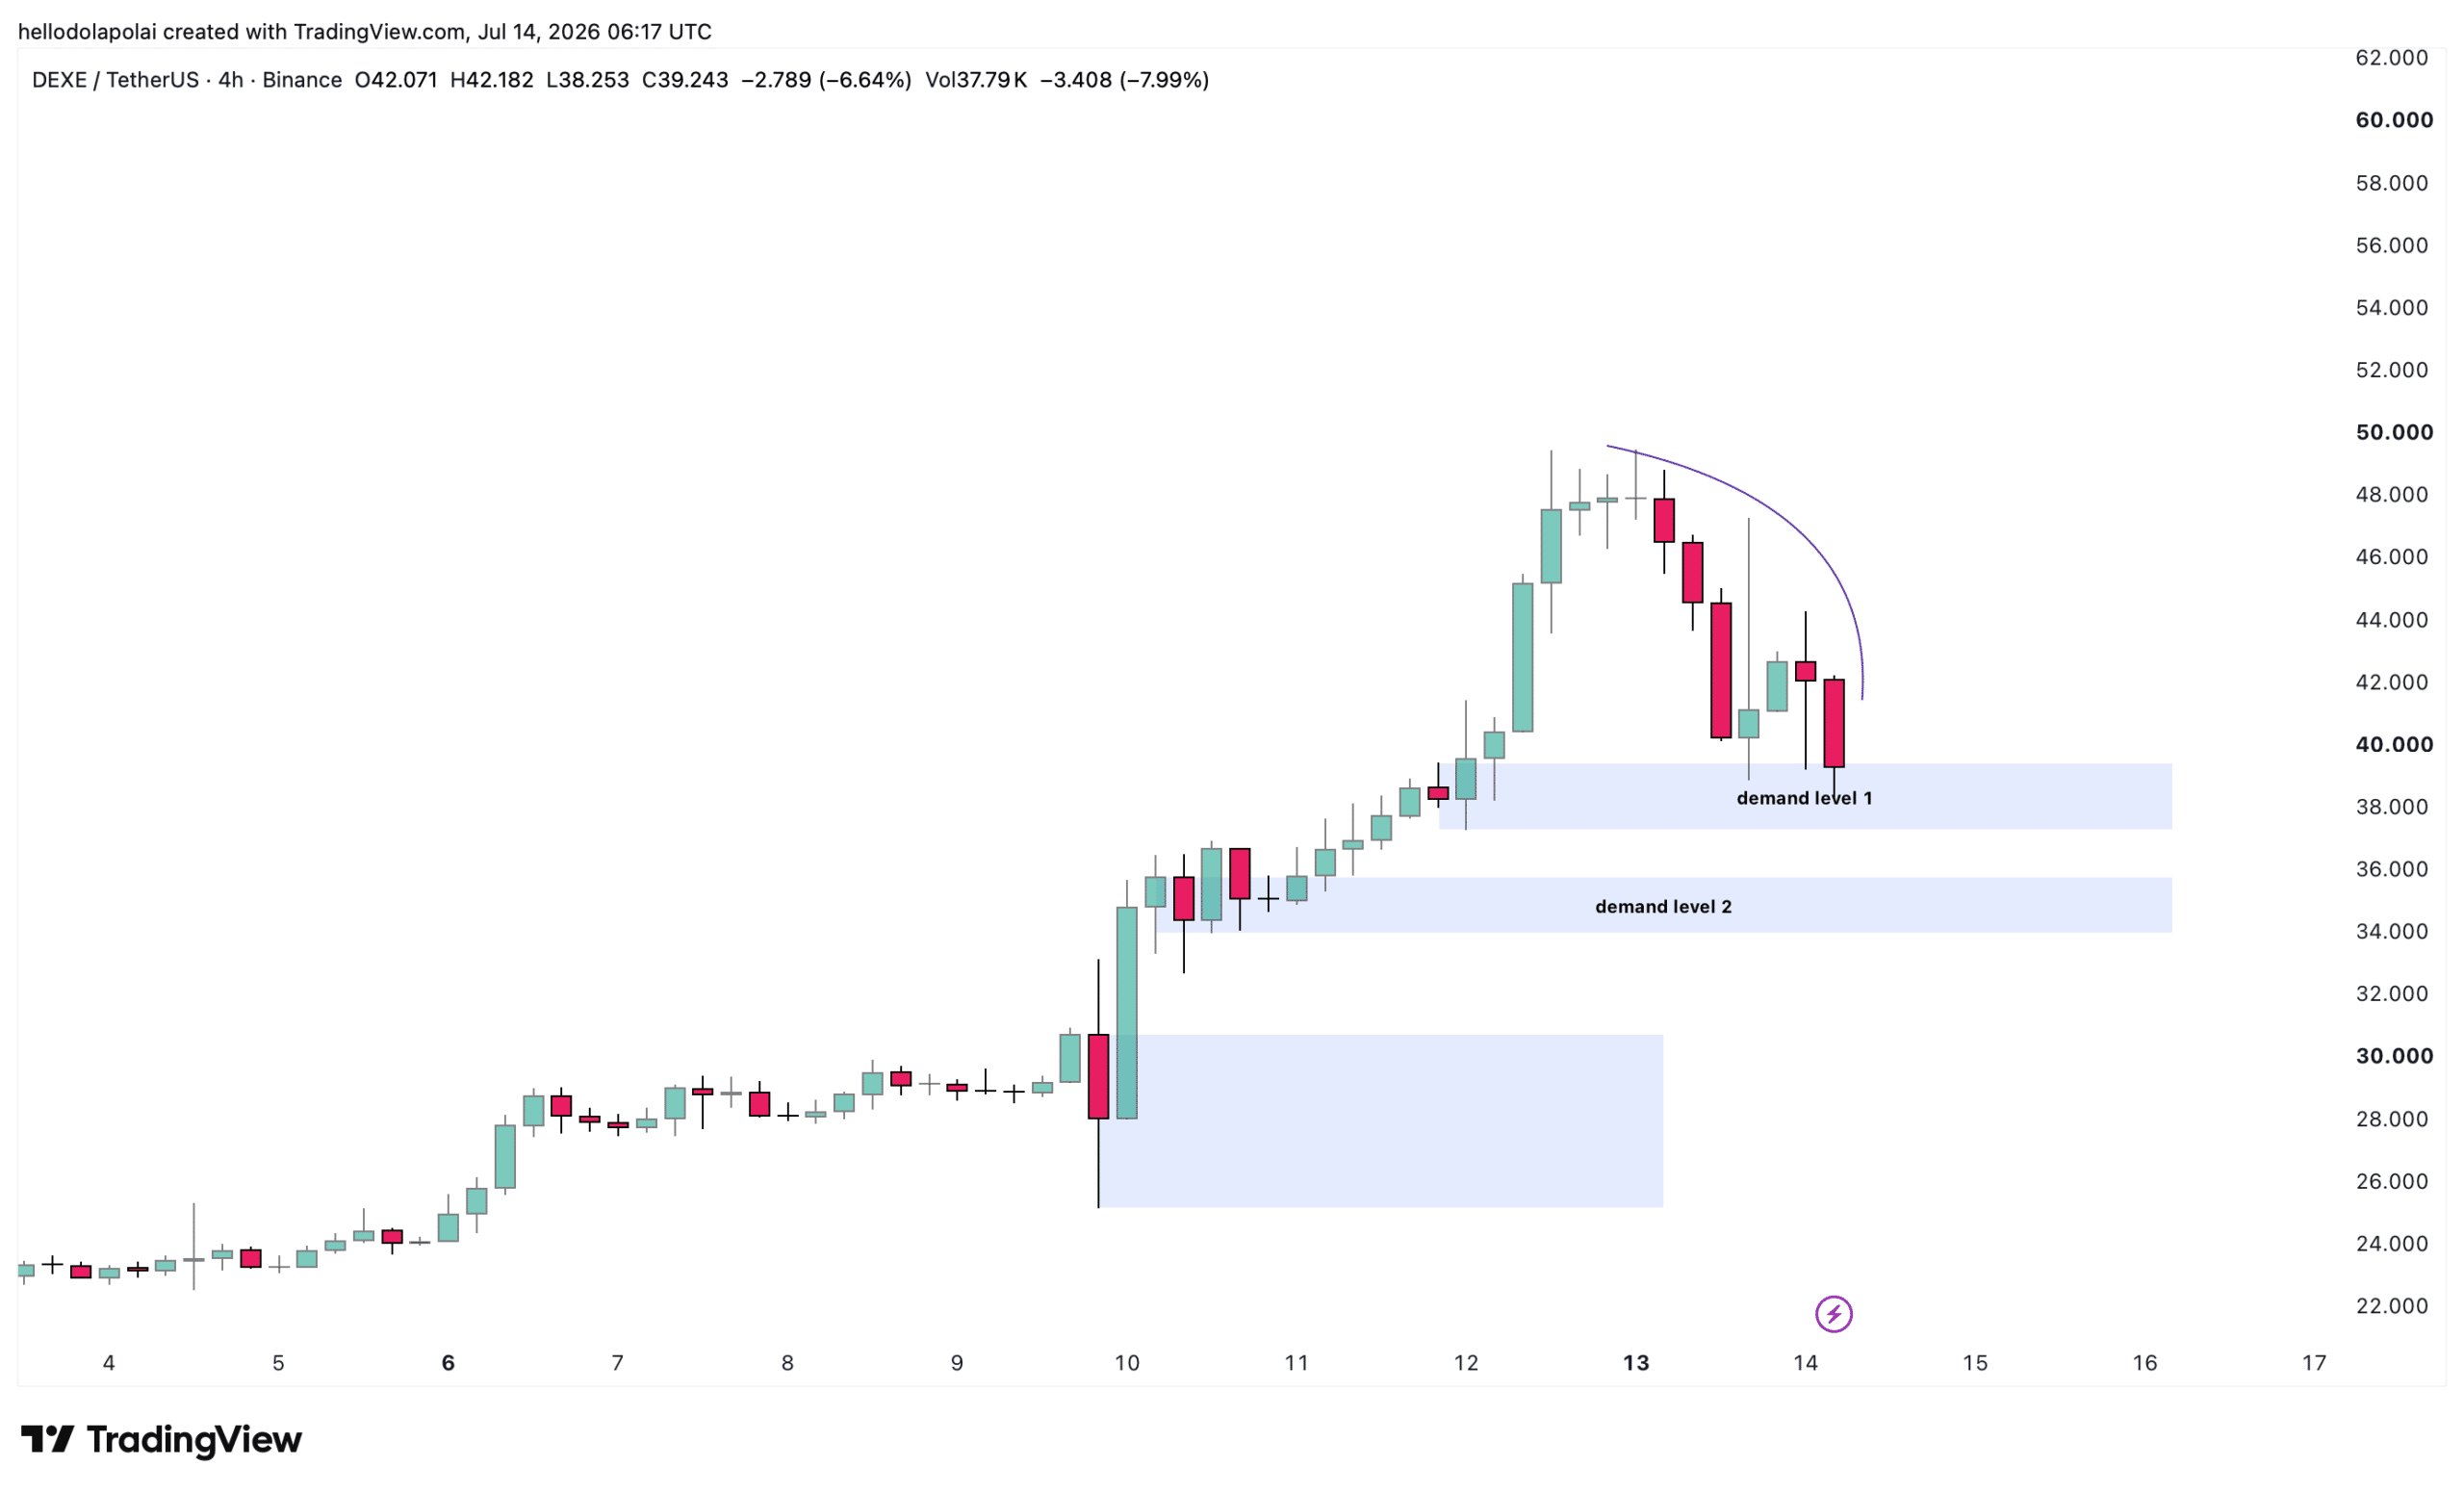
Demand zone 1 offers the first line of support, and a sufficient bounce there could send price swinging upward to clear the overhead liquidity marked by the curved line on the left.

Should selling pressure keep mounting and that level give way, demand zone 2 stands ready to cushion price and absorb the pressure that has weighed on the asset for most of the day.

Demand zone 1 holding remains the likelier scenario, and volume data supports that read, with volume down 36% over the period.

Declining volume alongside a falling price often signals that the momentum driving the move is weak, which opens room for buyers to take control.

Indicators point to a slowdown rather than a reversal

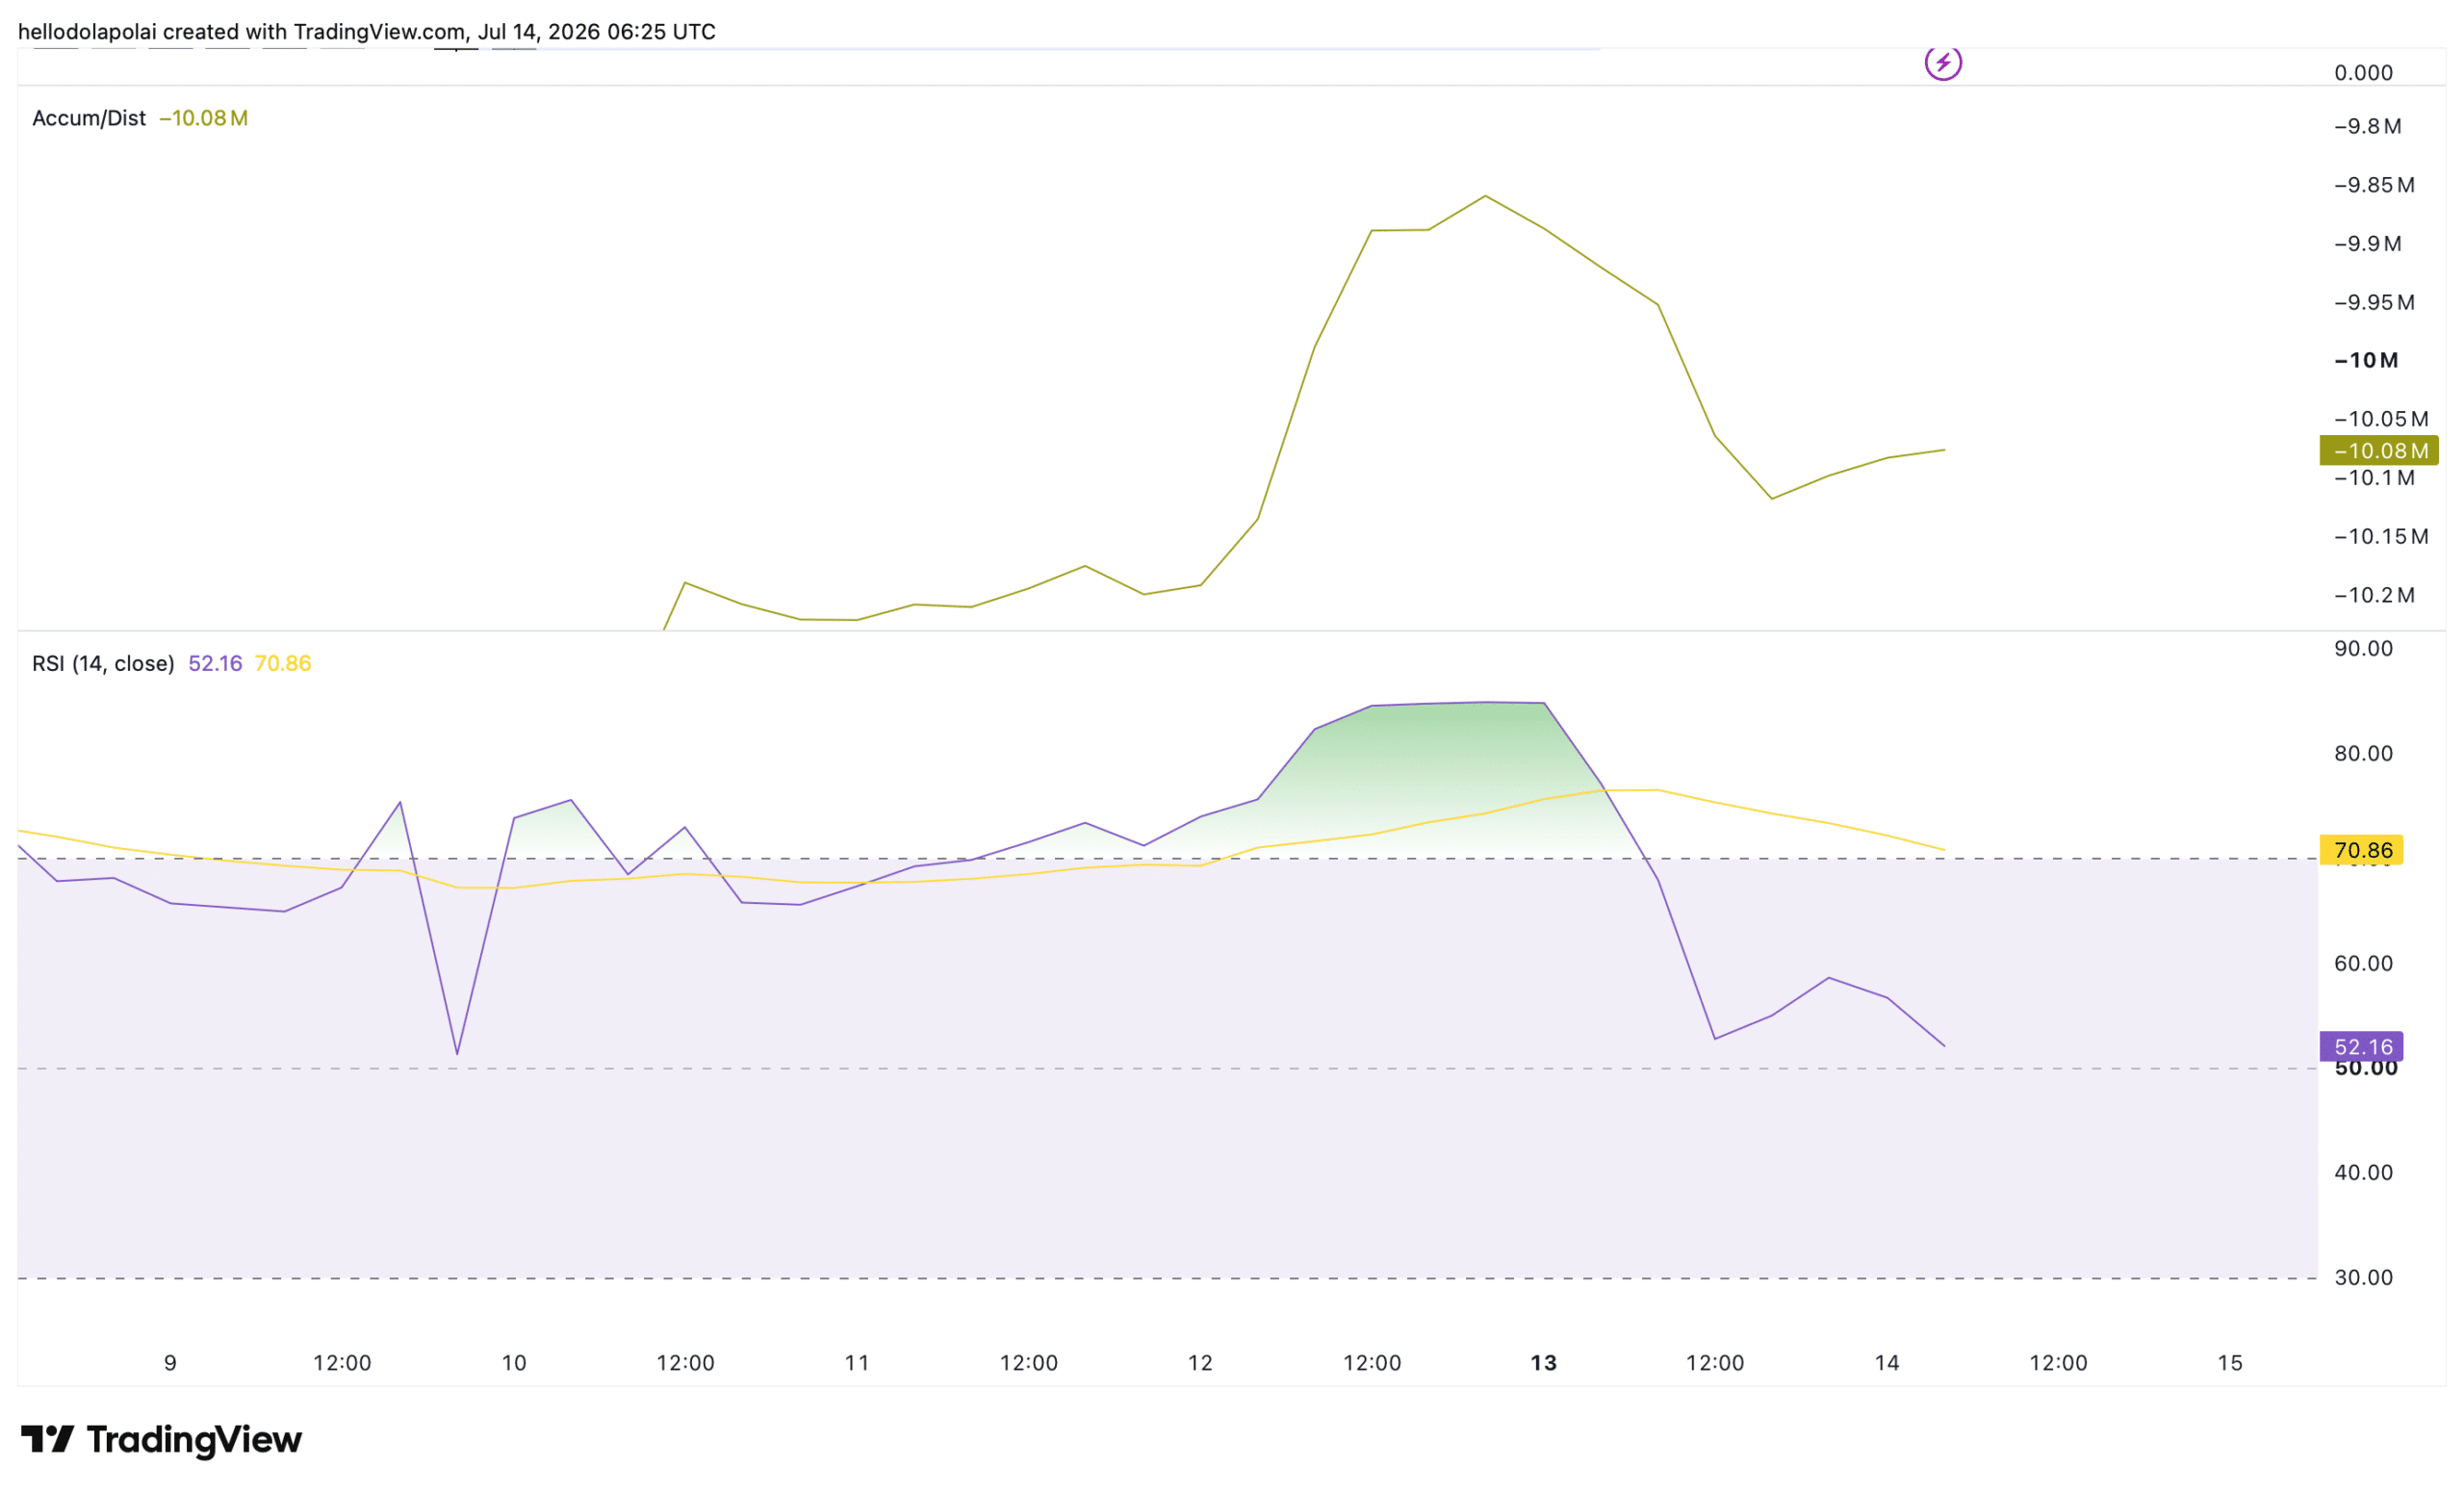
Momentum indicators aren’t fully aligned with the bearish price action, and the Accumulation/Distribution (A/D) indicator captures that tension.

The A/D line weights each period’s volume by where price closes within its range, serving as a proxy for whether an asset is being accumulated or distributed.

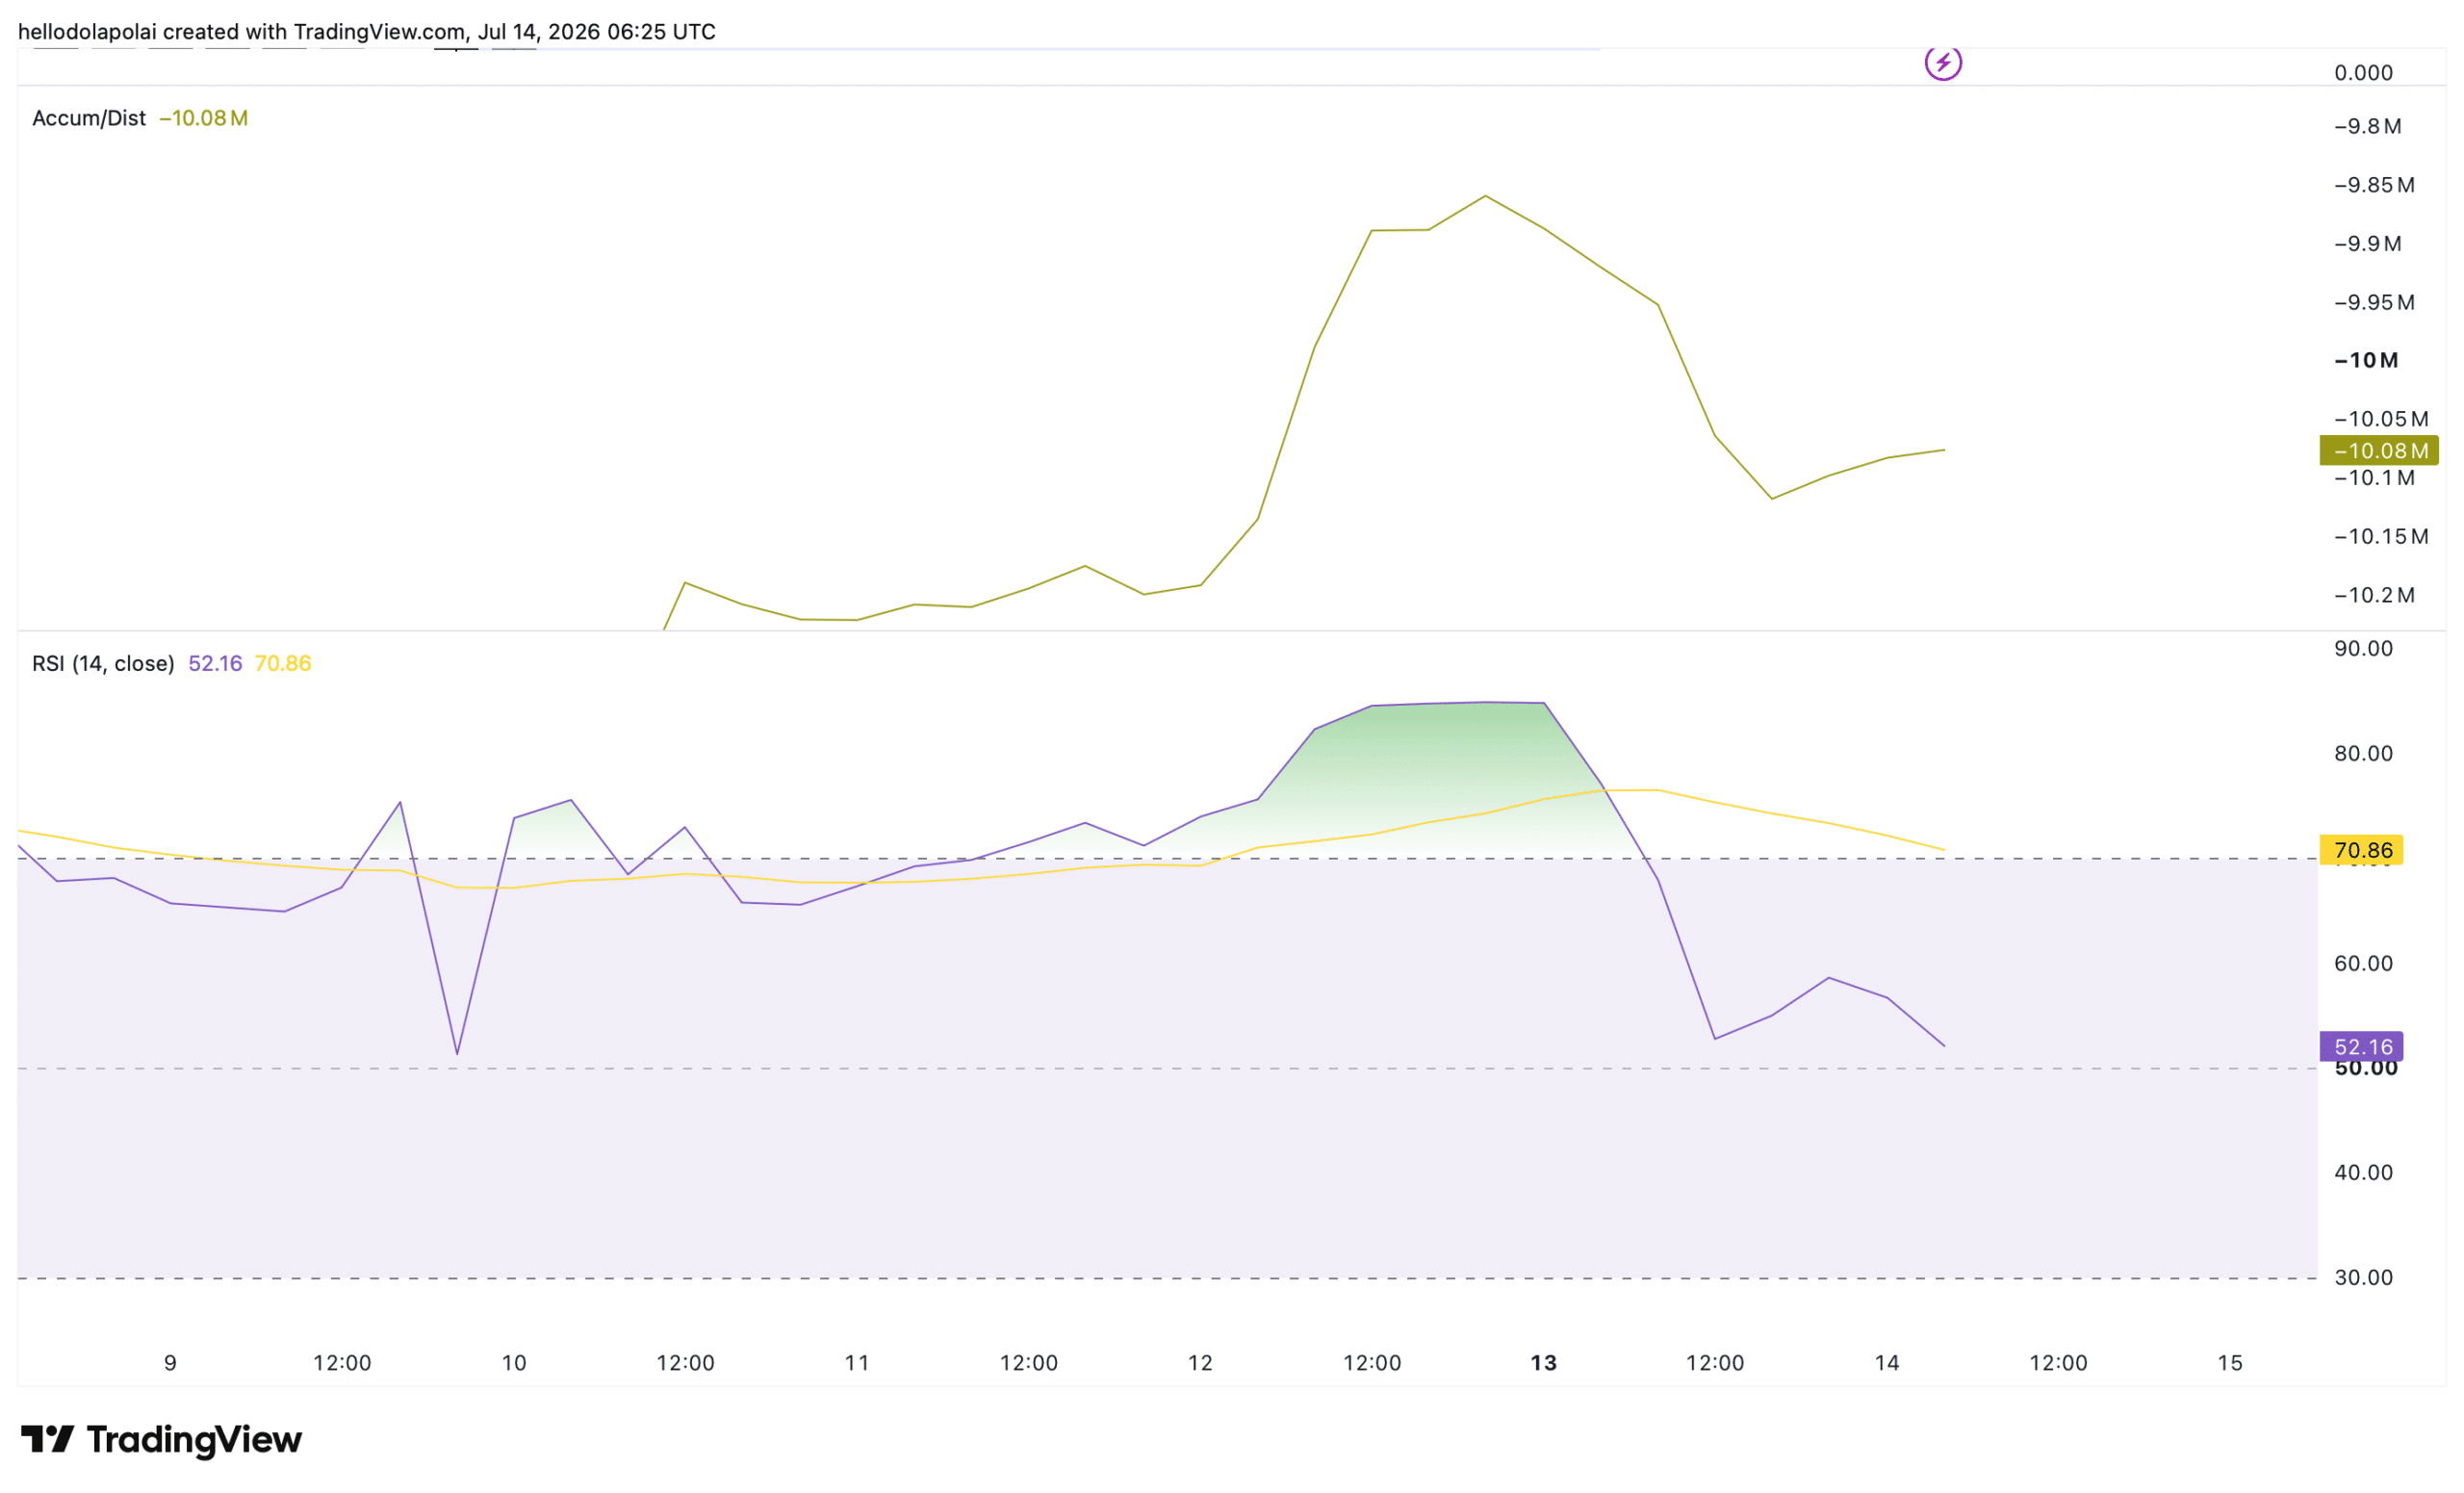
At the time of this report, it was trending slightly upward even as prices fell, a divergence that suggests a modest step-up in buyer activity within the period.
Source: TradingView

Likewise, the relative strength index (RSI) is holding within the bullish 50 to 70 band at a reading of 52.

The RSI measures the speed and magnitude of recent price moves, and a reading sitting right on the midline points to neutral, relaxed sentiment rather than a decisive bearish shift.

The balance suggests the price is likely to settle around this level, which coincides with the demand zone.

Sell pressure eases across the Spot market

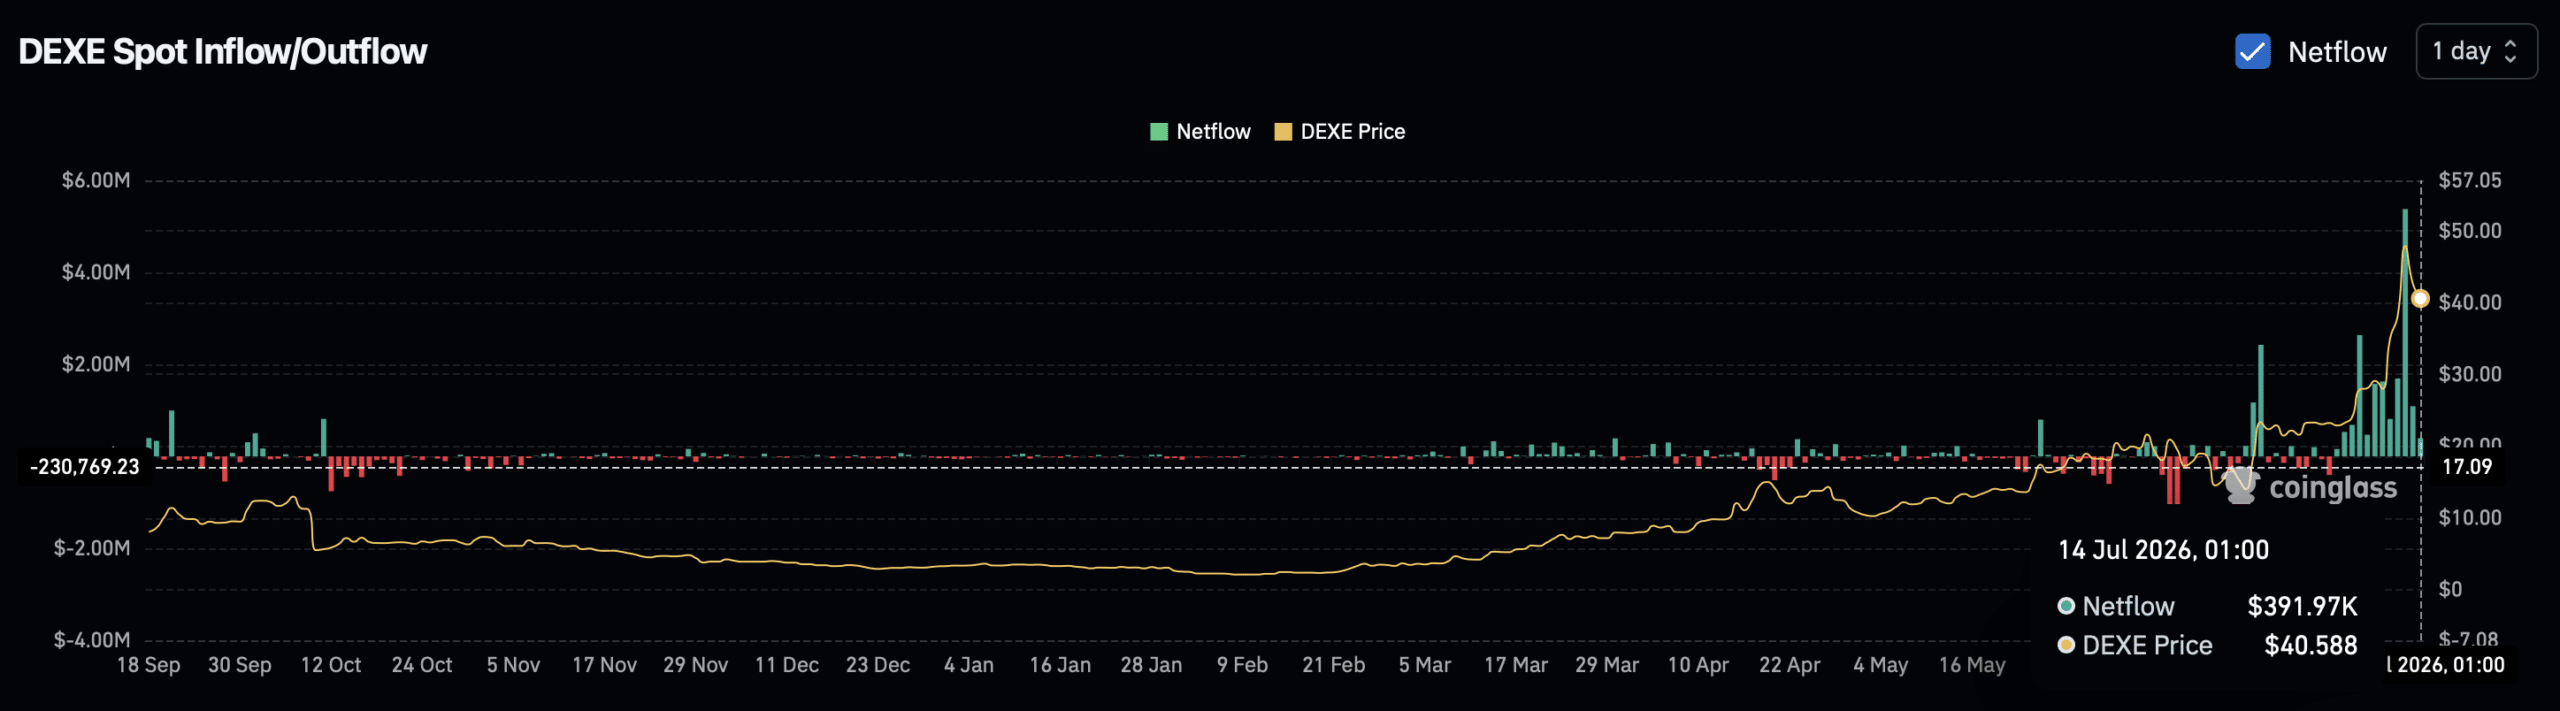
Spot market data points to easing sell pressure so far. Spot netflow hit its highest net sales on the 12th of July as sellers dominated and net inflows reached $5.38 million.

Although sellers still hold the upper hand, the netflow has plunged to just $391,000, more than ten times below the earlier reading.
Source: CoinGlass

This matters because it shows seller strength has weakened sharply on a netflow basis while buyers step in.


Final Summary

  • DeXe has surged more than 1,000% over the past six months, and the current 13% dip looks more like profit-taking after a strong run than a shift in trend.
  • Selling has cooled sharply over the last day, with net sales down more than tenfold from the July 12 peak, a sign that buyers may be stepping back in.


Trending Cryptos

Related Questions

QWhat are the two key demand zones mentioned in the article that could influence DeXe's price?

AThe article mentions Demand zone 1 as the first line of support, and Demand zone 2 as a secondary cushion should selling pressure increase and break the first level.

QWhat do the doji candles (gravestone and dragonfly) observed on DeXe's chart indicate?

AThe gravestone doji indicated intense sell pressure as price attempted to rise, while the dragonfly doji signaled that bulls were stepping back in, exposing a standoff between buyers and sellers.

QWhy does the article suggest the current pullback might be temporary based on trading volume data?

AVolume decreased by 36% alongside the falling price, which often signals weak momentum behind the move and opens room for buyers to take control, suggesting a potential temporary pullback rather than a trend reversal.

QWhat is the significance of the divergence between the A/D (Accumulation/Distribution) line and the price action?

AThe A/D line was trending slightly upward even as prices fell, a divergence suggesting a modest increase in buyer activity (accumulation) during the period, indicating underlying strength.

QWhat key data point from the spot market suggests sell pressure is easing for DeXe?

ANet sales (netflow) have plunged dramatically, from $5.38 million on July 12th to just $391,000, a drop of more than tenfold, indicating seller strength has weakened sharply.

Related Reads

PA Graphics Explanation | One Chart to Understand the Major Web3 Events in August 2026

**PANews Crypto Calendar: Key Web3 Events in August 2026** PANews introduces its revamped crypto calendar, featuring comprehensive coverage, flexible filtering, and easy export options. The market in August will be shaped by multiple key events across macroeconomics, regulation, tokenomics, and project developments: * **Macro & Policy:** Key US economic data releases (July Non-Farm Payrolls, CPI), the Federal Reserve meeting minutes, and the Jackson Hole Economic Symposium will be in focus. On the regulatory front, the US Senate plans to release a new draft of the *CLARITY Act*, while the EU's expanded crypto ban against Belarus comes into effect. * **Token Unlocks:** Significant token unlocks are scheduled for assets including ENA, AVAX, CONX, ZRO, and KAITO, which may influence market volatility. * **Project Updates & Shutdowns:** Several services, including Exchange Art, Ctrl Wallet, Zapper, NFTfi, and Summer.fi, are set to cease operations or undergo major adjustments. Users are advised to manage their assets accordingly. * **Corporate Activity:** Q2 earnings reports from companies like SpaceX, Circle, and Nvidia are due. Unitree Robotics will initiate its IPO subscription on the STAR Market, and Moonshot AI plans to begin a Pre-IPO financing round. * **Industry Events:** Major conferences such as Bitcoin Asia 2026 and the 2026 Digital Expo will take place. The overarching market narrative for August will revolve around macroeconomic expectations, regulatory developments, token unlock schedules, and ongoing industry consolidation.

marsbit5m ago

PA Graphics Explanation | One Chart to Understand the Major Web3 Events in August 2026

marsbit5m ago

Wall Street's Most Famous 'Cassandra' Now Has His Sights Set on Nvidia

Michael Burry, the famed "Big Short" investor, has once again captured Wall Street's attention with a series of short positions against major tech and semiconductor stocks, most notably Nvidia. In late June and July, through his "Cassandra Unchained" newsletter, Burry disclosed short bets against Nvidia, Tesla, Applied Materials, Caterpillar, the SOXX semiconductor ETF, and later, Micron Technology. His core thesis revolves around potential distortions in the AI infrastructure boom, specifically questioning whether extended depreciation schedules (e.g., 6 years vs. a realistic 2-3 years for AI chips) by cloud giants like Microsoft and Google artificially inflate profits. He also raises concerns about possible "off-balance-sheet circular financing," where chip demand might be propped up by vendor-backed funding to clients. Nvidia's stock experienced volatility following these disclosures, briefly dipping but largely holding near Burry's reported entry points, leaving his positions roughly flat or slightly underwater as of late July. This move is part of a pattern for Burry, whose track record since his legendary 2008 bet is mixed. He has faced notable losses, such as on Tesla in 2021, while scoring on broader market turns like the 2020 pandemic crash. His methodology focuses intensely on free cash flow and scrutinizing original financial documents to spot overvaluation and structural risks, but it often struggles with timing the market. The article contrasts Burry's stance with other prominent investors. Steve Eisman, another "Big Short" figure, is not shorting Nvidia, citing strong fundamentals but expressing nervousness about sustainability. Jim Chanos agrees with the broad "accounting mismatch" concern—comparing it to the dot-com bubble—but targets financial leverage in private equity firms rather than the chip stocks themselves. While Nvidia's short interest remains relatively low at 1.3-1.4% of float, the massive stock size means absolute short losses have been significant, exceeding $5 billion earlier this year. The piece concludes that for ordinary investors, the key takeaway is not replicating specific short bets but learning from the critical frameworks these investors use: questioning rosy accounting, identifying structural vulnerabilities, and maintaining skepticism during market euphoria, even if pinpointing the exact catalyst for a downturn remains elusive.

marsbit30m ago

Wall Street's Most Famous 'Cassandra' Now Has His Sights Set on Nvidia

marsbit30m ago

Weekly Selection丨Epic Stock Market Volatility, Changxin Tech's IPO Reshapes Storage Landscape, Saylor Aims to Re-Anchor STRC Around September 8th

PANews Weekly Digest: Market Turmoil, Tech Breakthroughs, and Crypto Developments. The week saw significant volatility across global markets. South Korea's KOSPI index experienced extreme turbulence, including multiple trading halts, largely driven by sharp declines in AI hardware stocks like SK Hynix. In contrast, China's Changxin Xinqiao (CXC) achieved a landmark IPO with a market cap surpassing 4 trillion yuan, marking a major success for the domestic DRAM industry after a decade of losses. In the crypto and Web3 space, several key narratives emerged. AI is driving demand for new infrastructure, with projects like AI agent wallets and programmable payments gaining traction, attracting interest from firms like Coinbase. The Bitcoin mining sector is pivoting, with companies like MARA focusing on energy management as electricity becomes a core AI-era asset. Meanwhile, the RWA (Real World Assets) sector faces a "utilization puzzle," with hundreds of billions in on-chain assets remaining dormant. Notable market movements included a historic single-day surge of over 17% for the KOSPI index and a significant migration of $16.5 billion in staked ETH within the Lido ecosystem. Michael Saylor announced a target to re-peg the STRC stablecoin around September 8th. Other highlights include discussions on Ethereum's ambitious 2030 roadmap for scaling and privacy, analysis showing high protocol revenues not always translating to token price gains, and warnings from Citi about potential extreme commodity price shocks by late 2026.

marsbit35m ago

Weekly Selection丨Epic Stock Market Volatility, Changxin Tech's IPO Reshapes Storage Landscape, Saylor Aims to Re-Anchor STRC Around September 8th

marsbit35m ago

When the Market Begins to Question AI Capex: A Full Analysis of Q2 Earnings Reports from Five Tech Giants

In late July 2026, five major US tech giants—Alphabet, Intel, Microsoft, Meta, and Apple—released their Q2 earnings reports. While all companies exceeded revenue and profit expectations, driven by strong AI-related business growth, investor reactions diverged sharply due to concerns over escalating AI capital expenditures (capex) and their impact on free cash flow. Alphabet reported strong revenue growth and a surging cloud business, but its stock fell after announcing a doubled year-on-year capex and negative quarterly free cash flow for the first time. Intel posted its strongest revenue growth in over 15 years, but its stock experienced volatile trading after significantly raising its full-year capex guidance. Microsoft saw its stock surge after beating estimates and, crucially, lowering its capex forecast while projecting positive free cash flow. Meta faced the most severe sell-off as its profits declined despite revenue beats, with free cash flow plunging over 90% and its capex guidance raised. Apple reported record June-quarter results, but its stock plummeted after providing Q4 revenue guidance that fell short of expectations, citing supply chain constraints and forex headwinds. The overall takeaway is that the market's focus has shifted from validating AI demand to scrutinizing the timeline for returns on massive AI investments. Companies demonstrating a clearer path to managing capex and preserving free cash flow, like Microsoft, were rewarded, while those signaling continued aggressive spending faced investor skepticism.

Odaily星球日报45m ago

When the Market Begins to Question AI Capex: A Full Analysis of Q2 Earnings Reports from Five Tech Giants

Odaily星球日报45m ago

a16z: From Companies to DAOs, DUNA May Become the Next Generation Organizational Form

This article, "From Companies to DAOs: How DUNA Could Become the Next Organizational Form," traces the 500-year evolution of business collaboration. It begins with medieval structures like the *commenda* and Florentine *compagnia*, which exposed partners to personal risk. The modern corporation, exemplified by the Dutch East India Company (VOC), was a revolutionary leap, enabling large-scale, capital-intensive ventures by offering limited liability and reducing coordination costs. However, corporations introduced new challenges like principal-agent problems and bureaucratic overhead. The piece argues that software and internet-native protocols are now reducing these traditional overheads. Decentralized Autonomous Organizations (DAOs) emerged as a new model for coordination without centralized management. Yet, DAOs face a significant legal vacuum: they lack legal recognition, leaving members exposed to unlimited personal liability, and their tokens are vulnerable to being classified as securities under unclear regulations (e.g., the Howey Test). This has forced projects into suboptimal workarounds like offshore foundations. The article identifies the Decentralized Unincorporated Nonprofit Association (DUNA) as a potential solution. Recently legalized in states like Wyoming, the DUNA provides a legal wrapper for decentralized networks. It grants key protections—legal personality, limited liability, and perpetual existence—to a group without imposing a traditional hierarchical management structure. This allows token-holder communities to govern, hold assets, and contract as a single legal entity, aligning with their decentralized nature. While DUNA doesn't solve all governance challenges or magically resolve securities law questions, it represents a crucial step. It fills the legal recognition gap, offering a native legal form for internet-scale, decentralized collaboration and extending the separation of personal risk from organizational venture into a new domain.

marsbit1h ago

a16z: From Companies to DAOs, DUNA May Become the Next Generation Organizational Form

marsbit1h ago

Trading

Spot

Hot Articles

How to Buy DEXE

Welcome to HTX.com! We've made purchasing DeXe (DEXE) simple and convenient. Follow our step-by-step guide to embark on your crypto journey.Step 1: Create Your HTX AccountUse your email or phone number to sign up for a free account on HTX. Experience a hassle-free registration journey and unlock all features.Get My AccountStep 2: Go to Buy Crypto and Choose Your Payment MethodCredit/Debit Card: Use your Visa or Mastercard to buy DeXe (DEXE) instantly.Balance: Use funds from your HTX account balance to trade seamlessly.Third Parties: We've added popular payment methods such as Google Pay and Apple Pay to enhance convenience.P2P: Trade directly with other users on HTX.Over-the-Counter (OTC): We offer tailor-made services and competitive exchange rates for traders.Step 3: Store Your DeXe (DEXE)After purchasing your DeXe (DEXE), store it in your HTX account. Alternatively, you can send it elsewhere via blockchain transfer or use it to trade other cryptocurrencies.Step 4: Trade DeXe (DEXE)Easily trade DeXe (DEXE) on HTX's spot market. Simply access your account, select your trading pair, execute your trades, and monitor in real-time. We offer a user-friendly experience for both beginners and seasoned traders.

4.3k Total ViewsPublished 2024.03.29Updated 2026.06.02

How to Buy DEXE

Discussions

Welcome to the HTX Community. Here, you can stay informed about the latest platform developments and gain access to professional market insights. Users' opinions on the price of DEXE (DEXE) are presented below.

活动图片