CryptoStar
11/15 15:15
Hedera Breakout Run Gains Momentum
Hedera Breakout Run Gains Momentum
In the weekly chart, the HBAR token shows a trendline breakout rally gaining momentum. The trendline breakout concludes the pullback phase started in early 2024, after creating a peak at $0.14.
Currently, it is trading at $0.065 and is currently creating a second consecutive weekly bullish candle. As the bullring gains momentum, the HBAR price has increased by nearly 60% in the last 12 days.
In the weekly chart, the bullish reversal is currently challenging the 100-day simple moving average line, as it had faced higher price rejection from the 50-day SMA. A bullish breakout above the 50-day SMA line is likely to challenge the 23.60% Fibonacci level at $0.133.
As the bullish influence grows, the MACD and signal lines are giving a positive crossover, as furthermore the positive histograms are resurfacing, increasing the possibility of a bullrun. 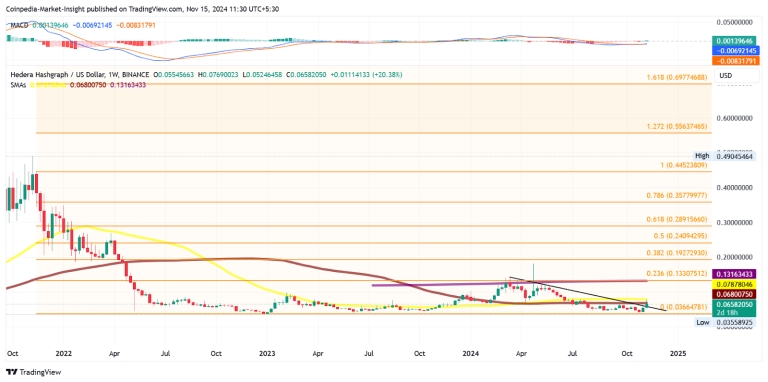
#Share Your Thoughts on Popular Assets in March#Contest for HTX Community's Most Popular Post#Hit March's Interaction Leaderboard
13Поделиться
Все комментарии0НовыеВ тренде