
Mr4Beast
07/05 21:08
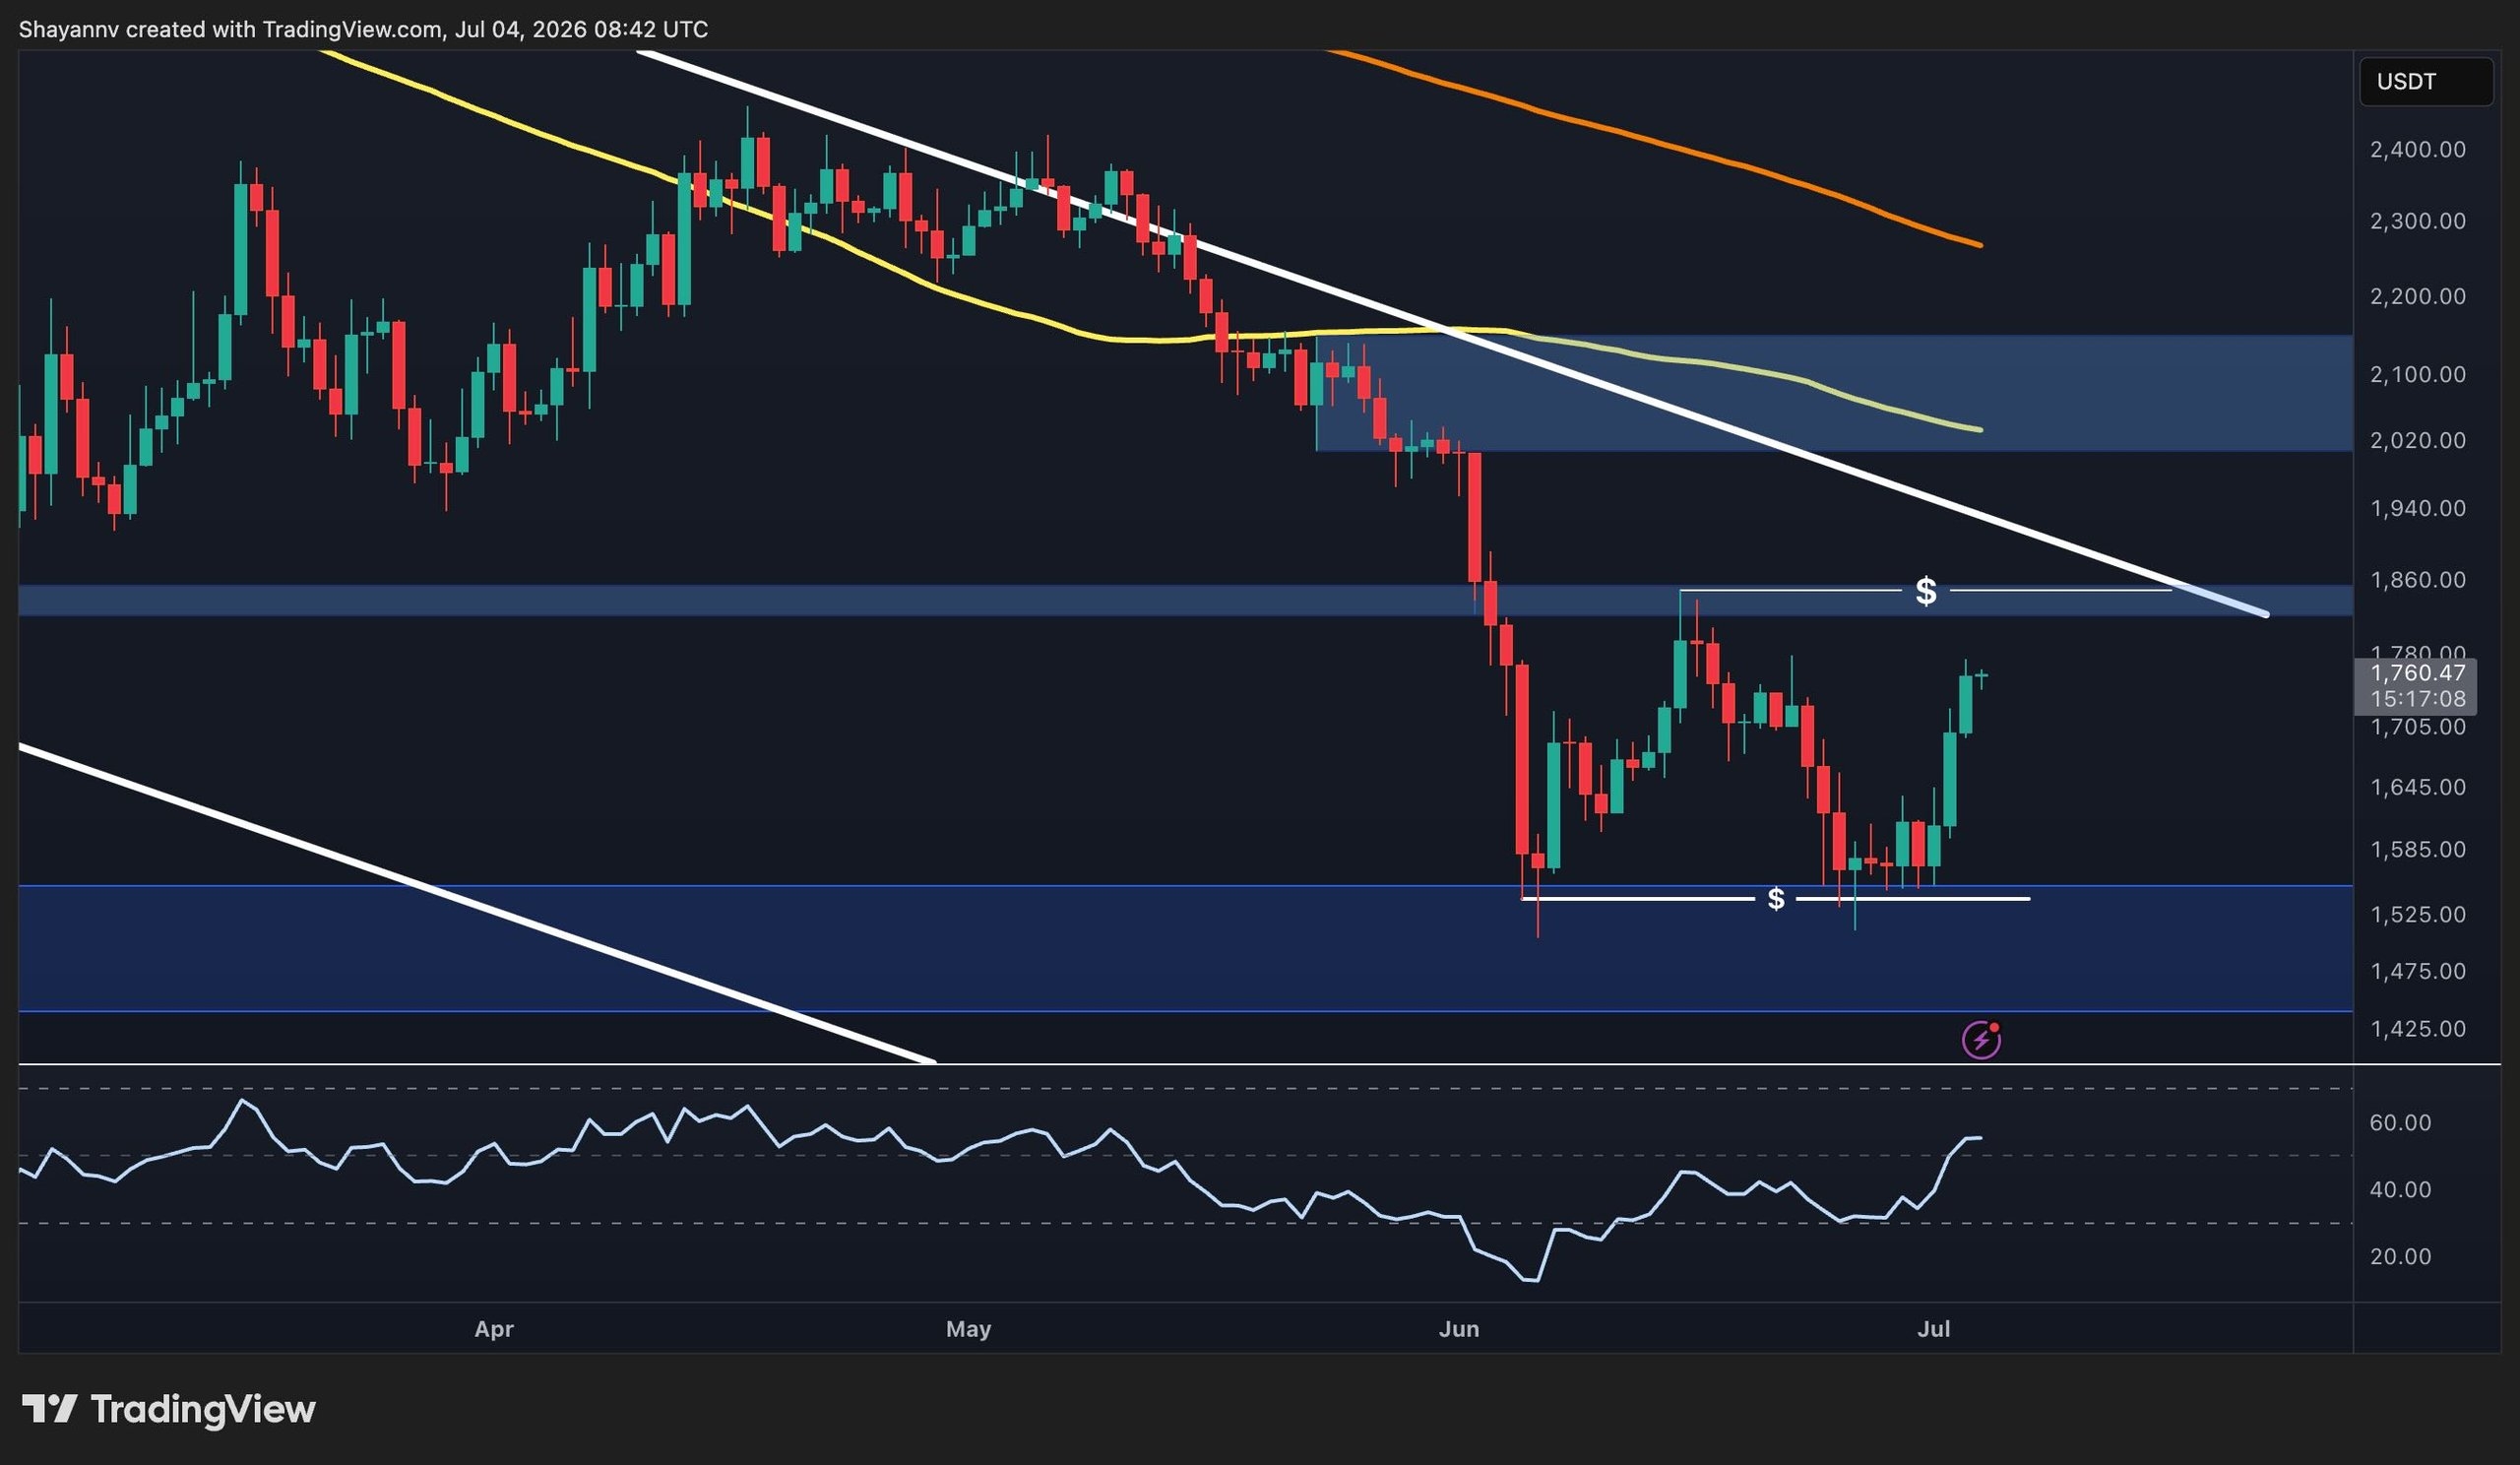
Ethereum Price Analysis: The Daily Chart
The recent advance has also reclaimed the $1.70K area, placing ETH just below the next key resistance cluster around $1.82K-$1.86K. This region is particularly important because it aligns with the long-term descending trendline, creating a significant technical confluence.
Momentum has improved considerably. The previously discussed bullish RSI divergence has continued to play out, with the indicator making higher highs while price has recovered sharply from support. This suggests bearish momentum has weakened substantially compared to previous sell-offs.
Nevertheless, the broader trend cannot be considered bullish until Ethereum breaks above the descending trendline and reclaims the higher resistance band. A rejection from this area would preserve the sequence of lower highs that has defined the market for the past several months.
#HTX Invites You to Share 600K USDT in Gift Packs#2026 World Cup Posting Challenge on HTX Square#World Cup Predictions: 100,000 USDT Daily
4Поделиться
Все комментарии0НовыеВ тренде