Trading King
08/22 05:47
Indicators Show Bearish Tilt
Indicators Show Bearish Tilt
Momentum is biased in favor of bears. The 9-day DEMA is at $0.2197, with the price below it. A recapture above the line would be the initial early strength signal, but rejection would maintain pressure in place.
The Relative Strength Index is at 47.33, slightly below the neutral 50 mark. Its signal line at 53.50 validates bearish weight. RSI is not yet oversold and is indicative of more downside space before relief buying sets in
Dogecoin Price Analysis: Can $0.21 Support Hold Against Bearish Momentum? 3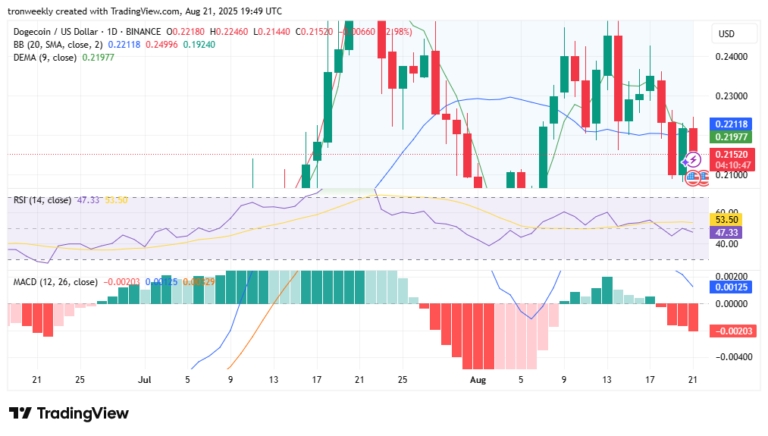
MACD contributes to this conservative mood. The MACD line at -0.00203 is below the signal line, affirming a bear cross. The histogram bars are turning red, indicating building momentum against the buyers.
Important levels in the future are obvious. The resistance is at $0.2197 and $0.2211, while the next hurdle is at $0.2300. A break below $0.2100 may push the price of Dogecoin down to $0.1924 or even $0.1800 in case of added selling interest.
Все комментарии0НовыеВ тренде