BTC7338
08/10 17:53
The 4-hour chart shows the latest price action. It
The 4-hour chart shows the latest price action. It can be seen that the breakout of the W pattern did eventually happen. This took the $BTC price beyond $117,000, and a long candle wick down confirmed the breakout, as well as providing evidence of the huge intent of the bulls to buoy the price up.
As things stand, the price is currently taking hold above $116,800 which might now be a tenuous support. It could be that there is enough momentum in the tank to take the price back up to the $117,450 resistance, and even to the top of the bull flag, which coincides with the $118,000 resistance level.
Be that as it may, all shorter term Stochastic RSI indicators are now at or near the top, suggesting that this upward impulse may be about to come to an end. The top of the bull flag would be an ideal place for a reversal to occur.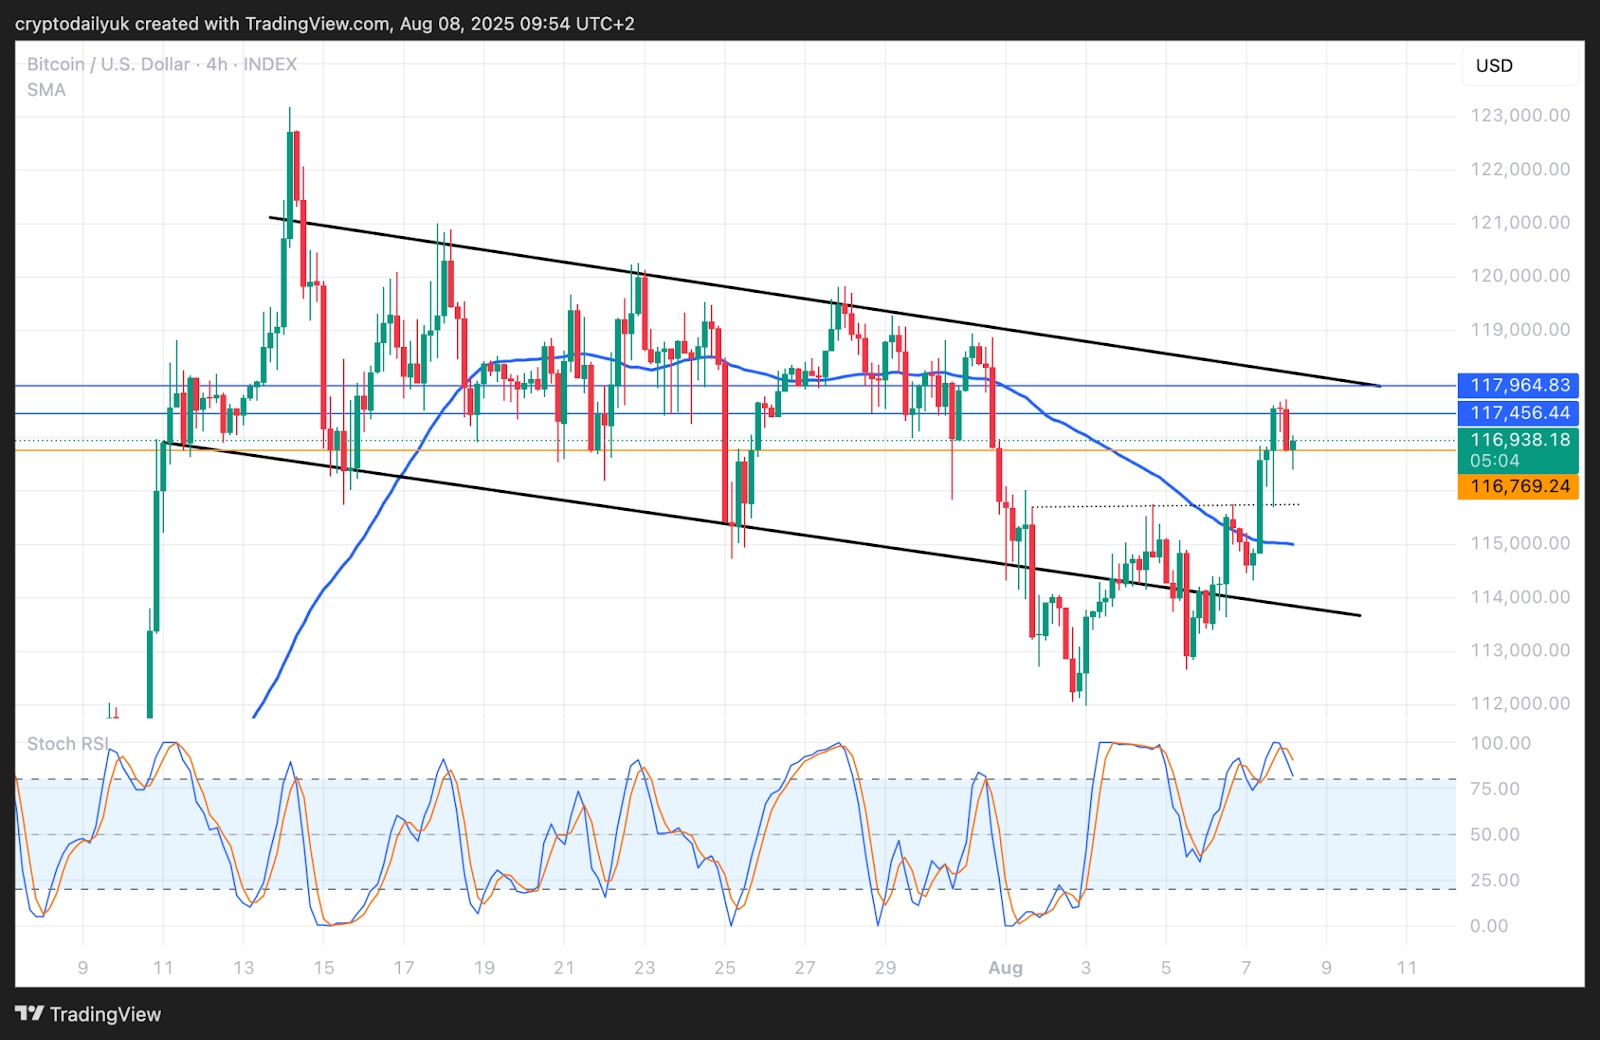
#Claim1,200 USDT in the Monthly Creation Challenge#Post To Earn Bonus#Win 200 USDT: Is ETH Kicking Off Altcoin Season? #Buy Bitcoin’s dip,’ says Eric Trump#Do you think Tanssi is promising?
10Поделиться
Все комментарии0НовыеВ тренде